. 2018 May;22(5):2612-2621.
doi: 10.1111/jcmm.13525. Epub 2018 Mar 7.

ETS1 and SP1 drive DHX15 expression in acute lymphoblastic leukaemia

Affiliations

ETS1 and SP1 drive DHX15 expression in acute lymphoblastic leukaemia

Xiang-Lei Chen et al. J Cell Mol Med. 2018 May.

Abstract

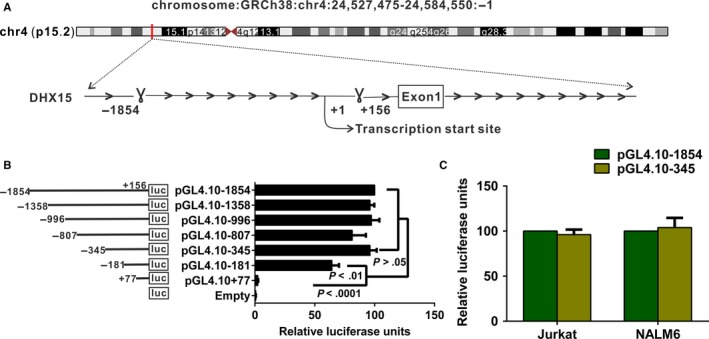
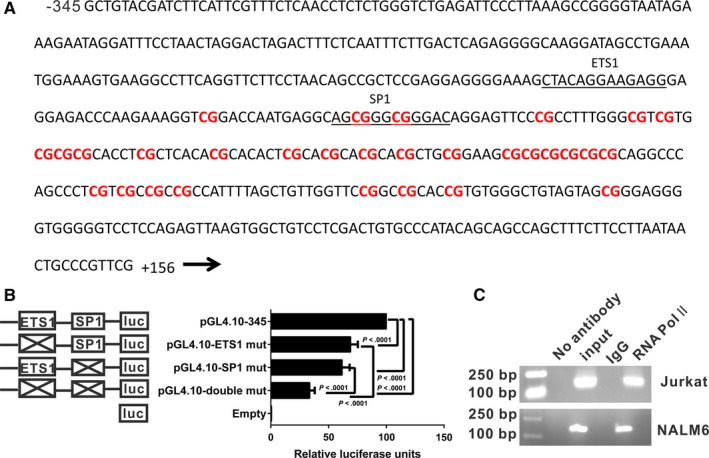
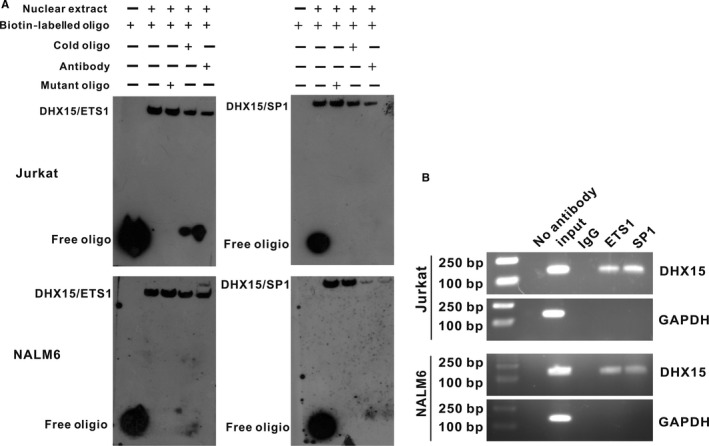
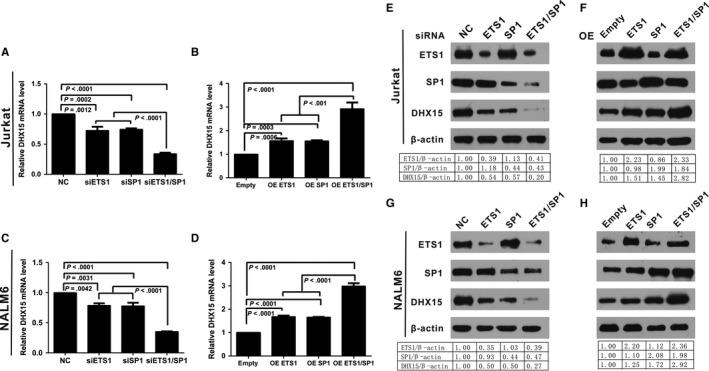
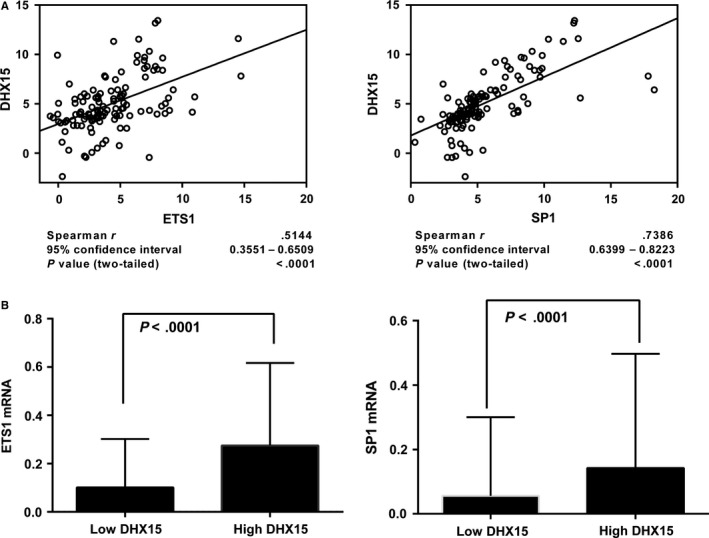
DHX15 plays a role in leukaemogenesis and leukaemia relapse. However, the mechanism underlying the transcriptional regulation of DHX15 in ALL has not been elucidated. Our present study aimed to explore the functional promoter region of DHX15 and to investigate the transcription factors controlling the transcription of this gene. A luciferase assay performed with several truncated constructs identified a 501-bp region as the core promoter region of DHX15. Site-directed mutagenesis, electrophoretic mobility shift and chromatin immunoprecipitation assays showed that ETS1 and SP1 occupied the DHX15 promoter. Furthermore, knockdown of ETS1 and SP1 resulted in suppression of DHX15, whereas the overexpression of these genes led to up-regulation of DHX15. Interestingly, in samples obtained from patients with ALL at diagnosis, both ETS1 and SP1 correlated positively with DHX15 expression. Additionally, differences in methylation of the DHX15 core promoter region were not observed between the patients and controls. In conclusion, we identified the core promoter region of DHX15 and demonstrated that ETS1 and SP1 regulated DHX15 expression in ALL.

Keywords: DHX15; ETS1; SP1; promoter.


Figures

Figure 1
Figure 1
Identification of the DHX15 promoter. A, Schematic representation of the chromosome location and promoter region of the DHX15 gene. Luciferase assays with the DHX15 promoter constructs in Jurkat B and NALM6 C, cells. The results represent relative firefly/Renilla luciferase activities, with the activity of pGL4.10‐1854 considered 100%. Values shown are the means ± SDs of three independent experiments
Figure 2
Figure 2
A, The genomic sequence of the DHX15 core promoter is shown. The sequence spans nucleotides −345 to +156 upstream of the DHX15 gene. The DHX15 promoter harbours binding sites for several transcription factors, which are shown underlined, based on predictions from in silico programs. Thirty CpG sites (indicated in red) are present in this region. B, Luciferase assays using constructs with mutations in the 501‐bp region with the predicted transcription binding sites in Jurkat cells. The results represent relative firefly/Renilla luciferase activities, with the activity of the WT 501‐bp region considered 100%. The values are expressed as the means ± SDs from three independent experiments. C, Jurkat and NALM6 cell chromatin was immunoprecipitated with an RNA Pol II antibody. Reactions with non‐immune IgG, no antibody and input DNA served as the negative and positive controls. After removal of the cross‐links, the immunoprecipitated DNA was PCR‐amplified using a primer flanking the basal DHX15 promoter region from −303 to −159 bp. The PCR products were subjected to agarose gel electrophoresis
Figure 3
Figure 3
EMSA and ChIP analyses of ETS1 and SP1 binding to the DHX15 promoter. A, EMSA of ETS1 (left) and SP1 (right). The 5′‐biotin end‐labelled probe was incubated in the absence (lane 0) or presence (lane 1) of nuclear extracts from Jurkat and NALM6 cells. A cold mutated probe (lane 2) and cold probe (lane 3) were used as competitors at concentrations that were in a 100‐fold molar excess to the biotin‐labelled probe. Supershift assays were performed with 4 μg of a specific antibody against ETS1 or SP1 (lane 4). B, Equal amounts of Jurkat and NALM6 chromatin were immunoprecipitated with antibodies for ETS1 and SP1 and subsequently quantified through agarose gel electrophoresis using a primer set specific for the basal region (−181 to −36 bp). Moreover, immunoprecipitated DNA was amplified using a primer set specific to the off‐target region (GAPDH) shown in the lower panel as a negative control
Figure 4
Figure 4
Influence of ETS1 and SP1 on DHX15 gene transcription and protein expression in Jurkat and NALM 6 cells. A, C, E, G, Knockdown of endogenous ETS1 or SP1 or ETS1 and SP1 together decreased DHX15 gene transcription and protein expression. Jurkat and NALM6 cells were transfected with 100 pmol of siRNAs targeting ETS1, SP1 or ETS1 and SP1 together or a negative control (NC). The cells were harvested 48 h after transfection, and 2 μg of the total RNA was used to detect the DHX15 mRNA level through qPCR. The relative mRNA level was obtained after comparison with the NC, which was set to 1 A, C. Western blotting analysis of total proteins with anti‐ETS1, anti‐SP1 and anti‐DHX15 antibodies was performed for the Jurkat and NALM6 cells; anti‐β‐actin served as a loading control E, G. B, D, F, H, Overexpression (OE) of ETS1 or SP1 or ETS1 and SP1 together increased DHX15 gene transcription and protein expression. Jurkat cells were transfected with 4 μg of pcDNA3.1(‐)/SP1, pEnter‐ETS1, pcDNA3.1(‐)/SP1 and pEnter‐ETS1 together or the empty control pcDNA3.1(‐) pEnter. The cells were harvested 48 h after transfection, and 2 μg of total RNA was used to detect the DHX15 mRNA level through qPCR. The relative mRNA level was obtained after comparison with the empty vector, which was set to 1 B, D. Western blotting analysis of total proteins with anti‐ETS1, anti‐SP1 and anti‐DHX15; anti‐β‐actin served as a loading control F, H
Figure 5
Figure 5
Correlation of the DHX15 levels with the ETS1 and SP1 levels in 121 ALL peripheral blood mononuclear cell (PBMC) samples. A, The qPCR results were evaluated for correlations using Spearman's correlation coefficient, and the correlation coefficient “r” was calculated. B, Box plot analyses comparing the ETS1 and SP1 levels between samples with low and high DHX15 expression levels. All qPCR results were normalized to GAPDH. The samples were divided into low and high DHX15 expression groups based on the median value

Similar articles

Cited by

References

    1. Jabbour EJ, Faderl S, Kantarjian HM. Adult acute lymphoblastic leukemia. Mayo Clin Proc. 2005;80:1517‐1527. - PubMed
    1. Pui CH, Relling MV, Downing JR. Acute lymphoblastic leukemia. N Engl J Med. 2004;350:1535‐1548. - PubMed
    1. Ueno S, Lu J, He J, et al. Aberrant expression of SALL4 in acute B cell lymphoblastic leukemia: mechanism, function, and implication for a potential novel therapeutic target. Exp Hematol. 2014;42:307‐316e8. - PMC - PubMed
    1. Crazzolara R, Kreczy A, Mann G, et al. High expression of the chemokine receptor CXCR4 predicts extramedullary organ infiltration in childhood acute lymphoblastic leukaemia. Br J Haematol. 2001;115:545‐553. - PubMed
    1. Ferrando AA, Neuberg DS, Staunton J, et al. Gene expression signatures define novel oncogenic pathways in T cell acute lymphoblastic leukemia. Cancer Cell. 2002;1:75‐87. - PubMed

Publication types

MeSH terms