

Reactivity of larger intracranial arteries using 7 T MRI in young adults
- PMID: 29513623
- PMCID: PMC6668520
- DOI: 10.1177/0271678X18762880
Reactivity of larger intracranial arteries using 7 T MRI in young adults
Abstract
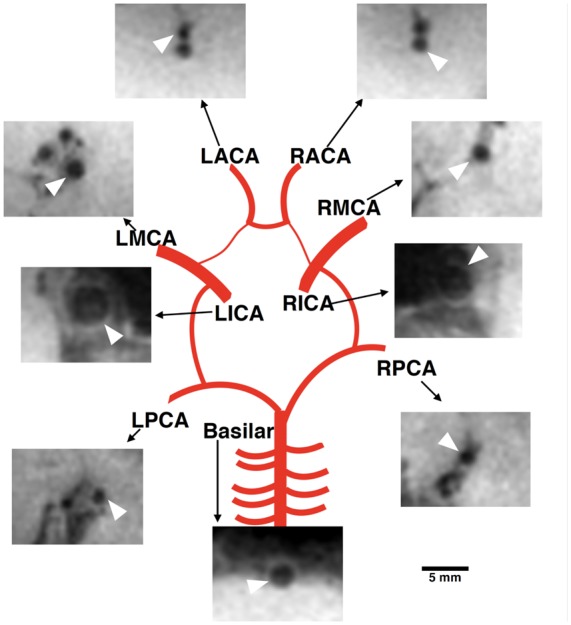
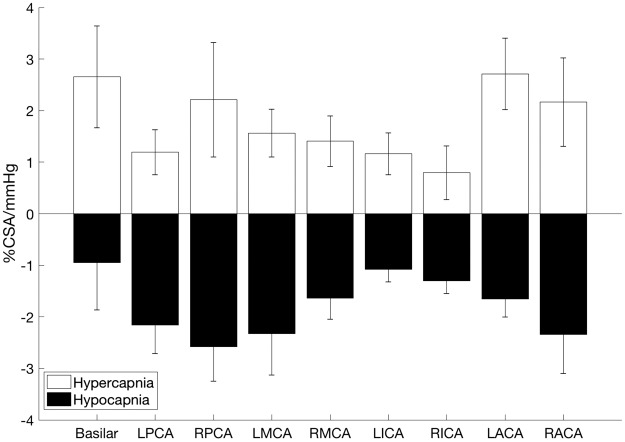
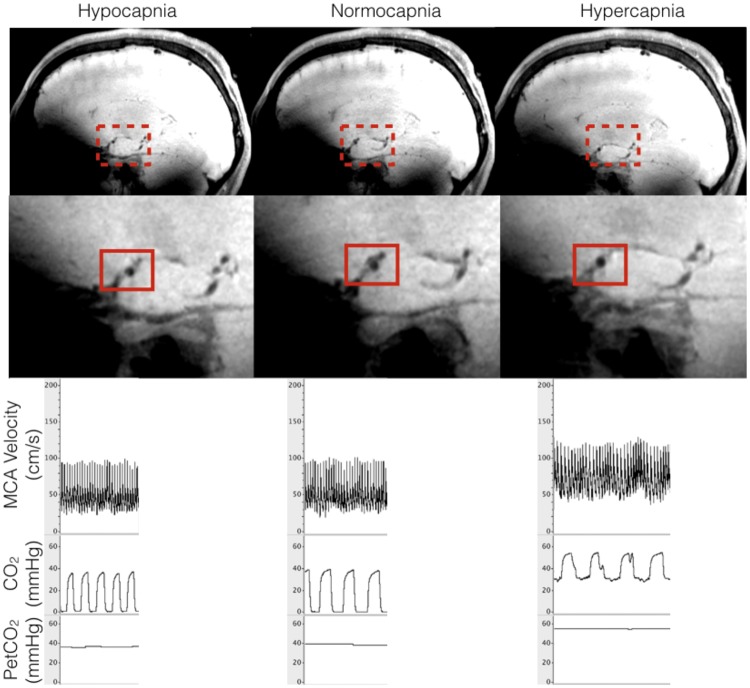
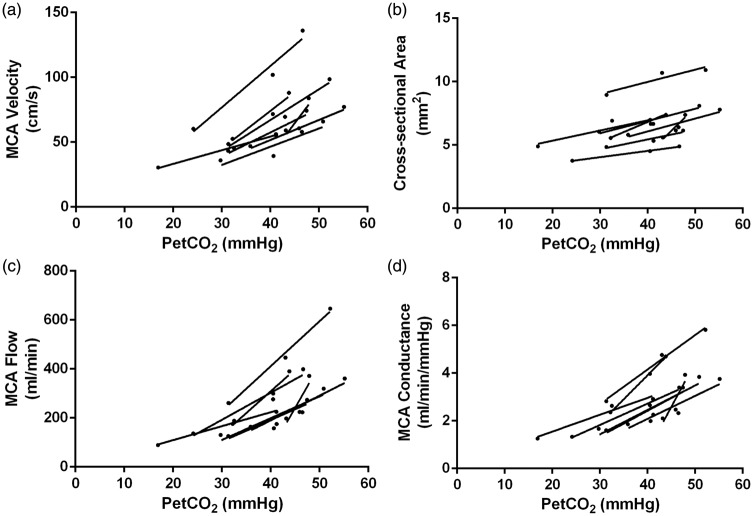
The larger intracranial conduit vessels contribute to the total cerebral vascular resistance, and understanding their vasoreactivity to physiological stimuli is required when attempting to understand regional brain perfusion. Reactivity of the larger cerebral conduit arteries remains understudied due to a need for improved imaging methods to simultaneously assess these vessels in a single stimulus. We characterized reactivity of basal intracranial conduit arteries (basilar, right and left posterior, middle and anterior cerebral arteries) and the right and left internal carotid arteries, to manipulations in end-tidal CO2 (PetCO2). Cross-sectional area changes (%CSA) were evaluated from high-resolution (0.5 mm isotropic) images collected at 7 T using a T1-weighted 3D SPACE pulse sequence, providing high contrast between vessel lumen and surrounding tissue. Cerebrovascular reactivity was calculated as %CSA/ΔPetCO2 in eight healthy individuals (18-23 years) during normocapnia (41 ± 4 mmHg), hypercapnia (48 ± 4 mmHg; breathing 5% CO2, balance oxygen), and hypocapnia (31 ± 8 mmHg; via hyperventilation). Reactivity to hypercapnia ranged from 0.8%/mmHg in the right internal carotid artery to 2.7%/mmHg in the left anterior cerebral artery. During hypocapnia, vasoconstriction ranged from 0.9%/mmHg in the basilar artery to 2.6%/mmHg in the right posterior cerebral artery. Heterogeneous cerebrovascular reactivity to hypercapnia and hypocapnia was characterized across basal intracranial conduit and internal carotid arteries.
Keywords: Cerebral blood flow; hemodynamics; imaging; magnetic resonance imaging; ultrasound.
Figures
References
-
- Huber P, Handa J. Effect of contrast material, hypercapnia, hyperventilation, hypertonic glucose and papaverine on the diameter of the cerebral arteries. Angiographic determination in man. Invest Radiol 1967; 2: 17–32. - PubMed
-
- Coverdale NS, Gati JS, Opalevych O, et al. Cerebral blood flow velocity underestimates cerebral blood flow during modest hypercapnia and hypocapnia. J Appl Physiol 2014; 117: 1090–1096. - PubMed
-
- Serrador JM, Picot PA, Rutt BK, et al. MRI measures of middle cerebral artery diameter in conscious humans during simulated orthostasis. Stroke 2000; 31: 1672–1678. - PubMed
-
- Verbree J, Bronzwaer AS, Ghariq E, et al. Assessment of middle cerebral artery diameter during hypocapnia and hypercapnia in humans using ultra-high-field MRI. J Appl Physiol 2014; 117: 1084–1089. - PubMed
-
- Faraci FM, Heistad DD. Regulation of large cerebral arteries and cerebral microvascular pressure. Circ Res 1990; 66: 8–17. - PubMed
Publication types
MeSH terms
Substances
Grants and funding
LinkOut - more resources
Full Text Sources
Other Literature Sources
Medical
