. 2018 Mar 15;555(7696):387-391.
doi: 10.1038/nature25748. Epub 2018 Mar 7.

EWS-FLI1 increases transcription to cause R-loops and block BRCA1 repair in Ewing sarcoma

Affiliations

EWS-FLI1 increases transcription to cause R-loops and block BRCA1 repair in Ewing sarcoma

Aparna Gorthi et al. Nature. .

Erratum in

Abstract

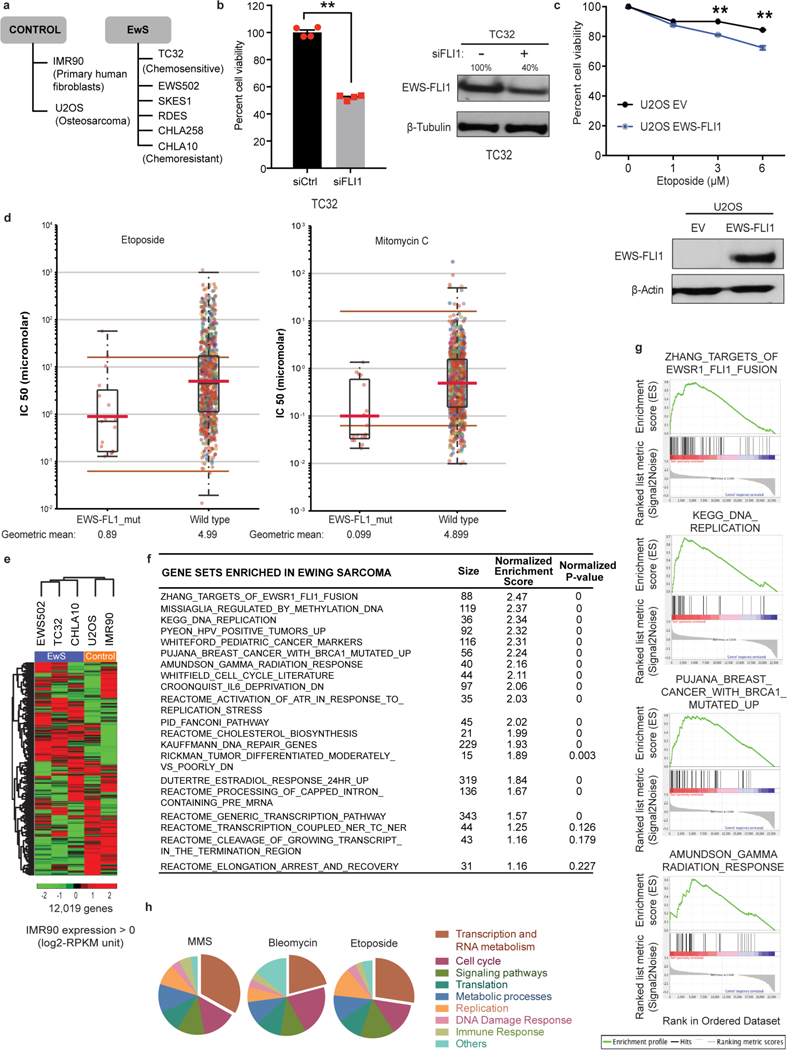
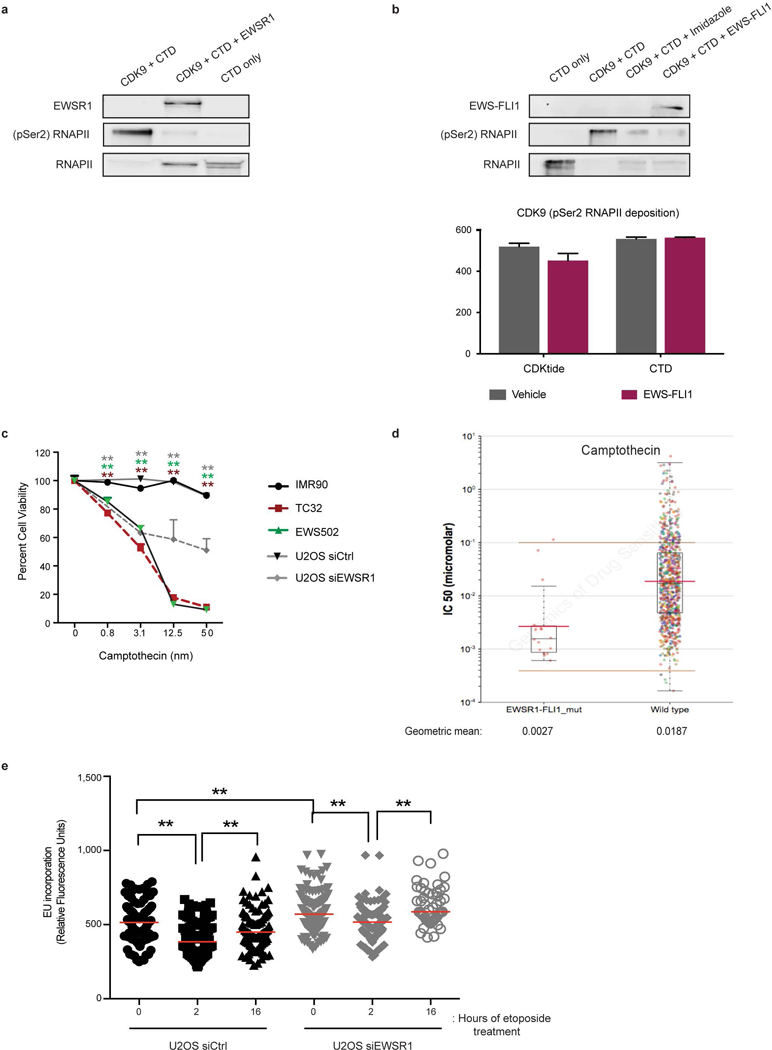
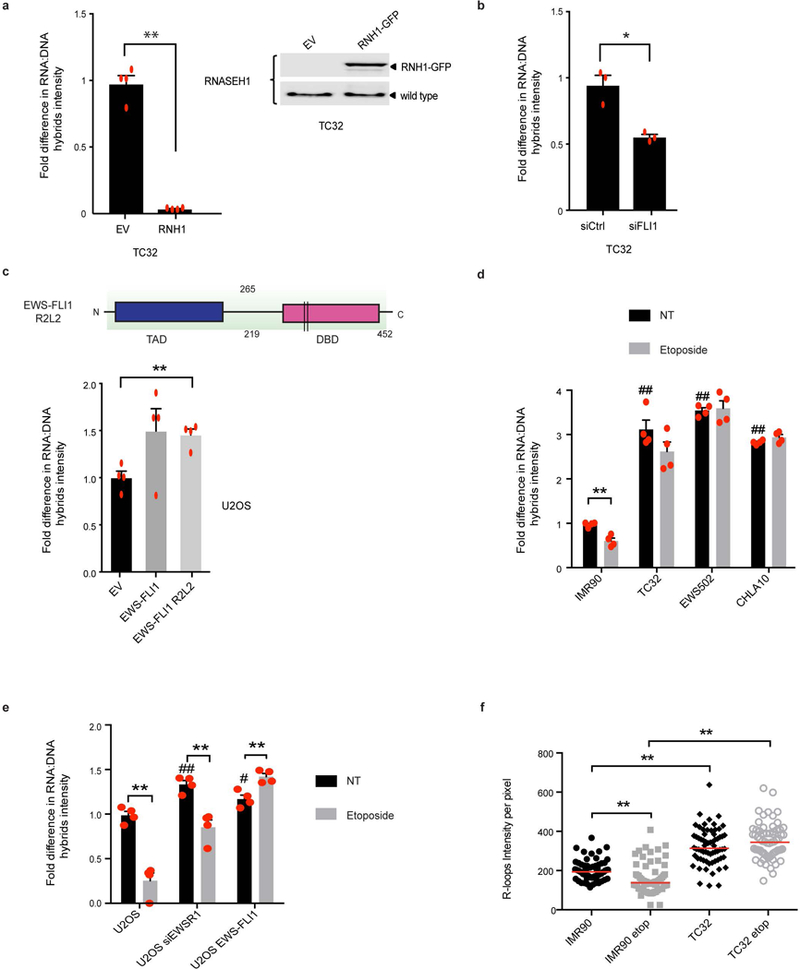
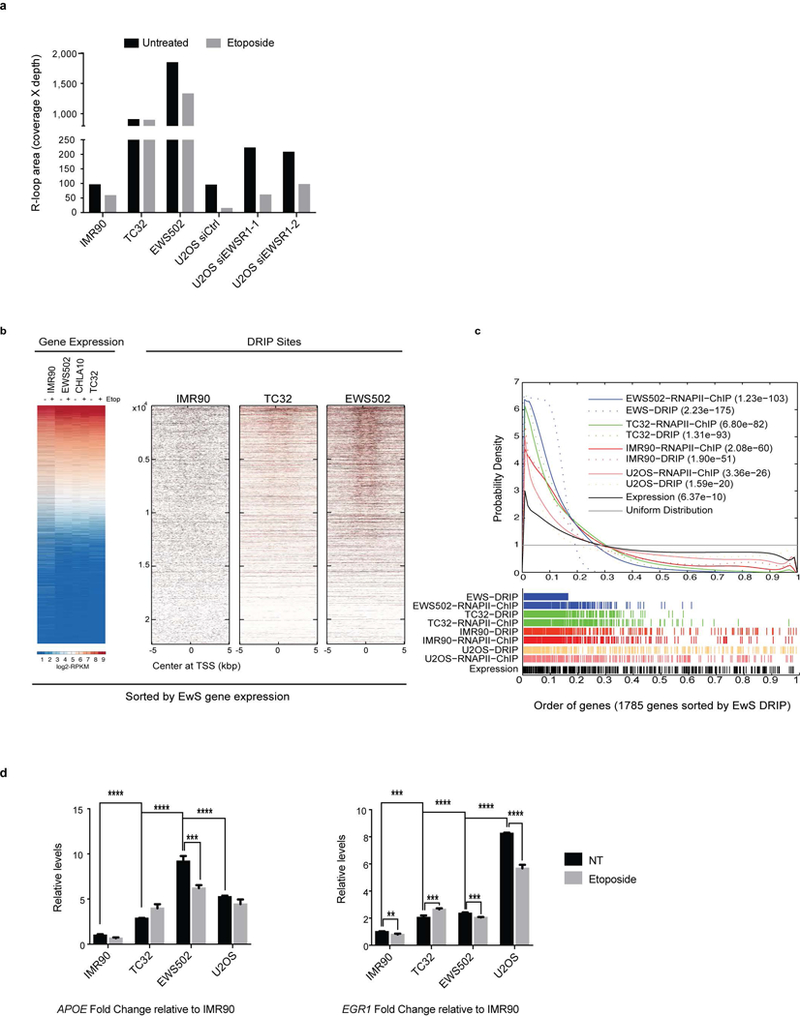
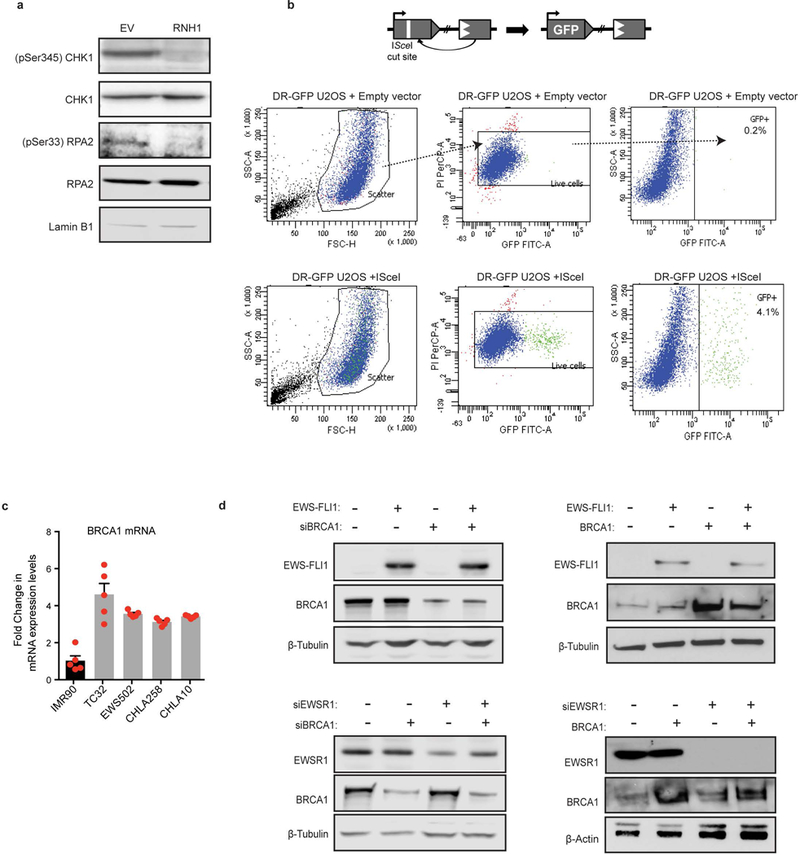
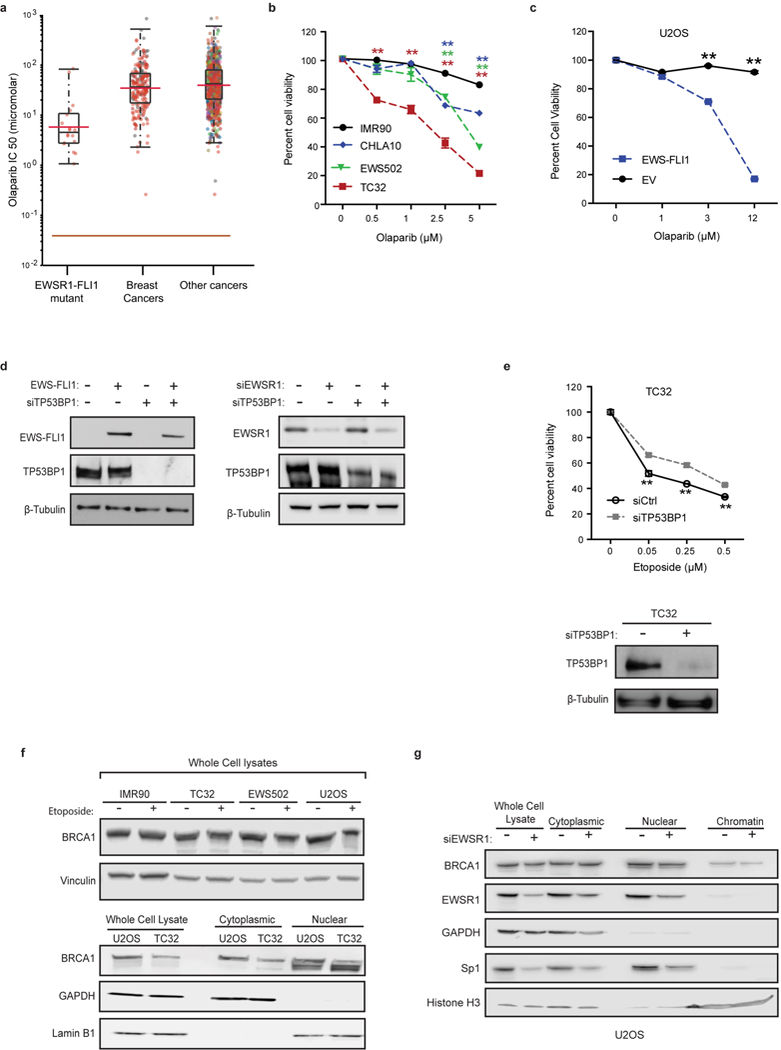
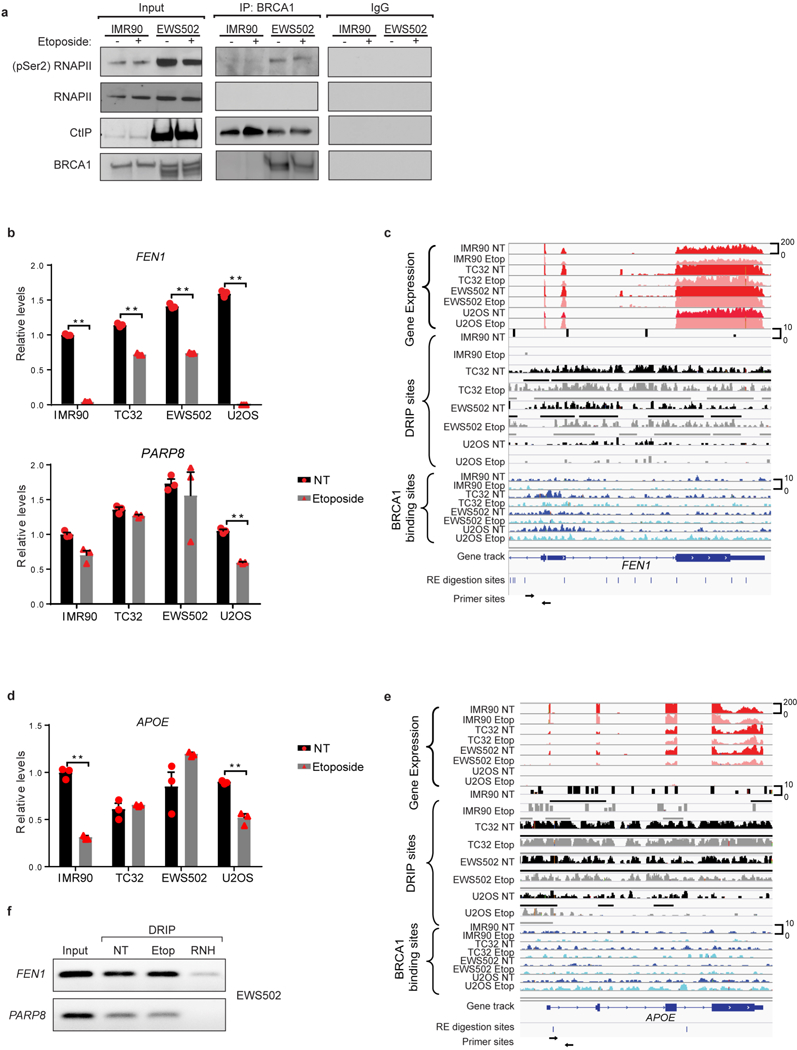
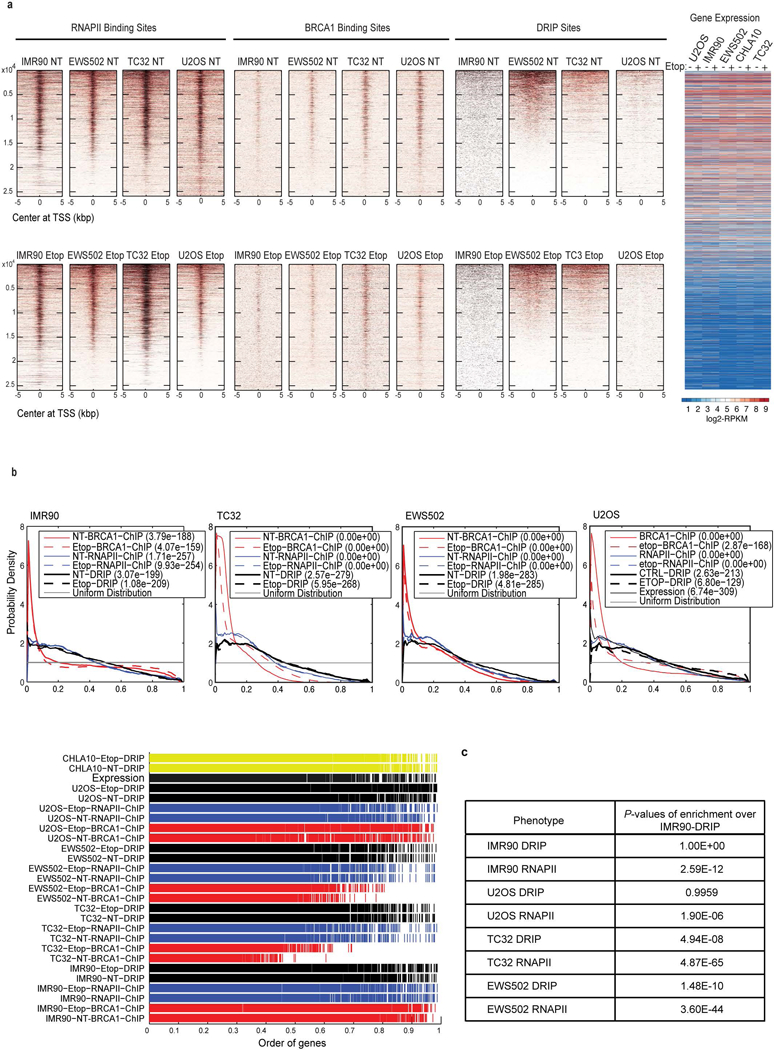
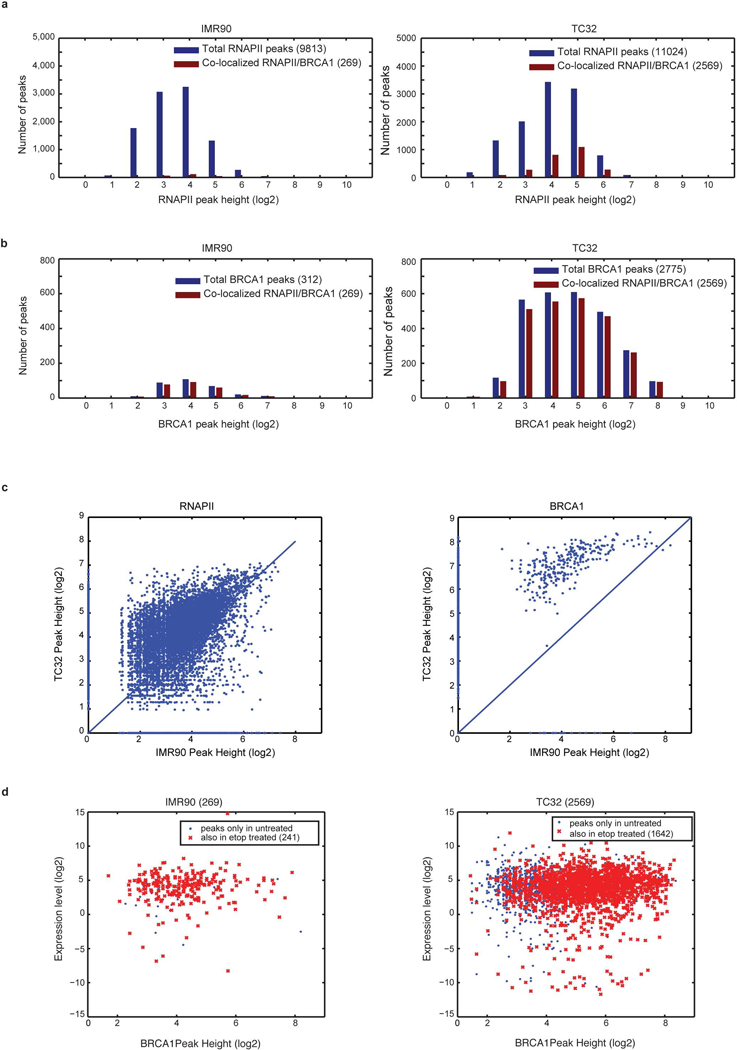
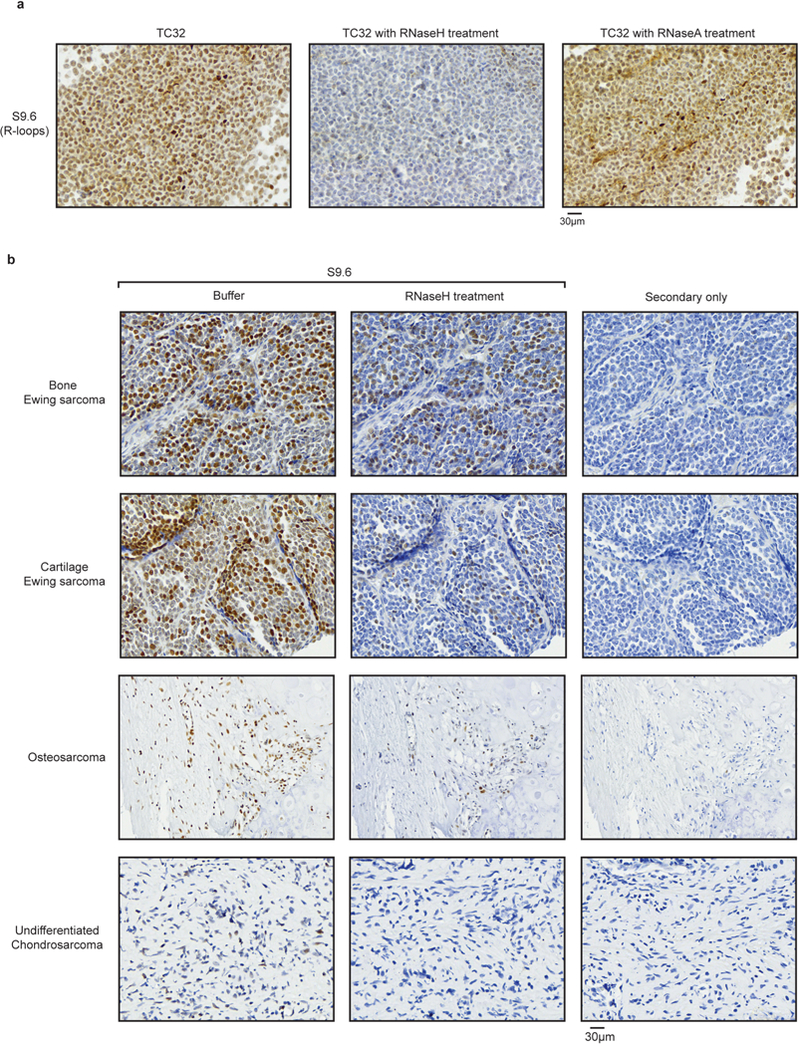
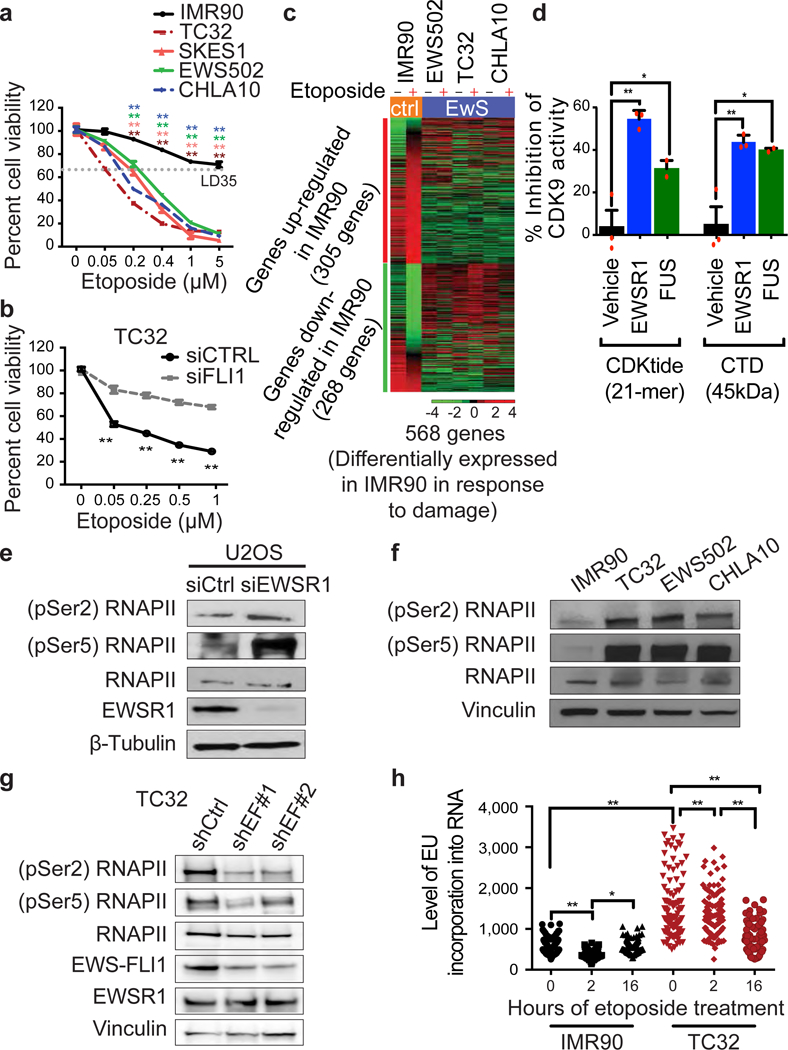
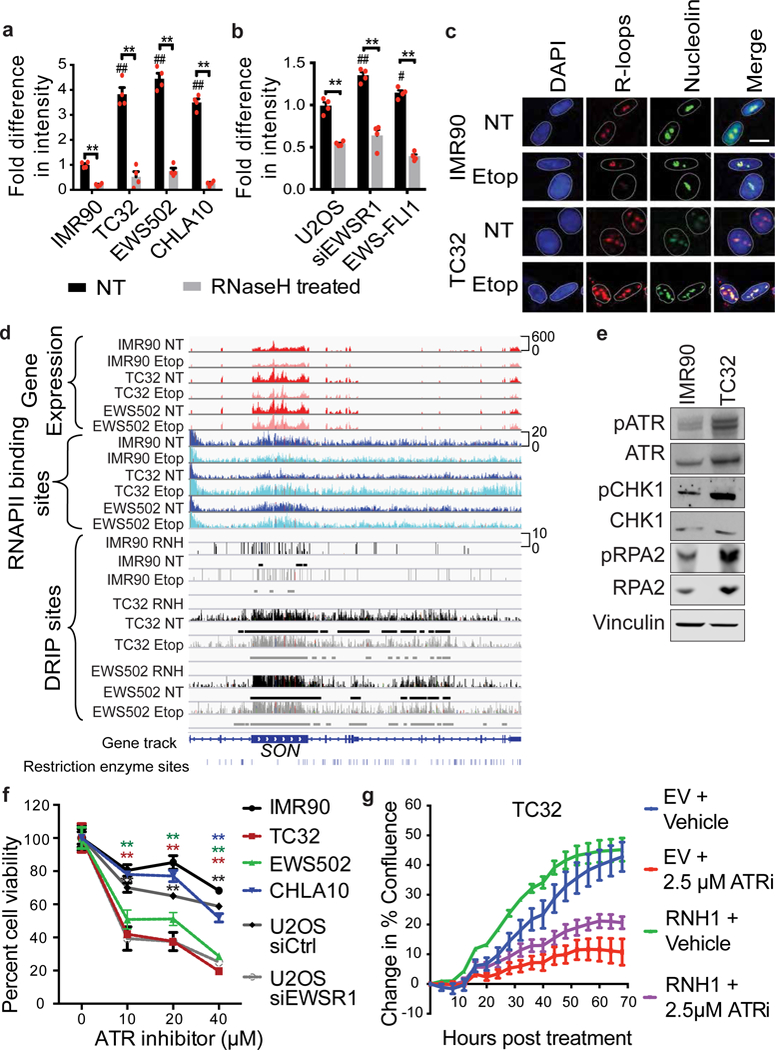
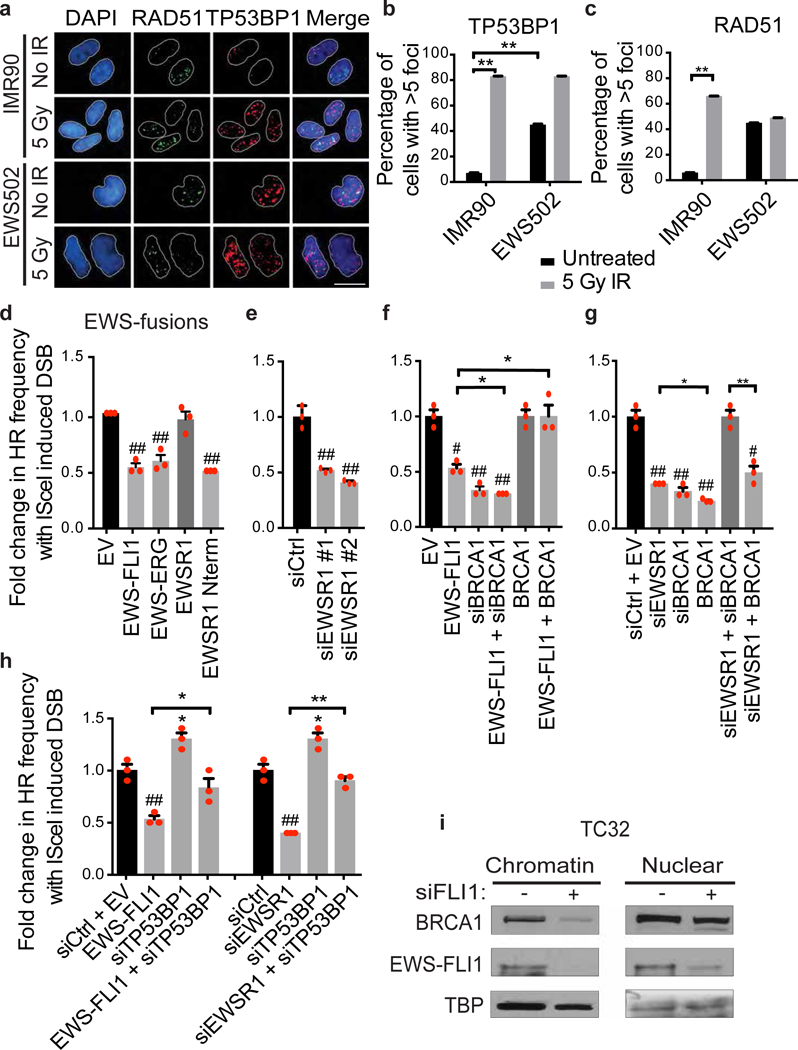
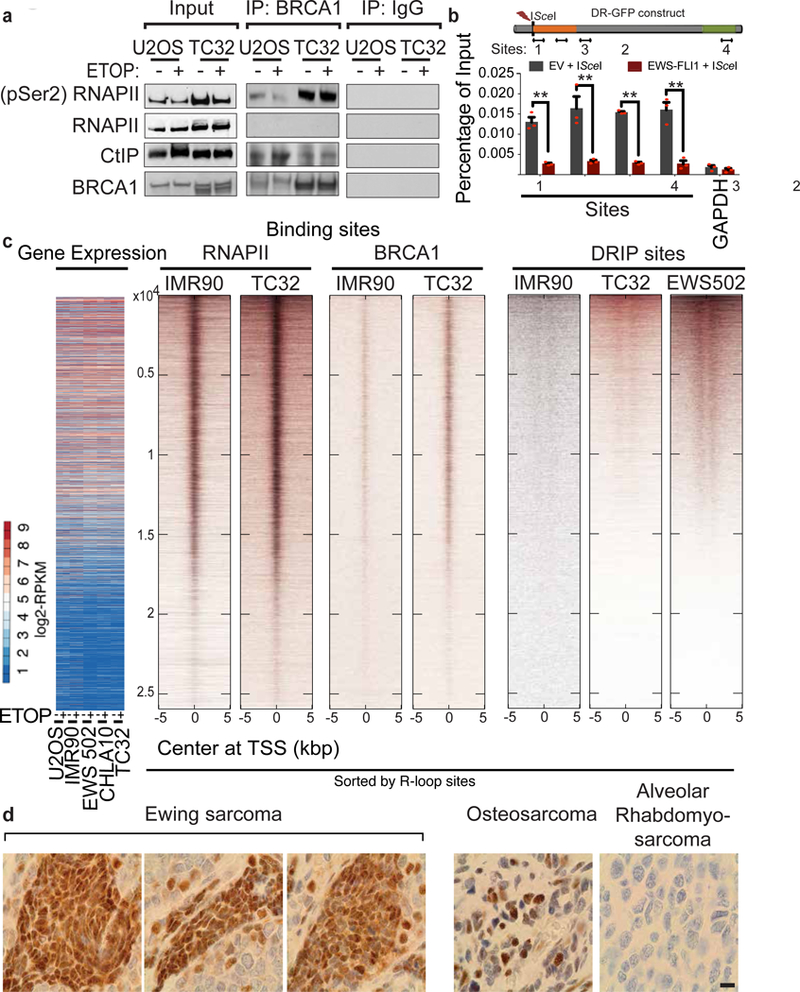
Ewing sarcoma is an aggressive paediatric cancer of the bone and soft tissue. It results from a chromosomal translocation, predominantly t(11;22)(q24:q12), that fuses the N-terminal transactivation domain of the constitutively expressed EWSR1 protein with the C-terminal DNA binding domain of the rarely expressed FLI1 protein. Ewing sarcoma is highly sensitive to genotoxic agents such as etoposide, but the underlying molecular basis of this sensitivity is unclear. Here we show that Ewing sarcoma cells display alterations in regulation of damage-induced transcription, accumulation of R-loops and increased replication stress. In addition, homologous recombination is impaired in Ewing sarcoma owing to an enriched interaction between BRCA1 and the elongating transcription machinery. Finally, we uncover a role for EWSR1 in the transcriptional response to damage, suppressing R-loops and promoting homologous recombination. Our findings improve the current understanding of EWSR1 function, elucidate the mechanistic basis of the sensitivity of Ewing sarcoma to chemotherapy (including PARP1 inhibitors) and highlight a class of BRCA-deficient-like tumours.


Conflict of interest statement

The authors declare no competing financial interests.

Figures

Extended Data Figure 1 |
Extended Data Figure 1 |. Characterizing Ewing sarcoma chemosensitivity.
a, Cell lines used in the study. b, Level of cell death caused by EWS–FLI1 knockdown alone in TC32 cells. Immunoblot shows extent of knockdown; n = 4 transfection replicates. c, Cell viability of U2OS cells transfected either with empty vector (EV) or EWS–FLI1 for 24 h before etoposide exposure for a further 48 h. Immunoblot shows transfection efficiency; n = 3 transfection replicates. d, IC50 levels of etoposide or mitomycin in EWS–FLI1 mutant (n = 16) versus pan-cancer (n = 143) dataset. Brown lines, range of screening concentrations of the drug. Red lines, geometric mean of drug concentration. e, Heatmap of basal gene expression profile in control and Ewing sarcoma cell lines after hierarchical clustering. f, g, Top enriched pathways from gene set enrichment analysis of the differences between Ewing sarcoma and IMR90 cells are listed (f) and relevant signature plots are illustrated (g). We found differential upregulation of replication stress, BRCA1-mutation driven network and altered transcription regulation pathways in Ewing sarcoma. h, Cross-screen pathway comparison of top survival hits from RNAi screens in Drosophila Kc167 cells exposed to MMS, bleomycin or etoposide. Nearly a third of the top 5% hits in each screen were genes involved in transcription and RNA metabolism, highlighting the importance of this pathway in DNA damage survival. Mean ± s.e.m., *P < 0.05, **P < 0.005, two-tailed t-test.
Extended Data Figure 2 |
Extended Data Figure 2 |. Aberrant transcription regulation in Ewing sarcoma.
a, Immunoblot depicting the phosphorylation of RNAPII CTD fragment used as the substrate in Fig. 1d. Recombinant EWSR1 and hypophosphorylated RNAPII are also displayed. b, Level of inhibition of CDK9 activity by buffer (vehicle) or recombinant EWS–FLI1 protein on the two RNAPII CTD substrates. The immunoblot on top is confirmation of kinase activity measured by the assay. c, Cytotoxicity profile in response to camptothecin in control, Ewing sarcoma and EWSR1-depleted cells. n = 4 technical replicates, One-way ANOVA against IMR90 cells. d, IC50 levels of camptothecin in EWS–FLI1 mutant (n = 15) versus pan-cancer (n = 132) dataset. Brown lines, range of screening concentrations of the drug. Red lines, geometric mean of drug concentration. e, Transcription restart assay measured in U2OS cells transfected with either scrambled or EWSR1 siRNA. n = 4 transfection replicates, Two-way ANOVA. Mean ± s.e.m., *P < 0.05, **P < 0.005.
Extended Data Figure 3 |
Extended Data Figure 3 |. R-loops in Ewing sarcoma.
a, Quantification of RNA–DNA hybrids in TC32 cells transfected with either empty vector (EV) or RNaseH1 (RNH1). The immunoblot to the right indicates RNaseH1 transfection efficiency; n = 4 transfection replicates. b, RNA–DNA hybrid levels in TC32 cells with scrambled (siCtrl) or EWS–FLI1 (siFLI1) knockdown; n = 3 transfection replicates. c, Schematic of the EWS–FLI1 R2L2 construct. Arginine residues 383 and 386 (black bars) in EWS–FLI1 are converted to leucine to render the fusion oncogene deficient in DNA binding. Below is a quantification of RNA–DNA hybrids in U2OS cells expressing empty vector, EWS–FLI1 or EWS–FLI1 R2L2; n = 4 transfection replicates. d, e, Fold change in RNA–DNA hybrids after damage (etoposide, 6 h) in IMR90 versus Ewing sarcoma cells (d) or U2OS cells with either EWSR1 depletion or EWS–FLI1 expression (e). NT, no treatment; n = 4 technical or transfection replicates. f, Quantification of nucleoplasmic RNA–DNA hybrids in the immunofluorescence images (n = 80 nuclei) demonstrated a clear increase in overall R-loop intensity in Ewing sarcoma cells. Nucleolin signal was used to subtract nucleolar R-loops. One-way ANOVA. Mean ± s.e.m., #,*P < 0.05, ##,**P < 0.005. # indicates significance of Ewing sarcoma relative to untreated IMR90 cells or transfections relative to U2OS cells.
Extended Data Figure 4 |
Extended Data Figure 4 |. DRIP–seq data validation.
a, Quantification of DRIP (coverage of DRIP region multiplied by reads in that region) across all samples. y-axis is graphed in logarithmic scale. b, Representative whole-genome heatmaps centred around TSS ordered by average expression of Ewing sarcoma cells. c, Probability density graph plotted with a Gaussian smoothing kernel of the distribution of DRIP peaks and EWS–FLI1 ChIP peaks at EWS–FLI1 bound genes relative to uniform distribution. n = 281 genes (top 16%). Inset, P values depicting significance of enrichment for each sample. d, Fold enrichment of qPCR product from ChIP experiments done with RNAPII antibody in control and Ewing sarcoma cell lines. The primers target well-known R-loop regions within APOE and EGR1 genes. Mean ± s.e.m., n = 3 technical replicates, ***P < 0.0005, ****P < 0.00005. One-way ANOVA across cell lines compared to IMR90 cells and two-tailed t-test within cell lines.
Extended Data Figure 5 |
Extended Data Figure 5 |. R-loop-dependent replication stress and recombination defect in Ewing sarcoma.
a, Representative immunoblots evaluating decrease in ATR kinase pathway activation upon overexpression of RNaseH1 in TC32 cells. b, Schematic of the DR-GFP construct integrated into U2OS cells. Below are representative scatter plots of the gating scheme used to determine percentage of GFP-positive cells after inducing a DSB via ISceI vector compared to empty vector. c, RNA-seq data of BRCA1 transcript levels in Ewing sarcoma cell lines compared to IMR90 cells. d, Immunoblots demonstrating transfection efficiency of indicated siRNA and expression constructs used in Fig. 3f, g.
Extended Data Figure 6 |
Extended Data Figure 6 |. Similarity of Ewing sarcoma to BRCA-deficient tumours.
a, IC50 levels of olaparib in EWS–FLI1 mutant cells (n = 17) versus breast cancers (n = 13) or pan-cancer (n = 147) dataset. b, Cell viability of IMR90 and Ewing sarcoma cells with increasing doses of olaparib. Mean ± s.d., n = 3 technical replicates, one-way ANOVA compared to IMR90 cells. c, Cell viability plot demonstrating the role of EWS–FLI1 in mediating exquisite sensitivity to olaparib in U2OS cells transfected with either the oncogene or empty vector; n = 3 transfection replicates. d, Immunoblots depicting transfection efficiency of indicated siRNA and expression constructs used in Fig. 3h. e, TP53BP1 knockdown improved Ewing sarcoma (TC32 cell) survival in response to damage. Immunoblots depict level of TP53BP1 knockdown. n = 4 transfection replicates. f, Representative immunoblots showing equivalent levels of BRCA1 in whole cell lysates (upper panel) from control and Ewing sarcoma cells with and without etoposide treatment (2 h). The lower panel shows BRCA1 redistribution in subcellular fractions of U2OS or TC32 cells. GAPDH and lamin B1 were used as loading controls for the cytoplasmic and nuclear fractions, respectively. g, Immunoblots of whole cell lysates and subcellular fractions from U2OS cells with and without EWSR1 depletion. Data indicated no change in BRCA1 levels with EWSR1 knockdown. Loading controls include: GAPDH for cytoplasm, Sp1 for nuclei and histone H3 for chromatin. Mean ± s.e.m., **P < 0.005, two-tailed t-test at each dose.
Extended Data Figure 7 |
Extended Data Figure 7 |. Association of BRCA1 with the transcription complex in Ewing sarcoma.
a, Co-immunoprecipitation: immunoblots of IMR90 and EWS502 nuclear lysates with and without exposure to etoposide (2 h). The left panel indicates 10% of the input used for immunoprecipitation. BRCA1 antibody was used for immunoprecipitation in the middle panel and the rightmost panel indicates specificity of interaction against IgG pulldown. b, Real-time qPCR analysis of BRCA ChIP samples from control and Ewing sarcoma cell lines with and without etoposide treatment, using primers within the FEN1 and PARP8 genes. c, Representative sequencing track image of gene expression (red tracks), R-loop sites (black and grey tracks) and BRCA1 binding sites (blue tracks) across the FEN1 gene demonstrating the enrichment of R-loops and BRCA1 in the region amplified by the primers in b. d, qPCR analysis as in b with primers targeting a well-known R-loop region within the APOE gene. e, Representative sequencing track image as in c across the APOE gene. f, Agarose gel blots evaluating amplicons generated using EWS502 DRIPs with primers against FEN1 and PARP8. NT, no treatment; Etop, etoposide-treated (6 h); RNH, RNaseH-treated samples. Mean ± s.e.m., n = 3 technical replicates, **P < 0.005, two-tailed t-test.
Extended Data Figure 8 |
Extended Data Figure 8 |. Genome-wide heatmaps.
a, Heatmaps representing genome-wide localization of RNAPII, BRCA1 and R-loop sites centred on the TSS. The data were sorted by DRIP sites. The upper panel represents untreated (NT) samples and the lower panel represents etoposide (Etop, 6 h) treated samples. There was a clear decrease in BRCA1 and R-loop signal upon damage in the control cell lines, unlike in Ewing sarcoma. b, KS plots to demonstrate empirical distribution of the top 13.8% of DRIP and ChIP peaks and higher expression relative to uniform distribution. Data are sorted by BRCA1 ChIP, n = 3,066 genes. c, P values of statistical comparisons between RNAPII ChIP and R-loop probability distributions for all cell lines against IMR90 DRIP data centred on the TSS. The top 27% of DRIP–seq peaks corresponding to 6,127 genes were used for the analysis and data were sorted by BRCA1 binding sites.
Extended Data Figure 9 |
Extended Data Figure 9 |. Correlation between BRCA1 and RNAPII binding.
a, Distribution of RNAPII abundance across the genome for IMR90 and TC32 cells. The bars depict the number of RNAPII bound sites as a function of the number of peaks (y-axis) and relative abundance (peak height, log-transformed) within these peaks (x-axis). The blue bars indicate the total number of peaks determined from RNAPII ChIP–seq and the red bars represent the peaks that co-localize with BRCA1 peaks obtained from BRCA1 ChIP–seq. The data indicated a similar number of RNAPII peaks for TC32 (11,024) compared to IMR90 (9,813), but a greater amount of DNA bound at these peaks, implying increased RNAPII binding. Furthermore, a higher proportion of RNAPII-bound loci also co-localized to BRCA1 binding sites (red bars) in TC32 than in IMR90 cells (23% compared to 2.7%) and there was a clear increase in RNAPII abundance at these sites. b, Distribution of BRCA1 abundance across the genome for IMR90 and TC32, similar to a. The data indicate a significantly higher number of total BRCA1 peaks in TC32 cells as well as a significantly higher enrichment of BRCA1 within these peaks in TC32 cells compared to IMR90 cells. The data also suggest that the majority of the BRCA1 peaks were co-localized with RNAPII. c, Scatter plots represent the correlation of RNAPII (left) and BRCA1 (right) peak heights between TC32 and IMR90 cells. Data were plotted after being normalized to read count and log-transformed to make comparisons. Loci that are unique to each cell line map to the axes whereas common loci are scattered around the diagonal. The data clearly suggest an increase in enrichment of both RNAPII and BRCA1 in TC32 cells compared to IMR90 cells. d, Scatter plots represent the relationship between co-localized BRCA1 and RNAPII peaks as a function of BRCA1 peak height (x-axis) and level of expression of the gene associated with these binding sites (y-axis). TC32 cells showed a greater than fivefold increase in the number of BRCA1 peaks that were associated with RNAPII at highly expressed genes. Further, as in b, there was a greater abundance of BRCA1 (peak height) at these highly expressed genes in TC32 cells than in IMR90 cells.
Extended Data Figure 10 |
Extended Data Figure 10 |. Immunohistochemical analysis of tissue sections.
a, Representative images depicting R-loop staining by S9.6 antibody on sections derived from fixed TC32 cell pellets. Sections were treated with buffer (left), RNaseH (middle) or RNaseA (right) after antigen retrieval. The slides demonstrate loss of R-loop signal after treatment with RNaseH, as expected. RNaseA treatment, which at higher salt concentrations specifically cleaves single-stranded RNA, did not result in a significant loss of R-loop signal confirming the specificity of S9.6 antibody in detecting RNA–DNA hybrids. b, Representative images from a pan-sarcoma tissue microarray. The left and centre panels were probed with S9.6 antibody with or without RNaseH treatment. The right panel was stained with secondary antibody alone and serves as a non-specific control. Each row represents images from one tumour indicated on the left. Images were scanned at 40× (bar at the bottom right denotes resolution).
Figure 1 |
Figure 1 |. Ewing sarcoma dysregulates transcription in response to damage.
a, Cell viability following etoposide treatment. Etoposide dose causing 35% lethality (LD35, dotted grey line) was used for further experiments. Mean ± s.d., n = 4 technical replicates, one-way ANOVA. b, Etoposide-induced TC32 cytotoxicity after EWS–FLI1 knockdown (siFLI1). n = 4 transfection replicates, two-tailed t-tests. c, Heatmap of damage-induced differential gene expression. d, CDK9 kinase activity inhibition by recombinant EWSR1 and FUS proteins on CDKtide or CTD substrates. n = 3 technical replicates, one-way ANOVA. eg, Levels of phosphorylated Ser2/Ser5 RNAPII in U2OS cells with EWSR1 knockdown (e), IMR90 cells versus TC32 cells (f), and TC32 cells with EWS–FLI1 knockdown (g). h, Transcriptional activity after etoposide treatment. Centre at median, n = 100 cells, two-way ANOVA. Mean ± s.e.m., *P < 0.05, **P < 0.005.
Figure 2 |
Figure 2 |. R-loop accumulation in Ewing sarcoma.
a, b, Fold-difference in genomic R-loops in IMR90 versus Ewing sarcoma cells (a) and U2OS cells with indicated transfections (b); n = 4 technical replicates. c, Representative immunofluorescence images of nuclei (DAPI), R-loops (S9.6) and nucleoli (nucleolin). Scale bar, 25 μm. d, Thirty-five-kilobase region surrounding the SON gene containing RNA-seq (red), RNAPII ChIP–seq (blue), DRIP–seq (black) and RNaseH-treated (RNH) tracks. Etop, etoposide-treated. Track height represents read counts. e, Immunoblots of indicated replication stress proteins. f, Cell viability response to ATR inhibitor; n = 4 technical replicates. g, Proliferation rate of TC32 cells overexpressing RNaseH1 (RNH1) after ATR inhibition (ATRi). EV, empty vector; n = 3 transfection replicates. Mean ± s.e.m., one-way ANOVA compared to IMR90 control, two-tailed t-test within each cell line. #,*P < 0.05; ##,**P < 0.005, # shows significance compared to control (NT).
Figure 3 |
Figure 3 |. Functional loss of EWSR1 impairs homologous recombination.
a, Representative immunofluorescence images of TP53BP1 and RAD51 foci. Scale bar, 25 μm. b, c, Number of cells with more than five TP53BP1 (b) or RAD51 (c) foci. n = 85 cells, two-tailed t-test. dh, Homologous recombination (HR) frequency with indicated transfections (efficiency demonstrated in Extended Data Figs 5d, 6d). n = 3 transfection replicates, one-way ANOVA. i, Immunoblots for BRCA1 and EWS–FLI1 in subcellular fractions of TC32 cells with EWS–FLI1 knockdown. Mean ± s.e.m.; #,*P < 0.05; ##,**P < 0.005, # shows significance relative to control (black bar).
Figure 4 |
Figure 4 |. BRCA1 is retained at transcriptional complexes in Ewing sarcoma.
a, Immunoblots of indicated proteins after BRCA1 immunoprecipitation. b, Schematic of qPCR sites within DR-GFP locus relative to break site used to measure BRCA1 occupancy after EWS–FLI1 overexpression (graph below); GAPDH serves as negative control. Mean ± s.e.m., n = 3 technical replicates; **P < 0.005, two-tailed t-test. c, Whole-genome heatmaps representing correlation between gene expression, RNAPII, BRCA1 binding sites, and DRIP loci ordered by DRIPs, centred on transcription start site (TSS). d, Representative immunohistochemistry images showing R-loop staining across a sarcoma tissue microarray. Scale bar, 10 μm.

References

    1. Turc-Carel C, Philip I, Berger MP, Philip T & Lenoir GM Chromosome study of Ewing’s sarcoma (ES) cell lines. Consistency of a reciprocal translocation t(11;22)(q24;q12). Cancer Genet. Cytogenet. 12, 1–19 (1984). - PubMed
    1. Paronetto MP Ewing sarcoma protein: a key player in human cancer. Int. J. Cell Biol. 2013, 642853 (2013). - PMC - PubMed
    1. Li H et al. Ewing sarcoma gene EWS is essential for meiosis and B lymphocyte development. J. Clin. Invest. 117, 1314–1323 (2007). - PMC - PubMed
    1. Yang W et al. Genomics of Drug Sensitivity in Cancer (GDSC): a resource for therapeutic biomarker discovery in cancer cells. Nucleic Acids Res. 41, D955–D961 (2013). - PMC - PubMed
    1. Kim N & Jinks-Robertson S Transcription as a source of genome instability. Nat. Rev. Genet. 13, 204–214 (2012). - PMC - PubMed

Publication types

MeSH terms