. 2018 Mar 22;555(7697):457-462.
doi: 10.1038/nature25999. Epub 2018 Mar 5.

Developmental diversification of cortical inhibitory interneurons

Affiliations

Developmental diversification of cortical inhibitory interneurons

Christian Mayer et al. Nature. .

Abstract

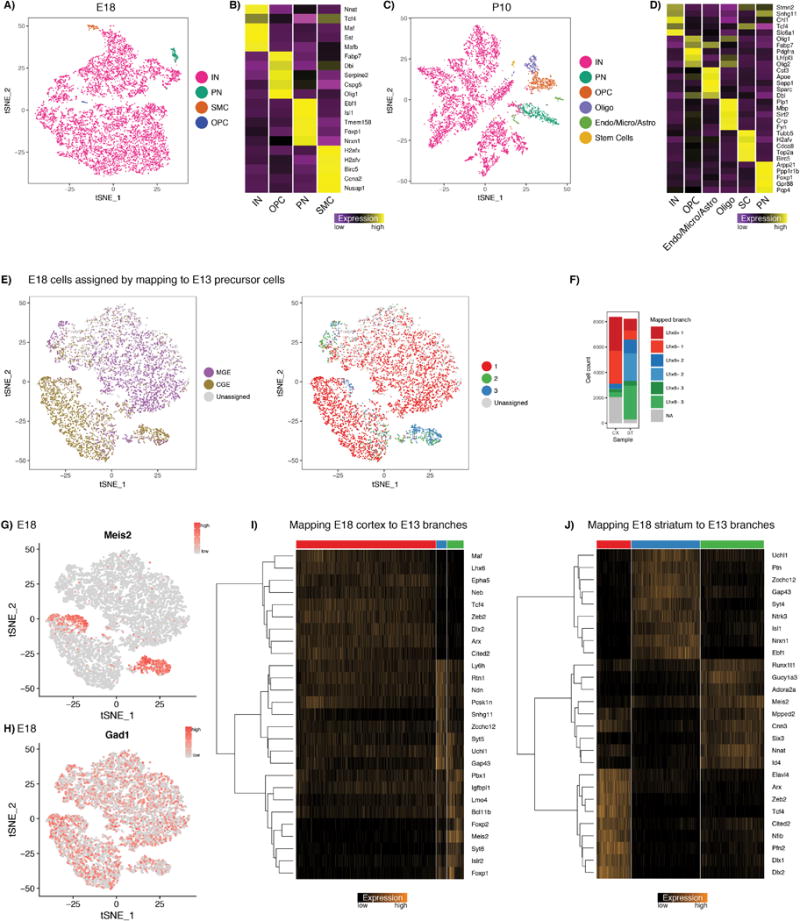
Diverse subsets of cortical interneurons have vital roles in higher-order brain functions. To investigate how this diversity is generated, here we used single-cell RNA sequencing to profile the transcriptomes of mouse cells collected along a developmental time course. Heterogeneity within mitotic progenitors in the ganglionic eminences is driven by a highly conserved maturation trajectory, alongside eminence-specific transcription factor expression that seeds the emergence of later diversity. Upon becoming postmitotic, progenitors diverge and differentiate into transcriptionally distinct states, including an interneuron precursor state. By integrating datasets across developmental time points, we identified shared sources of transcriptomic heterogeneity between adult interneurons and their precursors, and uncovered the embryonic emergence of cardinal interneuron subtypes. Our analysis revealed that the transcription factor Mef2c, which is linked to various neuropsychiatric and neurodevelopmental disorders, delineates early precursors of parvalbumin-expressing neurons, and is essential for their development. These findings shed new light on the molecular diversification of early inhibitory precursors, and identify gene modules that may influence the specification of human interneuron subtypes.


Figures

Extended Data Figure 1
Extended Data Figure 1. Ordering cells along a maturation trajectory
A) Diffusion map analysis of eminence datasets suggests a pan-eminence developmental continuum. Each eminence was analyzed independently, revealing nearly identical patterns. Cells are colored according to the expression of canonical regulators. B) Using PCA to reconstruct developmental maturation returns nearly identical results to the diffusion map analysis in Fig. 1. PCA was calculated for all eminences independently, and cells are colored by their expression of canonical markers. C) Eigenvalues for the two dimensionality reduction methods. We observe a significant eigenvalue drop-off after the initial components, demonstrating that the majority of the variance is captured in the first few dimensions. D) Single-cell heat-map showing scaled expression levels of top genes that were correlated with ‘cell cycle’ score. Cells on the x-axis are sorted by cell cycle score. Negative scores correspond to cells in S-phase, positive scores correspond to cells in G2/M-phase. E) Scatter plot illustrating the relationship between MS and cell cycle score for all cells in the dataset. Each dot corresponds to a single cell. Early progenitors span a wide range of cell cycle states, while late cells do not express G2/M or S-phase specific genes and express postmitotic genes. F) Expression of canonical marker genes as a function of ‘pseudotime’, as calculated with Monocle2. Monocle2 pseudotime was strongly correlated with our maturation trajectory (both pearson and spearman R=0.94). Diffusion map (G) and maturation trajectory (H) analysis of 1,099 single cells obtained from FlashTag animals, and sequenced using a custom version of the Smart-seq2 protocol (Supplementary Methods). Cells are colored by their expression of canonical markers, which exhibit dynamics that are concurrent with the maturation trajectory learned from the Drop-seq data. (I-J) Relationship between the maturation trajectory and cell cycle scores derived from the FlashTag datasets replicates our observations from Drop-seq. Therefore, our FlashTag maturation trajectory serves as complementary validation of our Drop-seq maturation trajectory, and exhibits strong association with biological time.
Extended Data Figure 2
Extended Data Figure 2. Enrichment of differentially expressed genes in the MGE, CGE and LGE
A) Schematic of embryonic brain sections at E13.5/E14.5. One sagittal section shows the MGE and LGE next to one another, while the other shows the CGE. B) In Situ Hybridization (ISH) images from the Allen Brain Institute Developing Mouse Brain Atlas at E13.5 for genes that our analysis identified as being differentially expressed between the eminences. For each gene, ISH images are shown for the MGE, CGE, and LGE. C) Temporal dynamics for DE genes in early mitotic cells. Curves represent local averaging of single cell expression, as a function of progression along the maturation trajectory, for each eminence independently. Grey area indicates 95% confidence interval. Genes are selected from the differentially expressed genes in early mitotic cells (Figure 2A). D) Gene expression dynamics in mitotic cells, based on local averaging of single cell data, plotted along MS for select developmentally regulated genes.
Extended Data Figure 3
Extended Data Figure 3. Enrichment of dynamically expressed genes in the VZ, SVZ and MZ
A) Schematic of an embryonic brain section at E13.5/E14.5. The location of the ventricular zone (VZ) and mantle zone (MZ) is indicated. B) Sagittal ISH images from the Allen Brain Institute Developing Mouse Brain Atlas at E13.5. Genes are ordered from lowest to highest maturation score (MS) rank. The trend overall shows that genes with peak expression at low MS tend to have higher expression in the VZ, and as MS rank increases the expression pattern shifts to the subventricular zone (SVZ) and then to the MZ; Image credit: Allen Institute.
Extended Data Figure 4
Extended Data Figure 4. Fate divergence occurs as cells become postmitotic
A) Supervised analysis: PCA of full dataset, run using only branch-dependent genes. Cells are grouped based on the MT bin: the first 5 bins represent mitotic progenitors, the last four bins represent postmitotic cells which are colored by branch ID. Mitotic cells fall within a homogeneous point cloud, with low variance on PC1 and PC2, showing no evidence of fate bifurcation. B) To test if our inability to detect fate bifurcations earlier in development was due to the lower sequencing depth of Drop-seq, we sequenced 400 Dlx6a-Cre;RCEloxP negative GE cells (thereby enriching for mitotic progenitors), using a modified Smart-seq2 protocol. Diffusion map analysis of these cells returned only two significant principal components, with no evidence of further structure. These components reflect our previously defined maturation trajectory, with DMC1 separating mitotic cells (left). C) Rare mitotic cells expressing canonical branch markers do not segregate on the diffusion plot. D-F) Branching analysis on mitotic progenitors. We repeated the branch analysis, previously computed on postmitotic cells (Figure 3A), on mitotic progenitors from all three ganglionic eminences. While we did observe computational evidence of branching, this does not represent fate bifurcations as we observed in postmitotic cells. Instead, cells from different branches could largely be separated into ‘early’, ‘intermediate’, and ‘late’ regions of mitotic pseudotime, with one branch being largely defined by the expression of pro-neural cell cycle regulators (e.g. Ascl1). As these genes peak at intermediate stages, our branching patterns could reflect either the aberrant assignment of intermediate cells to a new branch, or reflect the potential of multiple modes of cell division (namely, direct vs. indirect neurogenesis) occurring in the VZ and SVZ. G) Genetic fate mapping using Lhx8-Cre/cerulean demonstrates that MGE branch three precursors give rise to the entire breadth of cholinergic projection (Globus Pallidus and Nucleus Basalis) and interneuron (striatum) populations. The cumulative longitudinal use of a constitutive Cre driver also results in extensive labeling of cortical interneurons due to transient expression within this population. Scale = 500 μm; Ctx, Cortex; Str, Striatum; LS, Lateral Septum; MS, Medial Septum; NP, Nucleus Basalis; GP, Globus Pallidus. H) Our Lhx6-GFP-negative dataset contains both mitotic and postmitotic cells from the CGE and diffusion map analysis shows our previously defined maturation trajectory. I-J) To isolate postmitotic cells, we calculated a maturation trajectory, and used the cell cycle scores to identify the transition point between mitotic/postmitotic cells as with the eminence datasets in Figure 1. K) To avoid the possibility of FACS false negative MGE cells contaminating our Lhx6-GFP-negative dataset, we clustered the postmitotic cells from this dataset, and filtered out three rare clusters where Lhx6 mRNA expression was detected in more than 20% of cells (Supplementary Methods). L-M) We mapped postmitotic cells from the Lhx6-GFP-positive and Lhx6-GFP-negative datasets to the branches determined from the Drop-seq dataset (Supplementary Methods). Heatmaps show scaled single cell expression markers associated with each branch. N) Analogous to Figure 3E, but also including the Lhx6-GFP-positive and Lhx6-GFP-negative datasets generated using 10X Genomics, as a validation of the original Drop-seq datasets that were performed on WT mice.
Extended Data Figure 5
Extended Data Figure 5. Filtering of E18 and P10 10x datasets and mapping of E18.5 cortex and subcortex neurons to E13.5/E14.5 branches
A,C) tSNE visualization of Dlx6a-Cre;RCEloxP positive E18.5 cortical cells, and Dlx6a-Cre;RCEloxP positive P10 cortical cells. Though the Dlx6a-Cre should mark only GABAergic eminence-derived cells, we identified rare populations that did not express canonical interneuron (IN) markers, likely representing false positives from FACS. B, D) Gene expression in these populations (heatmap shows average expression in group), identifies rare contaminating populations of microglia (micro), astrocytes (Astro), oligodendrocyte precursor cells (OPCs) and oligodendrocytes (Oligo); smooth muscle cells (SMC), stem cells (SC). For all downstream analyses, we considered only cells in the IN cluster. E) tSNE visualization of 8,382 Dlx6a-Cre; RCEloxP positive E18.5 cortical cells (same dataset as in Supplementary Figure 5A, but after removing contaminating populations). Each E18.5 cell was mapped to one of six precursor states (branch 1, 2, and 3 for Lhx6-GFP-positive and Lhx6-GFP-negative datasets), using a correlation-based distance metric (Supplementary Methods). This enabled us to assign a putative eminence and branch of origin for each of the E18.5 cortical cells. F) As expected, the vast majority of Dlx6a-Cre;RCEloxP positive E18.5 cortical cells map to the interneuron precursor state, and are split between MGE and CGE-derived precursors. By contrast, Dlx6a-Cre;RCEloxP positive E18.5 cells from the subcortex primarily map to branch 2 and 3, consistent with our interpretation of these branches as precursor states for projection neurons; CX, Cortex; ST, Subcortex. G, H) The minority of Dlx6a-positive cortical cells mapping to precursor states 2 and 3 primarily co-express Gad1 and Meis2, likely representing a CGE-derived GABAergic population. These cells have been recently described as being present in the cortical white matter and likely represent projection neuron precursors. I) Heatmap showing single-cell expression markers for the three different mapped branches of Dlx6a-Cre;RCEloxP positive E18.5 cortical cells. J) Heatmap showing single-cell expression markers for the three different mapped branches of Dlx6a-Cre;RCEloxP positive E18.5 cells from the subcortex.
Extended Data Figure 6
Extended Data Figure 6. Clustering of adult visual cortical neurons into 14 major non-overlapping inhibitory interneuron subtypes
A) Initial tSNE visualization and graph-based clustering of 8,329 single cells individually isolated from P56 mouse visual cortex and sequenced with the Smart-Seq2 protocol. Data was downloaded from the publicly available resource hosted by the Allen Brain Atlas, . B) Of all cells, 3,432 GABAergic interneurons were easily identified by the expression of Gad1 and depletion of Slc17a7, and were selected for downstream analysis. C) tSNE visualization and graph-based clustering of the 3,432 GABAergic cells reveals 14 clusters, which could be broadly grouped into cardinal types based on the expression of canonical markers (D, E). F) Single cell heatmap showing scaled expression values for the best transcriptomic markers in each cluster.
Extended Data Figure 7
Extended Data Figure 7. Emergence of transcriptomically defined subtypes across development
(Left) Differentially expressed (DE) genes between MGE and CGE derived subsets, that are conserved in both developmental and P56 cells. Each conserved gene is placed on the heatmap when it is first observed to be DE during development, and the number of conserved DE genes grow over time. Same analysis for Pvalb vs. Sst subsets (Middle), and Vip vs. Id2 subsets (Right). This Figure is identical to Figure 4E, but with all gene names displayed.
Extended Data Figure 8
Extended Data Figure 8. The integrated analysis agrees with an independent tSNE analysis of each timepoint
A) tSNE visualizations of interneuron precursors from E13.5, E18.5, and P10, calculated independently for each timepoint. Cells are colored as in Figure 4B-D, based on their mapping to P56 datasets in integrated analysis. However, since the tSNE was performed separately for each timepoint, we can assess how the integrated analysis agrees with an independent analysis of each timepoint. In each case, we can see that the ‘cardinal type’ separation we observe via integrated analysis (Figure 4B-D) is consistent with an independent analysis of each dataset. Integrated analysis with the P56 dataset results in clearer separation, and enables us to map developmental precursors to adult subtypes. B) Expression of Gad1 and Meis2 in single cell datasets. Cells expressing both genes are likely projection neuron precursors that have recently been described in the CGE, but whose progeny is not captured in the mouse visual cortex dataset. Therefore, these cells are correctly mapped as ‘unassigned’.
Extended Data Figure 9
Extended Data Figure 9. Transcriptional segregation into cortical interneuron subtypes at different developmental stages
A) tSNE visualization of all P10 cells mapping to a P56 subtype (as in right column of Figure 4B, but cells are colored by subtype instead of cardinal type). B) tSNE visualization as in (A), but zoomed in on each cardinal type independently. C) Single cell heatmaps showing the best transcriptomic markers marking each subtype, for the Sst, Vip, and Id2 cardinal types, within P10 cells. We did not observe any statistically significant markers subdividing Pvalb subtypes. D) tSNE visualization of all E18.5 cells mapping to a P56 subtype (as in right column of Figure 4C, but cells are colored by subtype instead of cardinal type). E) tSNE visualization as in (D), but zoomed in on each cardinal type independently. F) Single cell heatmaps showing the best transcriptomic markers marking each subtype, for the Sst, Vip, and Id2 cardinal types, within E18.5 cells. We did not observe any statistically significant markers subdividing Pvalb subtypes.
Extended Data Figure 10
Extended Data Figure 10. A subset of embryonic markers of cardinal type specification in mouse are conserved in adult human neurons
A) Quantification of Pvalb-positive cIN across the different cortical layers of the control and Mef2c cKO (Dlx6a-Cre;Mef2cloxp/loxpRCE) animals. Mef2c cKO results in a reduction in Pvalb density in all cortical layers except for layer 1; Error bars reflect s.e of the mean; Unpaired t-test; P < 0.05 *, P < 0.01**, P < 0.001 *** n= 4 brains each for cKO and control, 3-4 sections per brain. (B-D) Scatter plot comparing average expression of 3,035 GABAergic single nuclei from post-mortem human neurons, after segregation into Pvalb and Sst (B), Vip, and Id2 types (C) and MGE vs. CGE inferred origins (D). Each dot represents the expression of a gene in human cells. Markers of transcriptomic cardinal types from our E13.5 and E18.5 datasets (from Figure 4E) are shown in red or blue dots. Mouse embryonic markers that also differ by 1.5-fold in human have gene names annotated on the plot.
Figure 1
Figure 1. Transcriptional landscape of single cells in the ganglionic eminences
A) Schematic of experimental workflow. Axes: Dorsal (D), Ventral (V), Posterior (P), Anterior (A), Lateral (L), Medial (M). B) Visualization of Drop-seq of GE precursor data using t-SNE. C) Canonical marker expression in GE precursors, excitatory neurons, and vascular endothelial cells; Colors as in (B). D) A principal curve was fitted to the dominant diffusion map coordinates to order cells along a maturation trajectory (MT). E) Expression (molecules/cell) of canonical regulators, as a function of the position along the MT. Curve reflects local averaging of single cell expression. Locally averaged values were multiplied by five for visualization on the same scale as the molecule counts. F) Percentage of cycling cells as a function of the position along the MT; The dotted-blue line marks the inferred mitotic to postmitotic transition. G) Coronal brain sections of the ganglionic eminences, as cells migrate away from the VZ (Ventricular Zone: apical VZ surface top of figures). Images were taken 3, 6, 12 and 24 hours after fluorescent labeling with FlashTag technology. Scale bars = 50 μm. H) Maturation score distributions of FlashTag labeled cells, separated by timepoint.
Figure 2
Figure 2. A common developmental program of gene expression functions in mitotic progenitors of all three GEs
A) Volcano plots depicting differential gene expression across eminences for early mitotic cells (MS < 0.3). Transcription factors are annotated. B) Gene expression dynamics in mitotic cells, based on local averaging of single cell data, plotted along MS for all developmentally regulated genes. C) In-situ hybridization (ISH) patterns of early, intermediate and late MT genes in the GEs that are highly expressed within anatomical boundaries of the Ventricular Zone (VZ), Subventricular Zone (SVZ), and Mantle Zone (MZ), respectively (left); ISH image for Dcx from the Allen Institute. Scale bars = 50 μm (right). D) The variance explained individually by a set of annotated factors, relative to the variance explained by the first principal component. Calculated independently for maturation score (MS), cell cycle score (CCS), eminence of origin (Emin), unique molecular identifiers per cell (UMIs/cell), and reads per cell (reads/cell).
Figure 3
Figure 3. Postmitotic cells from all eminences pass through distinct precursor states
A) Multidimensional scaling (MDS) based on the consensus MST. B) MST traversal assigned cells to the trunk and one of three branches. C) Quantitative contributions of cells per branch plotted for each GE. D) Hierarchical clustering of branch gene expression. Gene expression was averaged for cells from the same GE and branch. E) Heatmap depicting the top transcriptomic markers for each branch. F) Co-localization of Lhx8-Cre;Ai9 with choline acetyltransferase (ChAT) in the striatum, medial septum, and nucleus basalis, and Pvalb in the globus pallidus (left to right). Scale = 300 μm. G) Percentage of total ChAT+ cells labeled with tdTomato in Lhx8-Cre;Ai9 mice. n=15 brain sections (striatum), n= 4 (medial septum), n = 8 (nucleus basalis), 2 mice. Error bars in G and H indicate standard deviation across all quantified sections. H) The percentage of total Pvalb+ cells labeled with tdTomato in Lhx8-Cre;Ai9 mice. n=10 brain sections (striatum), n = 5 (globus pallidus), n = 4 (cortex), 2 mice. I) Mapping of E18.5 cortical (CX) and subcortical (ST) cells to E13.5/E14.5 branches based on marker gene expression correlations. J) Relative variance explained individually by annotated factors for postmitotic cells at E13.5/E14.5 (branch, cell cycle score (CCS), eminence of origin (Emin), unique molecular identifiers (UMIs/cell), and reads (reads/cell)) relative to the variance explained by the first principle component. Residual cell cycle variation is due to our conservative cutoff for the mitotic/postmitotic transition. K) Differential expression analysis between MGE and CGE postmitotic cells in the interneuron precursor state at E13.5/E14.5 (left). These genes tend to remain differentially expressed between MGE and CGE-derived populations at E18.5 (middle), which is not the case in E13.5 mitotic progenitors (right); Differentially expressed genes are depicted in blue.
Figure 4
Figure 4. Integrating developmental scRNA-seq datasets to link embryonic heterogeneity to adult interneuron subtypes
A) Graph-based clustering of interneurons from the adult mouse visual cortex (Data from Allen Cell Types Database (2015),). B-D) Integration of P10 (B), E18.5 (C), E13.5 (D) precursors with P56 cortical interneurons based on shared sources of variation. Upper panel: adult cells colored by subtype and precursors cells in grey. Lower panel: precursor cells colored by adult subtype to which they are assigned. E) Differentially expressed genes between CGE and MGE derived subsets, that are conserved in both developmental and adult cells (left). Each conserved gene is placed on the heatmap when it is first observed to be differentially expressed during development. Same analysis for Pvalb vs. Sst subsets (middle), and Vip vs. Id2 subsets (right). F) Conditional deletion of Mef2c in inhibitory neurons using Dlx6a-Cre;Mef2cloxp/loxpRCE . Immunostaining of P20-P22 somatosensory cortex using anti-GFP (green) and anti-Pvalb (red) (DAPI counterstaining shows cortical layers). Scale = 200 μm. G) Density quantification of cIN subtypes in the P21 somatosensory cortex using antibodies for Pvalb, Sst, Vip, Npy, and calretinin (CR). Error bars reflect s.e of the mean; Two-tailed unpaired t-test, P < 0.01** n= 3 brains each for cKO and control. Error bars reflect s.e of the mean; Two-tailed unpaired t-test, P < 0.01** n= 3 brains each for cKO and control. H) Scatter plot comparing average expression of GABAergic single nuclei from post-mortem human neurons after segregation into Pvalb and Sst types. Each dot represents the expression of a human gene. Markers of embryonic cardinal types are shown in green or blue dots, with a subset of gene names annotated.

Comment in

  • A mixed model of neuronal diversity.
    Telley L, Jabaudon D. Telley L, et al. Nature. 2018 Mar 22;555(7697):452-454. doi: 10.1038/d41586-018-02539-4. Nature. 2018. PMID: 29565398 No abstract available.

References

    1. Kepecs A, Fishell G. Interneuron cell types are fit to function. Nature. 2014;505:318–326. - PMC - PubMed
    1. Flames N, et al. Delineation of multiple subpallial progenitor domains by the combinatorial expression of transcriptional codes. J Neurosci. 2007;27:9682–9695. - PMC - PubMed
    1. Yun K, Garel S, Fischman S, Rubenstein JLR. Patterning of the lateral ganglionic eminence by the Gsh1 and Gsh2 homeobox genes regulates striatal and olfactory bulb histogenesis and the growth of axons through the basal ganglia. J Comp Neurol. 2003;461:151–165. - PubMed
    1. Shimamura K, Hartigan DJ, Martinez S, Puelles L, Rubenstein JL. Longitudinal organization of the anterior neural plate and neural tube. Development. 1995;121:3923–3933. - PubMed
    1. Nóbrega-Pereira S, et al. Origin and molecular specification of globus pallidus neurons. J Neurosci. 2010;30:2824–2834. - PMC - PubMed

Publication types