. 2018 Mar 15;555(7696):392-396.
doi: 10.1038/nature25964. Epub 2018 Mar 7.

Epigenetic reprogramming enables the transition from primordial germ cell to gonocyte

Affiliations

Epigenetic reprogramming enables the transition from primordial germ cell to gonocyte

Peter W S Hill et al. Nature. .

Abstract

Gametes are highly specialized cells that can give rise to the next generation through their ability to generate a totipotent zygote. In mice, germ cells are first specified in the developing embryo around embryonic day (E) 6.25 as primordial germ cells (PGCs). Following subsequent migration into the developing gonad, PGCs undergo a wave of extensive epigenetic reprogramming around E10.5-E11.5, including genome-wide loss of 5-methylcytosine. The underlying molecular mechanisms of this process have remained unclear, leading to our inability to recapitulate this step of germline development in vitro. Here we show, using an integrative approach, that this complex reprogramming process involves coordinated interplay among promoter sequence characteristics, DNA (de)methylation, the polycomb (PRC1) complex and both DNA demethylation-dependent and -independent functions of TET1 to enable the activation of a critical set of germline reprogramming-responsive genes involved in gamete generation and meiosis. Our results also reveal an unexpected role for TET1 in maintaining but not driving DNA demethylation in gonadal PGCs. Collectively, our work uncovers a fundamental biological role for gonadal germline reprogramming and identifies the epigenetic principles of the PGC-to-gonocyte transition that will help to guide attempts to recapitulate complete gametogenesis in vitro.


Conflict of interest statement

Author information

The authors declare no conflict of interest or competing financial interest.

Figures

Extended Data Fig. 1
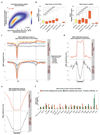
Extended Data Fig. 1. Characterisation of WGBS datasets and validation of AbaSeq method.
a) Distribution of WGBS coverage for each symmetric CpG. For boxplots, the upper and lower hinges correspond to the first and third quartiles, the middle line corresponds to the median, and the maxima and minima respectively correspond to the highest or lowest value within 1.5× the inter-quartile range. b) Overview of AbaSeq method. c-e) Density heatmap showing correlation between 5hmC levels at all 2kB windows (minimum 4 symmetric CpGs) in E14 mESCs as computed by: (c) TAB-Seq (x-axis) and AbaSeq (y-axis); (d) TAB-Seq (x-axis) and hMeDIP (y-axis); or (e) AbaSeq (x-axis) and hMeDIP (y-axis). For (c-e), the Pearson correlation coefficient (ρ) is shown. Specific details regarding sample sizes and how samples were collected are found in Statistics and Reproducibility section.
Extended Data Fig. 2
Extended Data Fig. 2. Further analysis of 5hmC levels in E10.5 PGCs.
a) Density heatmap showing 5hmC levels per 2kB window (with minimum 4 CpGs) for E10.5 PGCs (y-axis) and E14 mESCs (y-axis). Pearson correlation coefficient (ρ) is shown. b) 5hmC levels (AbaSeq) at various regulatory elements in E10.5 PGCs (left) or E14 mESCs. p-values based on ANOVA and Dunnett post hoc test. For boxplots, the upper and lower hinges correspond to the first and third quartiles, the middle line corresponds to the median, and the maxima and minima respectively correspond to the highest or lowest value within 1.5× the inter-quartile range. c) Metagene plot showing 5hmC levels (top panel, AbaSeq) and combined 5mC/5hmC levels (bottom panel, WGBS) in E10.5 PGCs across genes expressed at different levels in E10.5 PGCs. d-e) Metagene plot showing 5hmC levels (top panel, AbaSeq) and combined 5mC/5hmC levels (bottom panel, WGBS) in E10.5 PGCs across either CpG islands (d) or across putative active enhancers (e). f) Bar chart showing 5hmC levels at ICRs in E14 mESCs as determined by TAB-Seq (%; light green) or AbaSeq (read counts; dark green), or in E10.5 PGCs as determined by AbaSeq (read counts; orange). Specific details regarding sample sizes and how samples were collected are found in Statistics and Reproducibility section.
Extended Data Fig. 3
Extended Data Fig. 3. Further analysis of 5mC and 5hmC dynamics in PGCs.
a) Combined 5mC/5hmC (WGBS; left) or 5hmC (AbaSeq; right) levels at various features within the uniquely mapped part of the genome in PGCs between E10.5 and E12.5. The upper and lower hinges correspond to the first and third quartiles, the middle line corresponds to the median, and the maxima and minima respectively correspond to the highest or lowest value within 1.5× the inter-quartile range. b) The combined 5mC/5hmC (WGBS; left) or 5hmC (AbaSeq; right) levels at various consensus repetitive elements in PGCs between E10.5 and E12.5. Asterisks refer to mean values. For specific details regarding sample sizes and how samples were collected, see the Statistics and Reproducibility section.
Extended Data Fig. 4
Extended Data Fig. 4. 5hmC is targeted to newly hypo-methylated regions following DNA demethylation in mouse gonadal PGCs (see also Extended Data Fig. 5).
a) Density heatmap showing Pearson correlation (ρ) between 5hmC levels for E10.5 biological replicates (left), for E10.5 and E11.5 PGCs (middle), and for E10.5 and E12.5 PGCs (right). b) Mean Z-scores depicting 5hmC (orange, AbaSeq) and combined 5mC/5hmC (grey, WGBS) levels for each stage normalised to the average level of either 5hmC (orange, AbaSeq) or combined 5mC/5hmC (grey, WGBS) across stages. Standard error of the mean is shown by too small to see. c-f) Density heatmap showing the correlation between the total (c,d; y-axis: AbaSeq read counts) or relative (e,f; y-axis: ratio of (AbaSeq read counts)/(%; WGBS)) 5hmC levels in E10.5 (c,e) or E11.5 (d,f) PGCs and the change in combined 5mC/5hmC levels in PGCs between these two stages (x-axis: %; WGBS) for all 2kB windows with a minimum 20% combined 5mC/5hmC in E10.5 PGCs. g) Density heatmap showing the correlation between the relative 5hmC levels in E11.5 PGCs (y-axis: ratio of (AbaSeq read counts)/(%; WGBS)) and the combined 5mC/5hmC level in E11.5 PGCs (x-axis: %; WGBS) for all 2kB windows with a minimum 20% combined 5mC/5hmC in E10.5 PGCs. h) Density plot showing the decrease in combined 5mC/5hmC levels in PGCs between E10.5 and E11.5 for 2kB windows with a minimum 20% total DNA modification in E10.5 PGCs that are either 1) enriched for total 5hmC levels at either E10.5 or E11.5 (green, upper-tail adj. Poisson p-value < 0.05), or 2) depleted of total 5hmC at both E10.5 and E11.5 (red, lower-tail adj. Poisson p-value < 0.05). i) Combined 5mC/5hmC levels in E10.5 and E11.5 PGCs for 2kB windows with a minimum 20% combined 5mC/5hmC in E10.5 PGCs that are either 1) enriched for total 5hmC levels at either E10.5 or E11.5 (green, upper-tail adj. Poisson p-value < 0.05), or 2) depleted of total 5hmC at both E10.5 and E11.5 (red, lower-tail adj. Poisson p-value < 0.05). For all boxplots, the upper and lower hinges correspond to the first and third quartiles, the middle line corresponds to the median, and the maxima and minima respectively correspond to the highest or lowest value within 1.5× the inter-quartile range. p-values are based on a two-sided Wilcoxon test. Note that for density heatmaps: 1) the Spearman correlation (ρS) is shown; and 2) the red line represents the smoothed mean as determined by a generalized additive model. Specific details regarding sample sizes and how samples were collected are found in Statistics and Reproducibility section.
Extended Data Fig. 5
Extended Data Fig. 5. Suggested models implicating 5mC oxidation in DNA demethylation of gonadal PGCs.
a) A model of oxidation followed by passive dilution predicts a positive correlation between the extent to which the combined 5mC/5hmC levels decrease between two stages (i.e. %; WGBS) and the total level of 5hmC at both the stage immediately preceding and following this decrease. b) A model implicating 5mC oxidation in triggering DNA demethylation via an active mechanism predicts a positive correlation between the extent to which the combined 5mC/5hmC levels decrease between two stages (i.e. %; WGBS) and the relative 5hmC levels in the stage immediately preceding this decrease, as further oxidation of 5hmC to 5fC is the rate limiting step in the full oxidation of 5mC to 5caC. c) A model implicating oxidation of 5mC in safeguarding DNA hypomethylation following the major wave of DNA demethylation predicts that regions where the majority of DNA demethylation has been lost between two stages (i.e. those that are newly hypomethylated) will have high relative levels of 5hmC in the stage immediately following the major wave of DNA demethylation to remove residual methylation and/or aberrant de novo methylation. Thus, a limited correlation between the extent to which the combined 5mC/5hmC levels decrease between two stages (i.e. %, WGBS) and the relative 5hmC levels in the stage immediately following this decrease may also be seen.
Extended Data Fig. 6
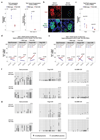
Extended Data Fig. 6. Tet1-3 expression and locus-specific DNA methylation in Tet1-KO PGCs during epigenetic reprogramming.
a) Expression of Tet1 total transcript (left) or deleted exon 4 (right) in E12.5 Tet1-KO and wild type PGCs. Adjusted p-values (left) computed by DESeq2 and p-values (right) computed by Student’s t-test. Asterisks refer to mean values. b) Representative immunostaining against the N-terminus of Tet1 protein in E12.5 wild type and Tet1-KO PGCs. Scale bar represents 10 µm. c) Expression of Tet2 and Tet3 in E12.5 Tet1-KO and wild type PGCs. Adjusted p-values computed by DESeq2. Asterisks refer to mean values. d-e) Mean combined 5hmC/5mC levels levels (RRBS) in female (d) or male (e) E12.5 and E14.5 Tet1-KO and wild type PGCs for ICRs and germline gene promoters called hypermethylated in E14.5 Tet1-KO PGCs. The mean DNA modification level and p-values were computed by RnBeads software (see Methods for details). f-g) Locus-specific bisulphite sequencing of the Dazl promoter (left), the Peg3 ICR (middle) and the IG-DMR ICR (right) in E12.5 (f) and E13.5 (g) female Tet1-KO and wild type PGCs. Specific details regarding sample sizes and how samples were collected are found in Statistics and Reproducibility section.
Extended Data Fig. 7
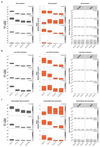
Extended Data Fig. 7. Promoter DNA methylation clustering analysis during germline reprogramming.
a) The combined promoter 5mC/5hmC levels (WGBS, right), promoter 5hmC levels (AbaSeq, centre), or gene expression levels (RNA-Seq, right) in consecutive stages of PGC development for all genes grouped by K-means clustering of the combined 5mC/5hmC dynamics at their promoter regions. b-c) Boxplots depicting the combined promoter 5mC/5hmC levels (WGBS, right), promoter 5hmC levels (AbaSeq, centre), or gene expression levels (RNA-Seq, right) in consecutive stages of PGC development for three clusters of genes with either low CpG promoters (LCPs; b) or intermediate CpG promoters (ICPs; c) grouped by K-means clustering of the combined 5mC/5hmC dynamics at their promoter regions. For all boxplots, the upper and lower hinges correspond to the first and third quartiles, the middle line corresponds to the median, and the maxima and minima respectively correspond to the highest or lowest value within 1.5× the inter-quartile range. Specific details regarding sample sizes and how samples were collected are found in Statistics and Reproducibility section.
Extended Data Fig. 8
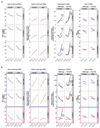
Extended Data Fig. 8. DNA modification and expression dynamics in wild type and Tet1-KO PGCs at retrotransposons normally activated concurrent with epigenetic reprogramming.
a-b) Combined 5mC/5hmC dynamics in wild type PGCs (%; WGBS; far left), relative 5hmC dynamics (AbaSeq read counts normalised to E10.5; centre left) in wild type PGCs, the expression dynamics in either wild type or Tet1-KO PGCs (transcripts per million (TPM); RNA-Seq; centre right), and combined 5mC/5hmC dynamics in wild type and Tet1-KO PGCs (%; RRBS; far right) for representative repetitive elements significantly up-regulated (adj. p-value < 0.05; Sleuth) in a sex-independent manner (a), in a male-specific manner (b, blue box), or in a female-specific manner (b, pink box) between E10.5 and E14.5 in wild type PGCs. Mean values are shown in all cases. Adjusted p-values for differential repeat expression analysis between E14.5 wild type and Tet1-KO PGCs are based on Sleuth software. Specific details regarding sample sizes and how samples were collected are found in Statistics and Reproducibility section.
Extended Data Fig. 9
Extended Data Fig. 9. Characterisation of GRR gene regulation by Tet1 and 5mC in PGCs and mESCs.
a) CpG density at GRR gene promoters and other relevant promoters; p-values are based on a two-sided Wilcoxon test. b) Mean 5hmC dynamics at GRR gene promoters and non-activated methylated and demethylating HCPs in PGCs; p-values are based on a two-sided paired Wilcoxon test. c) Log2-fold change between Tet1-KO and wild type E14.5 male (blue) or female (pink) PGCs for GRR genes and other relevant gene sets. FWER-adjusted p-values are based on GSEA software (see Methods for details). d) Log2-fold change between Dnmt1-CKO and wild type mESCs (green), or between E14.5 female (pink) or male (blue) wild type PGCs and E10.5 wild type PGCs, for GRR genes and other relevant gene sets. FWER-adjusted p-values are based on GSEA software (see Methods for details). e) Correlation between the difference in combined 5mC/5hmC levels (x-axis; Tet1-KO (RRBS; %) – WT (RRBS; %)) at GRR promoters and the change in GRR gene expression (y-axis; log2(Tet1-KO/WT)) in E12.5 (right) and E14.5 (left) Tet1-KO PGCs. Spearman correlation is shown. f) Representative western blot showing Tet1 and Lamin B protein expression in wild type, Dnmt-TKO, and Tet1-KO Dnmt-TKO mESCs. For all boxplots, the upper and lower hinges correspond to the first and third quartiles, the middle line corresponds to the median, and the maxima and minima respectively correspond to the highest or lowest value within 1.5× the inter-quartile range. For all figures, specific details regarding sample sizes and how samples were collected are found in Statistics and Reproducibility section. Specific details regarding sample sizes and how samples were collected are found in Statistics and Reproducibility section.
Extended Data Fig. 10
Extended Data Fig. 10. Epigenetic characterisation of GRR gene promoters in mESCs.
a) Genomic sequences centred on TSSs of GRR genes, non-GRR genes activated in both male and female PGCs between E10.5 and E14.5, and non-GRR methylated and demethylating HCP genes in wild type mESCs grown in serum-containing media. Each horizontal line represents one gene; the intensity of red indicates the relative enrichment for the feature shown at the top of each column. The TSS and sequences 5 kb upstream and downstream of the TSS are shown. b-f) Boxplots depicting the levels of: (b) combined 5mC/5hmC levels (WGBS); (c) 5hmC (AbaSeq) ; (d) Tet1 (ChIP-Seq); (e) Ring1b (ChIP-Seq) and (f) H2Aub levels (ChIP-Seq) at promoters of either GRR genes and other relevant gene sets in wild type mESCs grown in serum-containing media. For all boxplots, the upper and lower hinges correspond to the first and third quartiles, the middle line corresponds to the median, and the maxima and minima respectively correspond to the highest or lowest value within 1.5× the inter-quartile range. p-values are based on two-sided Wilcoxon test. g) Metagene plot depicting median H3K4me3 levels (ChIP-Seq) around TSS of GRR genes (left) and non-GRR HCP genes that are also initially methlylated and subsequently demethylated during PGC reprogramming (right) in wild type and Tet1-KO mESCs grown in serum containing media. p-values are based on paired two-sided Wilcoxon test for region of TSS -1kB/+500bp. Specific details regarding sample sizes and how samples were collected are found in Statistics and Reproducibility section.
Extended Data Fig. 11
Extended Data Fig. 11. Characterisation of GRR gene regulation by PRC1 and 5mC in PGCs and mESCs.
a) Overlap between GRR genes and genes significantly up-regulated in E11.5 and/or E12.5 PRC1 conditional knockout PGCs compared with wild-type. p-values based on hypergeometric test. b) Representative western blot showing H2Aub and H2A levels in wild type or Dnmt-TKO mESCs + 6h DMSO, and wild type or Dnmt-TKO mESCs + 6h PRT4165 (PRC1 inhibitor). c) Classification of GRR genes depending on their dependency for 5mC and/or PRC1 reprogramming in mESCs (see Methods for details). Specific details regarding sample sizes and how samples were collected are found in Statistics and Reproducibility section.
Extended Data Fig. 12
Extended Data Fig. 12. Model.
Fig. 1
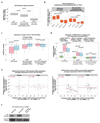
Fig. 1. 5mC and 5hmC dynamics during epigenetic reprogramming.
a) Key events during mouse PGC development. b-c) Individual 5mC (b, left) and 5hmC (b, right) and combined 5mC/5hmC (c) levels in mESCs and E9.5 to E13.5 PGCs (LC/MS). Asterisks in (b) refer to mean values. Adjusted p-values are based on ANOVA and Tukey posthoc test. Bar chart in (c) depicts median value of biological replicates depicted in (b). d) Re-distribution of 5hmC from the uniquely mapped part of the genome to repetitive elements between E10.5 and E12.5. p-values based on combined ANOVA and Tukey post hoc test. e) Representative 5hmC immunostaining in E10.5 and E12.5 PGCs. Scale bar represents 10 µm. Details regarding sample sizes and how samples were collected can be found in Statistics and Reproducibility section.
Fig. 2
Fig. 2. Tet1 safeguards but does not drive DNA demethylation.
a-b) Representative immunostaining against 5hmC (a) or 5mC (b) in E13.5 wild type and Tet1-KO PGCs. Scale bar represents 10 µm. c-d) Global 5hmC (c) and 5mC (d) levels (LC/MS) in wild type and Tet1-KO PGCs. Sample numbers are indicated on graphs. Asterisks refer to mean values. p-values are based on two-sided Student’s t-test. e) Top Figure: Proportion of differentially methylated regions in E14.5 Tet1-KO PGCs (p<0.05, >10% methylation difference; p-value derived from RnBeads software). Bottom Figure: Combined 5mC/5hmC levels (RRBS) in E12.5 (middle) and E14.5 (bottom) Tet1-KO (red) and wild type (blue) PGCs for all E14.5 hypermethylated 2kB windows. DNA modification levels from E10.5 wild type PGCs are also shown (top panel). Median combined 5mC/5hmC levels are denoted by vertical lines. Details regarding sample sizes and how samples were collected can be found in Statistics and Reproducibility section.
Fig. 3
Fig. 3. Germline reprogramming responsive (GRR) genes.
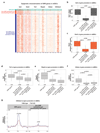
a) Combined promoter 5mC/5hmC levels (right), promoter 5hmC levels (centre), or gene expression levels (right) in consecutive stages of PGC development for HCP gene clusters (see Methods). The upper and lower hinges correspond to the first and third quartiles, the middle line corresponds to the median, and the maxima and minima respectively correspond to the highest or lowest value within 1.5× the inter-quartile range. b) Genomic sequences centred on TSSs of methylated and demethylating HCPs (cluster 3, Fig. 3A) ranked based on the significance of up-regulation between E10.5 and E14.5 in wild type PGCs. Each horizontal line represents one gene; the intensity of red indicates the relative enrichment for the feature shown at the top of each column. The TSS +/-5kb is shown. c) Gene ontology (GO) terms associated with germline reprogramming responsive (GRR) genes; adj. p-value is based on DAVID software. Details regarding sample sizes and how samples were collected can be found in Statistics and Reproducibility section.
Fig. 4
Fig. 4. Epigenetic principles of GRR gene activation.
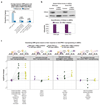
a) GRR gene expression dynamics in Tet1-KO PGCs; p-values are based on a two-sided paired Wilcoxon test. b) Combined 5mC/5hmC levels (RRBS) at GRR genes in E12.5 or E14.5 Tet1-KO (red) and wild type (blue) PGCs. For comparison, combined 5mC/5hmC levels in mESCs (% ; WGBS) are shown. p-values are based on paired two-sided Wilcoxon test. c-d) Log2-fold change between Dnmt-TKO (green) or Tet1-KO Dnmt-TKO and wild type mESCs (in c) or between wild type + 6h PRT4165 treatment (purple), Dnmt-TKO + 6h DMSO treatment (green) or Dnmt-TKO + 6h PRT4165 treatment (yellow) and wild type + 6h DMSO treatment mESCs (in d) for GRR genes and other relevant genes sets. FWER-adjusted p-values are based on GSEA software (see Methods for details). Specific details regarding sample sizes and how samples were collected are found in Statistics and Reproducibility section. For all boxplots, the upper and lower hinges correspond to the first and third quartiles, the middle line corresponds to the median, and the maxima and minima respectively correspond to the highest or lowest value within 1.5× the inter-quartile range.

Comment in

References

    1. Lesch B, Page D. Genetics of germ cell development. Nat Rev Genet. 2012;13:781–794. - PubMed
    1. Guibert S, Forné T, Weber M. Global profiling of DNA methylation erasure in mouse primordial germ cells. Genome Res. 2012;22:633–641. - PMC - PubMed
    1. Hackett J, et al. Germline DNA demethylation dynamics and imprint erasure through 5-hydroxymethylcytosine. Science. 2013;339:448–452. - PMC - PubMed
    1. Hajkova P, et al. Chromatin dynamics during epigenetic reprogramming in the mouse germ line. Nature. 2008;452:877–881. - PMC - PubMed
    1. Hajkova P, et al. Epigenetic reprogramming in mouse primordial germ cells. Mech Dev. 2002;117:15–23. - PubMed

Publication types