

Augmented frontal cortex diacylglycerol levels in Parkinson's disease and Lewy Body Disease
- PMID: 29513680
- PMCID: PMC5841652
- DOI: 10.1371/journal.pone.0191815
Augmented frontal cortex diacylglycerol levels in Parkinson's disease and Lewy Body Disease
Abstract
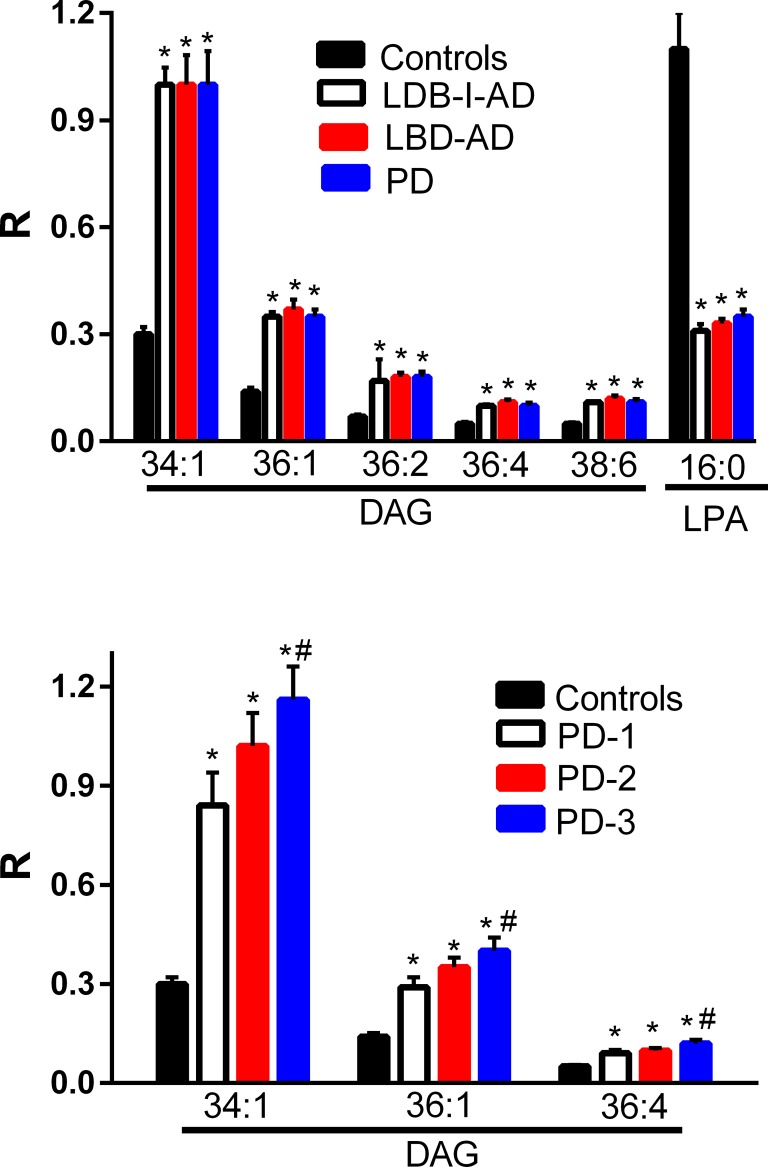
Background: Research from our laboratory, and that of other investigators, has demonstrated augmented levels of diacylglycerols (DAG) in the frontal cortex and plasma of subjects with Alzheimer's disease (AD) and Mild Cognitive Impairment (MCI). We have extended these observations to investigate the frontal cortex of subjects with Parkinson's disease (PD) and Lewy Body Disease (LBD), with and without coexisting pathologic features of AD.
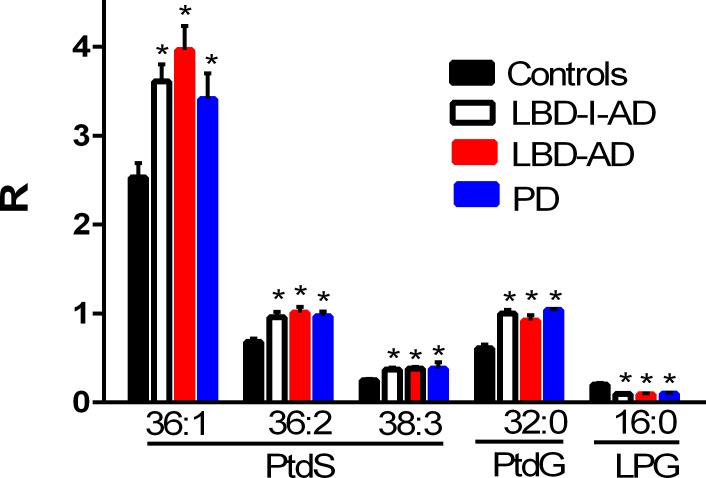
Methods/principal findings: Utilizing a high-resolution mass spectrometry analytical platform, we clearly demonstrate that DAG levels are significantly increased in the frontal cortex of subjects with PD, LBD with intermediate neocortical AD neuropathology, and in LBD with established neocortical AD neuropathology. In the case of the PD cohort, increases in cortical DAG levels were detected in cases with no neocortical pathology but were greater in subjects with neocortical pathology. These data suggest that DAG changes occur early in the disease processes and are amplified as cortical dysfunction becomes more established.
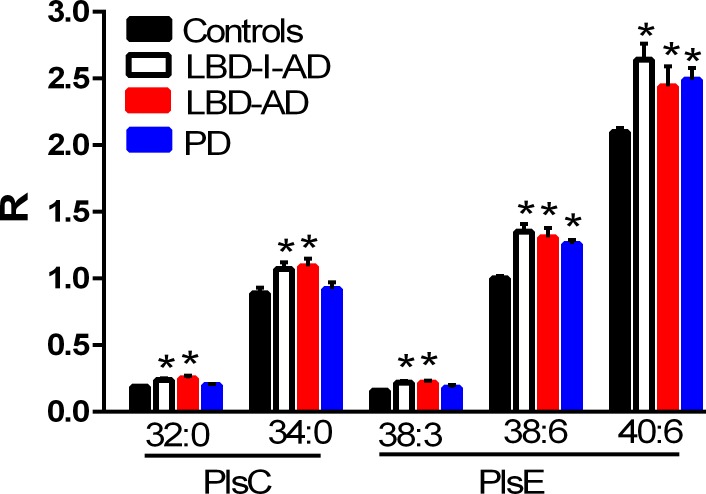
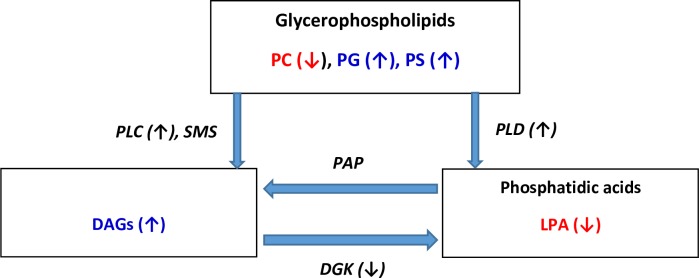
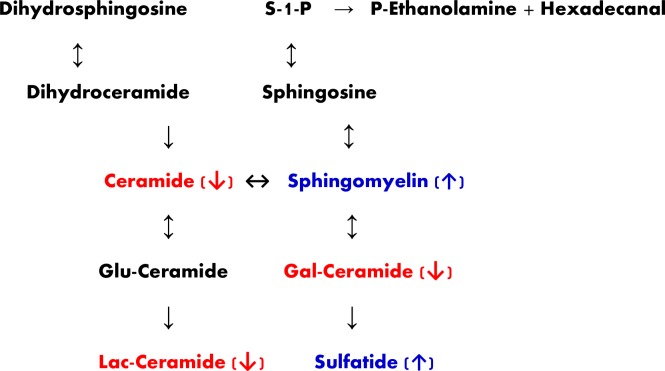
Conclusions: These findings suggest that altered DAG synthesis/metabolism is a common feature of neurodegenerative diseases, characterized by proteinopathy, that ultimately result in cognitive deficits. With regard to the mechanism responsible for these biochemical alterations, selective decrements in cortical levels of phosphatidylcholines in LBD and PD suggest that augmented degradation and/or decreased synthesis of these structural glycerophospholipids may contribute to increases in the pool size of free DAGs. The observed augmentation of DAG levels may be phospholipase-driven since neuroinflammation is a consistent feature of all disease cohorts. If this conclusion can be validated it would support utilizing DAG levels as a biomarker of the early disease process and the investigation of early intervention with anti-inflammatory agents.
Conflict of interest statement
Figures
References
-
- Wood PL. Lipidomics of Alzheimer's disease: current status. Alzheimers Res Ther. 2012; 4:5 doi: 10.1186/alzrt103 . - DOI - PMC - PubMed
-
- Wood PL, Wood JA. Critical assessment of the status of Alzheimer’s disease Biomarkers. J. Parkinson’s disease & Alzheimer’s disease 2014; 1:4.
-
- Wood PL, Mankidy R, Ritchie S, Heath D, Wood JA, Flax J, et al. Circulating plasmalogen levels and Alzheimer Disease Assessment Scale-Cognitive scores in Alzheimer patients. J Psychiatry Neurosci. 2010; 35:59–62. doi: 10.1503/jpn.090059 . - DOI - PMC - PubMed
-
- Chan RB, Oliveira TG, Cortes EP, Honig LS, Duff KE, Small SA, et al. Comparative lipidomic analysis of mouse and human brain with Alzheimer disease. J Biol Chem. 2012; 287:2678–88. doi: 10.1074/jbc.M111.274142 . - DOI - PMC - PubMed
-
- Wood PL, Barnette BL, Kaye JA, Quinn JF, Woltjer RL. Non-targeted lipidomics of CSF and frontal cortex grey and white matter in control, mild cognitive impairment, and Alzheimer's disease subjects. Acta Neuropsychiatr. 2015; 27:270–8. doi: 10.1017/neu.2015.18 . - DOI - PubMed
Publication types
MeSH terms
Substances
Grants and funding
LinkOut - more resources
Full Text Sources
Other Literature Sources
Medical
