

Advanced quantitative methods in correlating sarcopenic muscle degeneration with lower extremity function biometrics and comorbidities
- PMID: 29513690
- PMCID: PMC5841751
- DOI: 10.1371/journal.pone.0193241
Advanced quantitative methods in correlating sarcopenic muscle degeneration with lower extremity function biometrics and comorbidities
Abstract
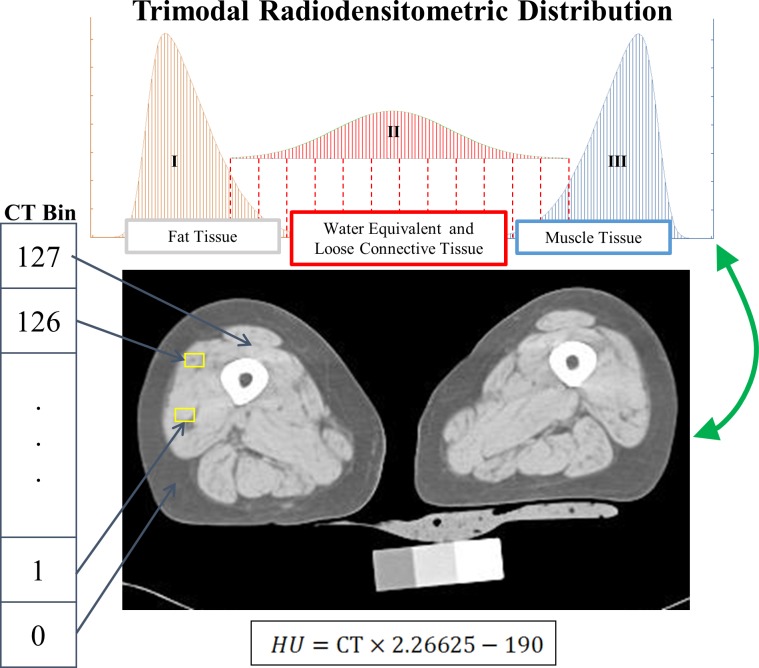
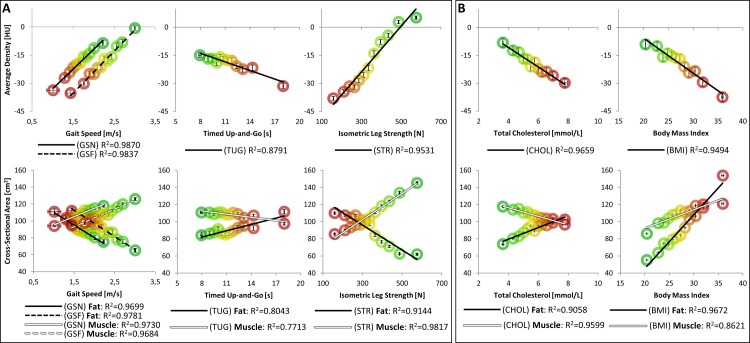
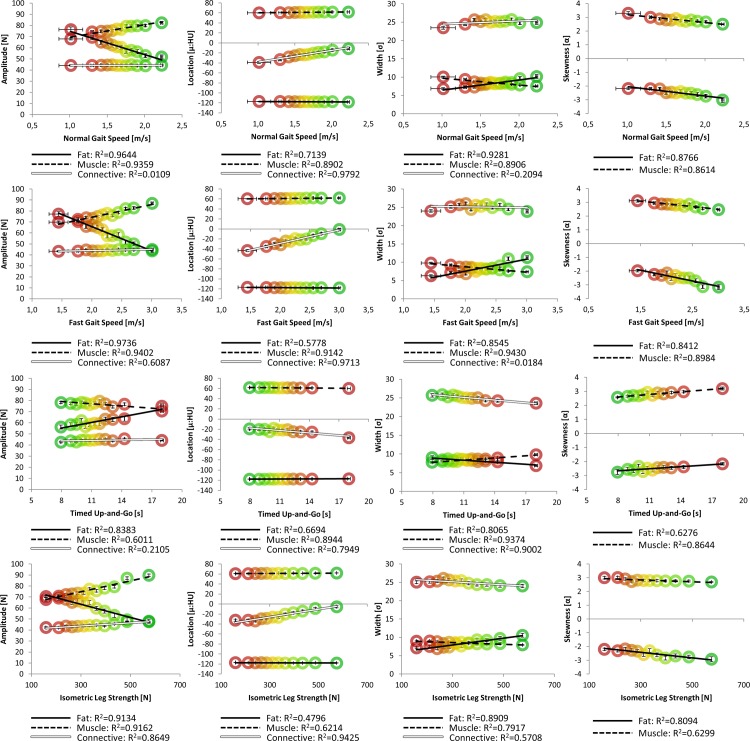
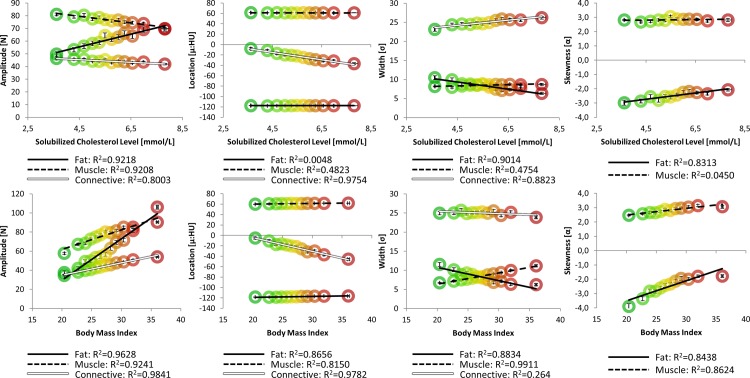
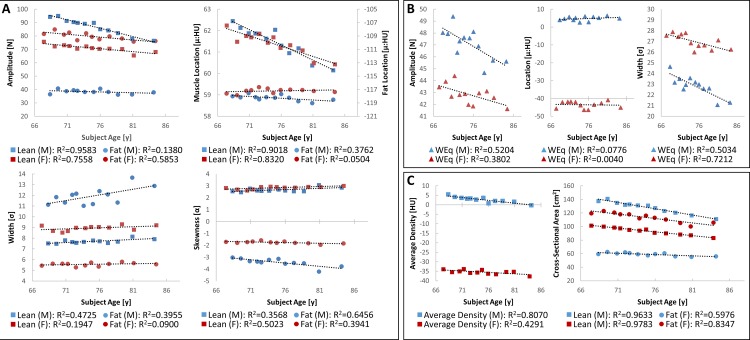
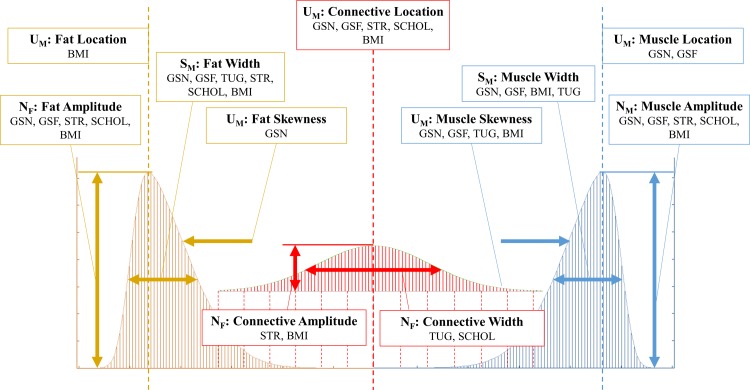
Sarcopenic muscular degeneration has been consistently identified as an independent risk factor for mortality in aging populations. Recent investigations have realized the quantitative potential of computed tomography (CT) image analysis to describe skeletal muscle volume and composition; however, the optimum approach to assessing these data remains debated. Current literature reports average Hounsfield unit (HU) values and/or segmented soft tissue cross-sectional areas to investigate muscle quality. However, standardized methods for CT analyses and their utility as a comorbidity index remain undefined, and no existing studies compare these methods to the assessment of entire radiodensitometric distributions. The primary aim of this study was to present a comparison of nonlinear trimodal regression analysis (NTRA) parameters of entire radiodensitometric muscle distributions against extant CT metrics and their correlation with lower extremity function (LEF) biometrics (normal/fast gait speed, timed up-and-go, and isometric leg strength) and biochemical and nutritional parameters, such as total solubilized cholesterol (SCHOL) and body mass index (BMI). Data were obtained from 3,162 subjects, aged 66-96 years, from the population-based AGES-Reykjavik Study. 1-D k-means clustering was employed to discretize each biometric and comorbidity dataset into twelve subpopulations, in accordance with Sturges' Formula for Class Selection. Dataset linear regressions were performed against eleven NTRA distribution parameters and standard CT analyses (fat/muscle cross-sectional area and average HU value). Parameters from NTRA and CT standards were analogously assembled by age and sex. Analysis of specific NTRA parameters with standard CT results showed linear correlation coefficients greater than 0.85, but multiple regression analysis of correlative NTRA parameters yielded a correlation coefficient of 0.99 (P<0.005). These results highlight the specificities of each muscle quality metric to LEF biometrics, SCHOL, and BMI, and particularly highlight the value of the connective tissue regime in this regard.
Conflict of interest statement
Figures
References
-
- Metter EJ, Talbot LA, Schrager M, Conwit R. Skeletal muscle strength as a predictor of all-cause mortality in healthy men. J Gerontol A Biol Sci Med Sci. 2002; 57(10), B359–65. - PubMed
-
- Rantanen T. Muscle strength and body mass index as long-term predictors of mortality in initially healthy men. J Gerontol. 2000; 55A(3), 168–173. - PubMed
-
- Newman AB, Kupelian V, Visser M, Simonsick EM, Goodpaster BH, Kritchevsky SB, et al. Strength, but not muscle mass, is associated with mortality in the health, aging and body composition study cohort. J Gerontol A Biol Sci Med Sci. 2006; 61(1), 72–77. - PubMed
-
- Goodpaster BH, Carlson CL, Visser M, Kelley DE, Scherzinger A, Harris TB, et al. Attenuation of skeletal muscle and strength in the elderly: The Health ABC Study. Journal of Applied Physiology (Bethesda MD: 1985). 2001; 90(6), 2157–2165. - PubMed
Publication types
MeSH terms
LinkOut - more resources
Full Text Sources
Other Literature Sources
Medical
