

Real-time predictive seasonal influenza model in Catalonia, Spain
- PMID: 29513710
- PMCID: PMC5841785
- DOI: 10.1371/journal.pone.0193651
Real-time predictive seasonal influenza model in Catalonia, Spain
Abstract
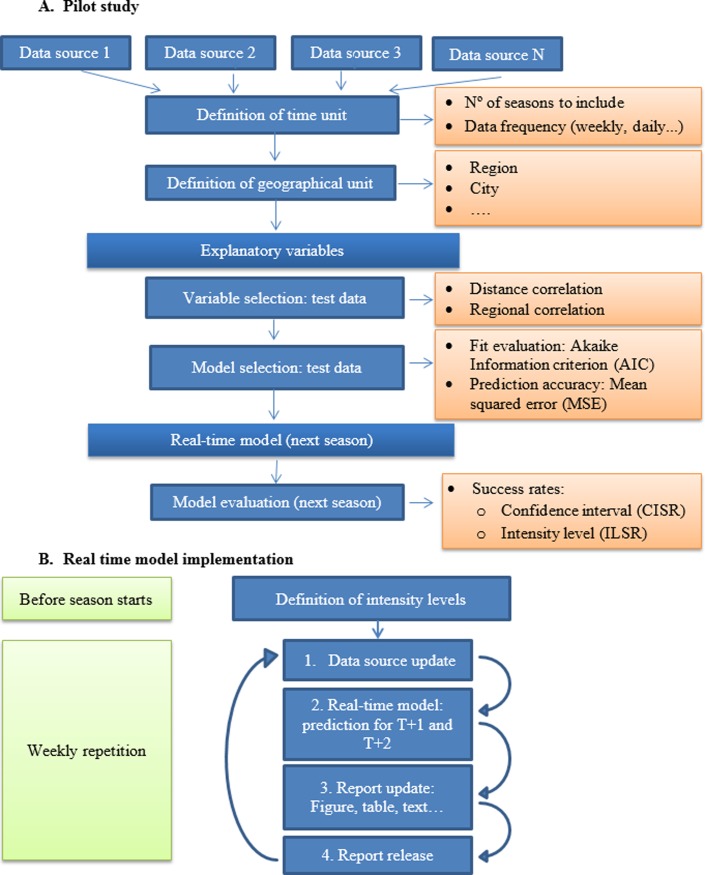
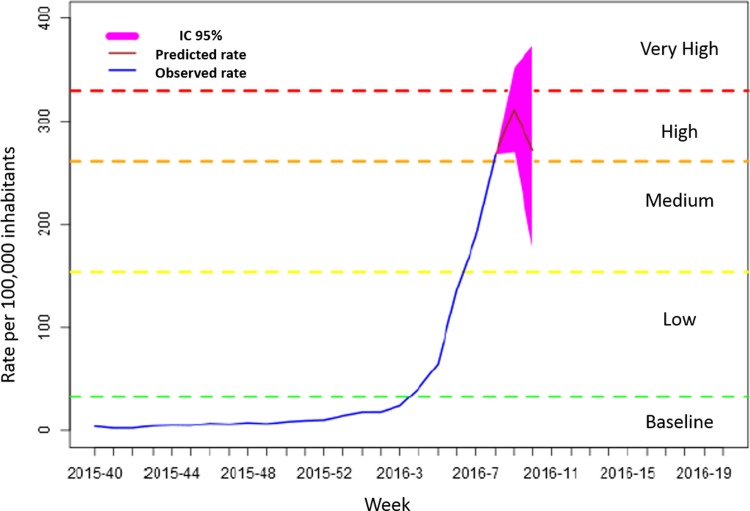
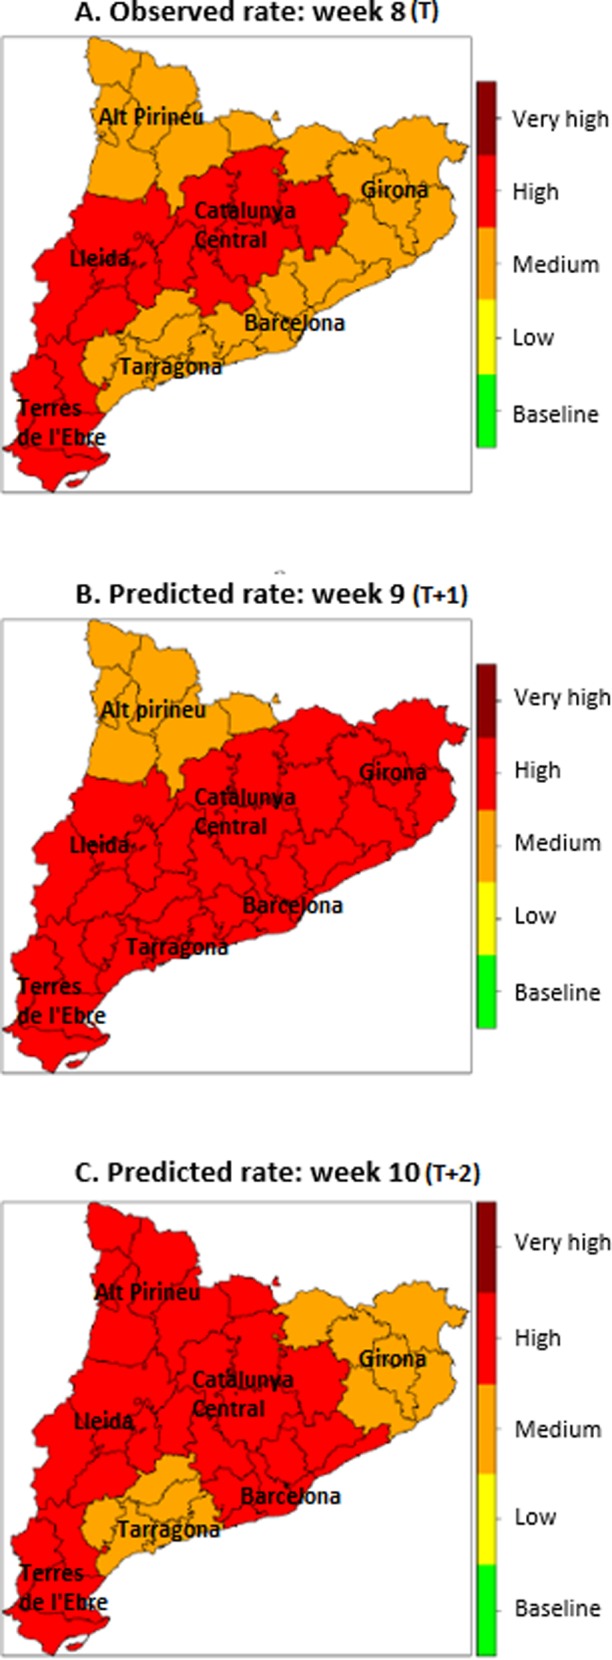
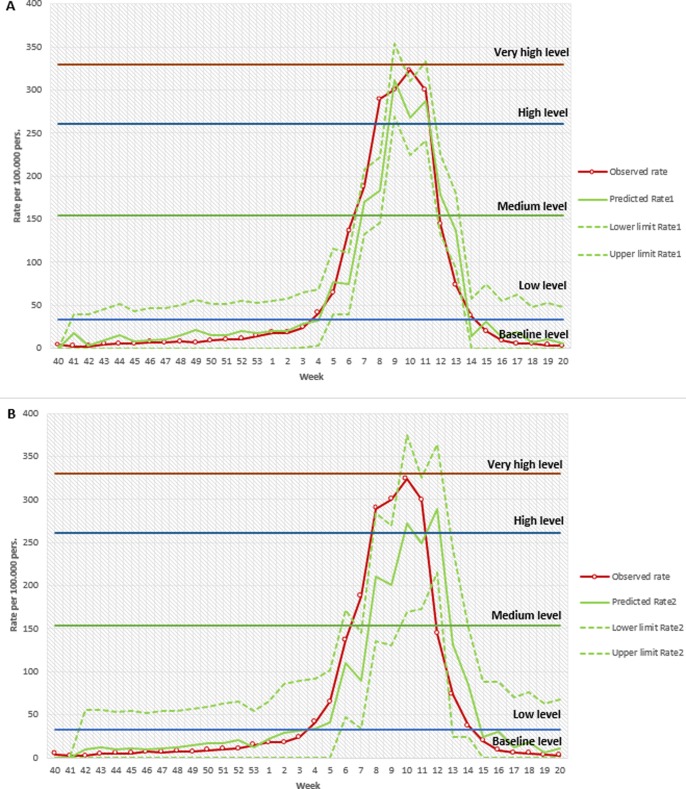
Influenza surveillance is critical to monitoring the situation during epidemic seasons and predictive mathematic models may aid the early detection of epidemic patterns. The objective of this study was to design a real-time spatial predictive model of ILI (Influenza Like Illness) incidence rate in Catalonia using one- and two-week forecasts. The available data sources used to select explanatory variables to include in the model were the statutory reporting disease system and the sentinel surveillance system in Catalonia for influenza incidence rates, the official climate service in Catalonia for meteorological data, laboratory data and Google Flu Trend. Time series for every explanatory variable with data from the last 4 seasons (from 2010-2011 to 2013-2014) was created. A pilot test was conducted during the 2014-2015 season to select the explanatory variables to be included in the model and the type of model to be applied. During the 2015-2016 season a real-time model was applied weekly, obtaining the intensity level and predicted incidence rates with 95% confidence levels one and two weeks away for each health region. At the end of the season, the confidence interval success rate (CISR) and intensity level success rate (ILSR) were analysed. For the 2015-2016 season a CISR of 85.3% at one week and 87.1% at two weeks and an ILSR of 82.9% and 82% were observed, respectively. The model described is a useful tool although it is hard to evaluate due to uncertainty. The accuracy of prediction at one and two weeks was above 80% globally, but was lower during the peak epidemic period. In order to improve the predictive power, new explanatory variables should be included.
Conflict of interest statement
Figures
References
-
- Dushoff J, Plotkin JB, Viboud C, Earn DJ, Simonsen L. Mortality due to influenza in the United States—an annualized regression approach using multiple-cause mortality data. Am J Epidemiol n.d.;163:181–7. doi: 10.1093/aje/kwj024 - DOI - PubMed
-
- Martin R, Conseil A, Longstaff A, Kodo J, Siegert J, Duguet A-M, et al. Pandemic influenza control in Europe and the constraints resulting from incoherent public health laws. BMC Public Health 2010;10:532 doi: 10.1186/1471-2458-10-532 - DOI - PMC - PubMed
-
- Torner N, Martínez A, Basile L, Marcos MA, Antón A, Mar Mosquera M, et al. Influenza vaccine effectiveness assessment through sentinel virological data in three post-pandemic seasons. Hum Vaccin Immunother 2015;11:225–30. doi: 10.4161/hv.36155 - DOI - PMC - PubMed
-
- Havers F, Thaker S, Clippard JR, Jackson M, McLean HQ, Gaglani M, et al. Use of Influenza Antiviral Agents by Ambulatory Care Clinicians During the 2012–2013 Influenza Season. Clin Infect Dis 2014;59:774–82. doi: 10.1093/cid/ciu422 - DOI - PMC - PubMed
-
- Ajelli M, Merler S, Pugliese A, Rizzo C. Model predictions and evaluation of possible control strategies for the 2009 A/H1N1v influenza pandemic in Italy. Epidemiol Infect n.d.;139:68–79. doi: 10.1017/S0950268810001317 - DOI - PubMed
Publication types
MeSH terms
LinkOut - more resources
Full Text Sources
Other Literature Sources
Medical
