. 2018 Mar 6;27(3):630-644.e4.
doi: 10.1016/j.cmet.2018.02.016.

The Pericyte of the Pancreatic Islet Regulates Capillary Diameter and Local Blood Flow

Affiliations

The Pericyte of the Pancreatic Islet Regulates Capillary Diameter and Local Blood Flow

Joana Almaça et al. Cell Metab. .

Abstract

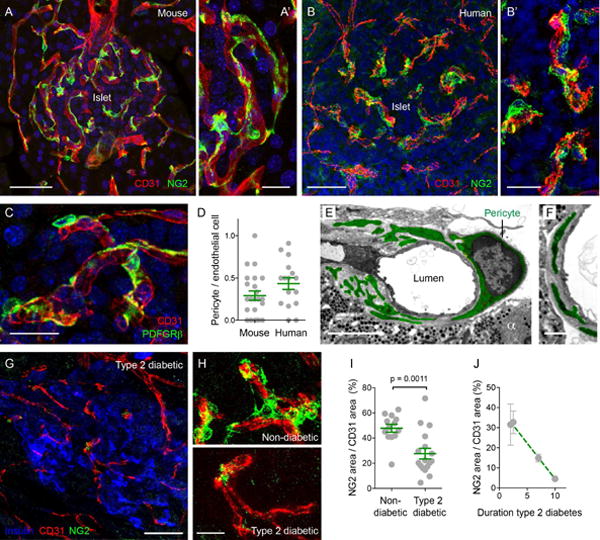
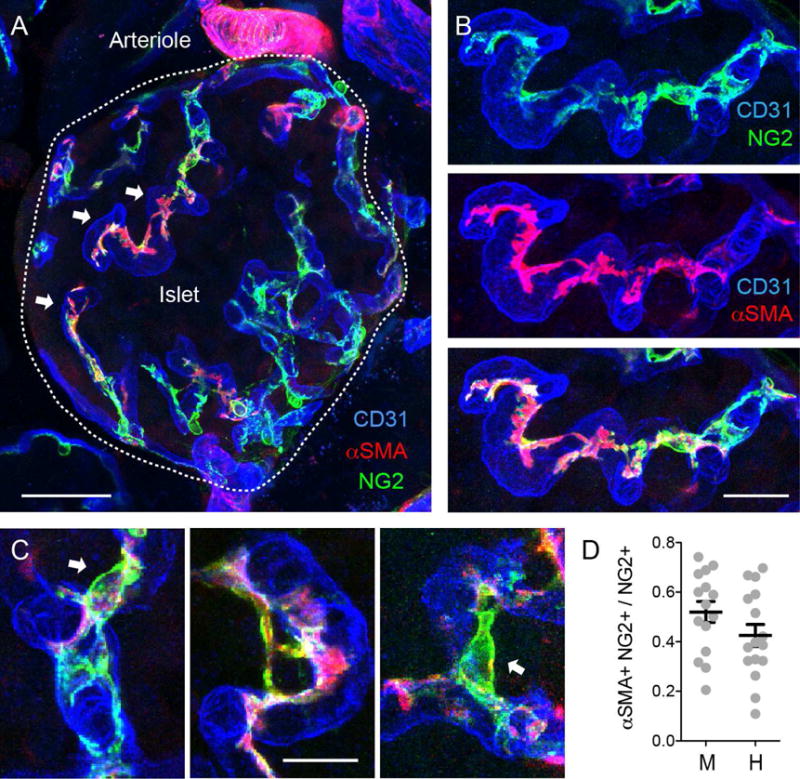
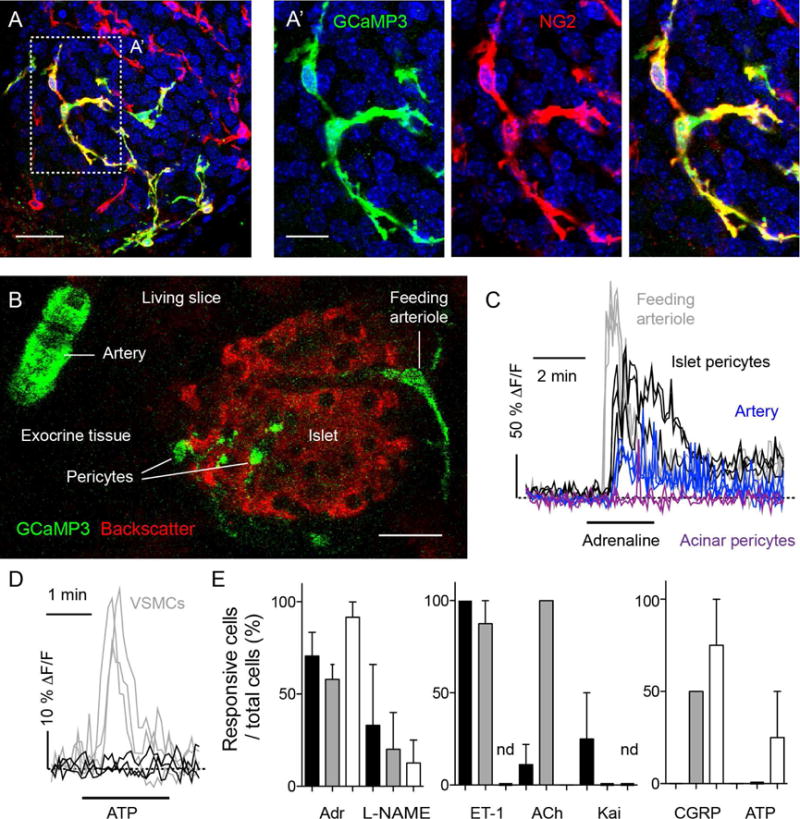
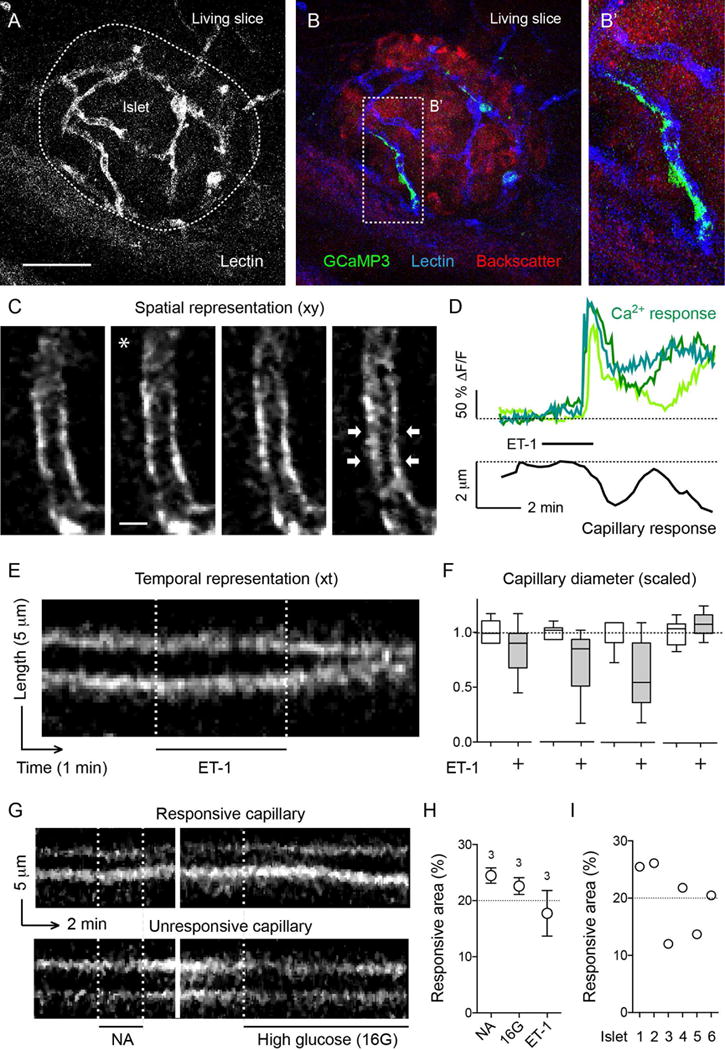
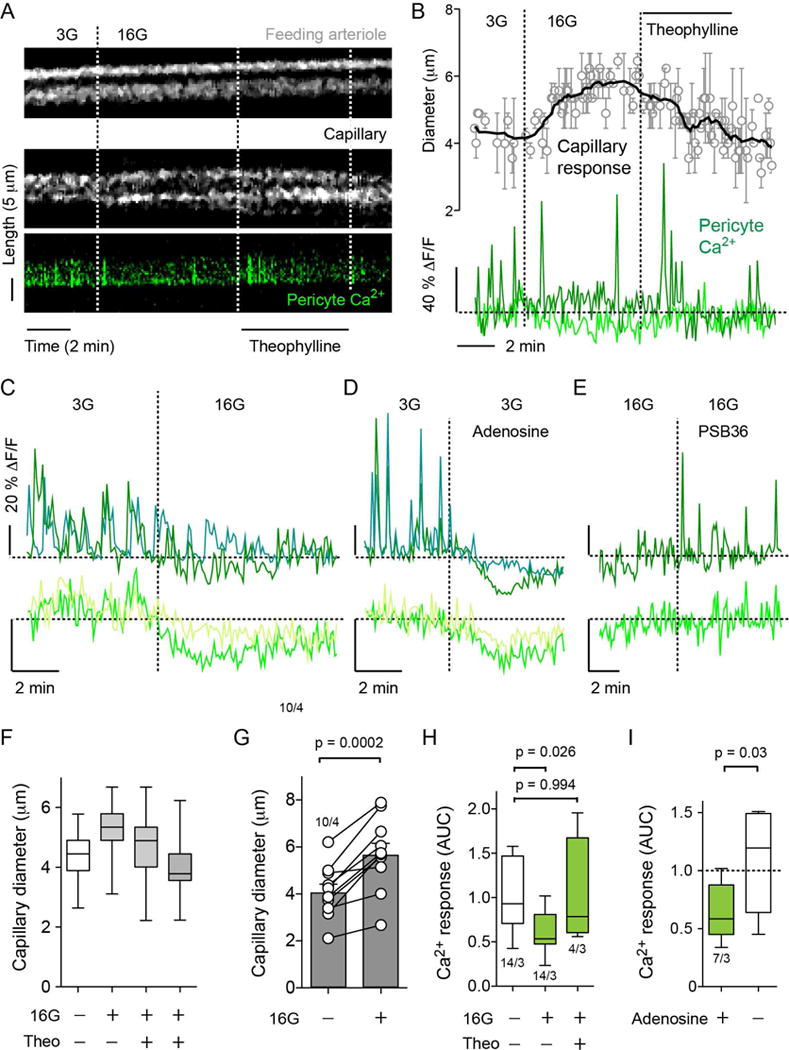
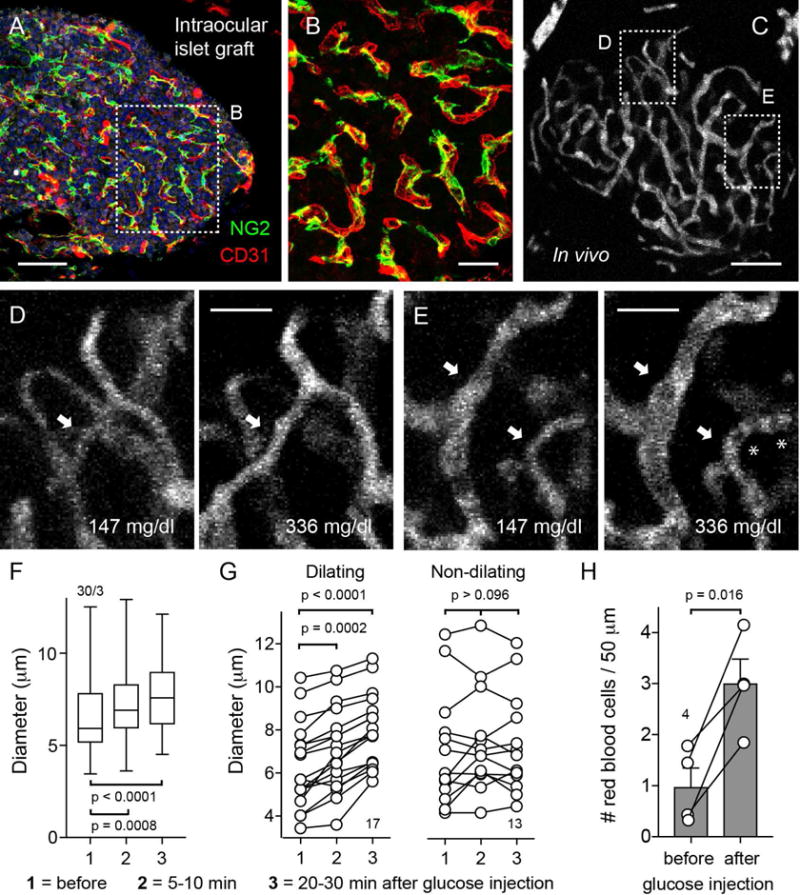
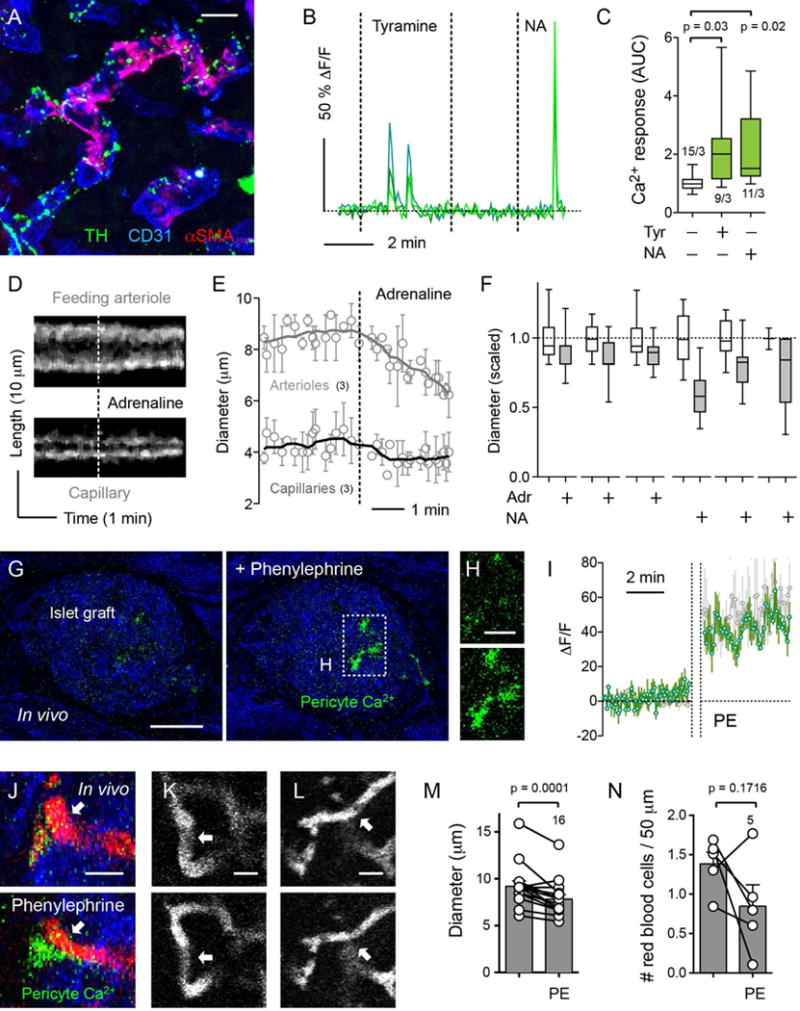
Efficient insulin secretion requires a well-functioning pancreatic islet microvasculature. The dense network of islet capillaries includes the islet pericyte, a cell that has barely been studied. Here we show that islet pericytes help control local blood flow by adjusting islet capillary diameter. Islet pericytes cover 40% of the microvasculature, are contractile, and are innervated by sympathetic axons. Sympathetic adrenergic input increases pericyte activity and reduces capillary diameter and local blood flow. By contrast, activating beta cells by increasing glucose concentration inhibits pericytes, dilates islet capillaries, and increases local blood flow. These effects on pericytes are mediated by endogenous adenosine, which is likely derived from ATP co-released with insulin. Pericyte coverage of islet capillaries drops drastically in type 2 diabetes, suggesting that, under diabetic conditions, islets lose this mechanism to control their own blood supply. This may lead to inadequate insulin release into the circulation, further deteriorating glycemic control.

Keywords: adenosine; blood flow; capillary diameter; diabetes; hyperemia; insulin secretion; pancreatic islet; pancreatic slice; pericytes; sympathetic.


Conflict of interest statement

DECLARATION OF INTERESTS

The authors declare no competing interests.

Figures

Figure 1
Figure 1. Capillaries in mouse and human islets are covered with pericytes
(A–C) Z-stack of confocal images of mouse (A and C) and human islets (B) showing pericytes and endothelial cells respectively immunostained for chondroitin sulfate proteoglycan (NG2, neuron-glial antigen 2, green) and for CD31 (PECAM, red). Nuclei are shown in blue. (A′) and (B′) higher magnifications of (A) and (B). Pericytes in mouse islets also express platelet-derived growth factor receptor-beta (PDGFRβ green) (C). Scale bars, 50 μm (A and B) and 10 μm (A′, B′ and C). (D) Quantification of the ratio of pericyte number to endothelial cell number in confocal images in mouse and human islets. Dots represent confocal images pooled from > 3 pancreas per group. Average ratios ± SEM are shown in green. (E and F) Transmission electron microscopic images of a pericyte cell body (E) and cytoplasmic processes wrapping capillaries in mouse islets (E and F). An alpha cell can be seen (α). Pericyte processes are embedded within the endothelial basement membrane (F). The pericyte cytoplasm is shown in green. Scale bars, 5 μm (E) and 2 μm (F). (G and H) Z-stack of confocal images of an islet from a type 2 diabetic individual (duration of disease = 10 years), showing pericytes (NG2, green), endothelial cells (CD31, red) and beta cells (insulin, blue). (H) Higher magnifications of pericytes covering capillaries in islets from a non-diabetic individual (upper panel) and type 2 diabetic individual (shown in (G), lower panel). Scale bars, 50 μm (G) and 20 μm (H). (I) Quantification of the ratio of NG2-immunostained area to CD31-immunostained area in human islets from non-diabetic or type 2 diabetic individuals (T2D). Dots represent the ratios of individual islets pooled from > 4 pancreases per group. Average ratios ± SEM are shown in green (unpaired t-test; p-value shown in the graph). (J) Correlation between pericytic coverage of islet capillaries (ratio as in I) and the duration of type 2 diabetes (r2 = 0.32, p = 0.03).
Figure 2
Figure 2. A subset of islet pericytes expresses alpha smooth muscle actin
(A and B) Z-stack of confocal images of a mouse islet immunostained for NG2 (pericytes, green), CD31 (endothelial cells, blue), and alpha smooth muscle actin (αSMA, red). White arrows point to pericytes that express both NG2 and αSMA. αSMA expression is not equal throughout the pericytes cytoplasm. Vascular smooth muscle cells with their circular processes around the arteriole show strong αSMA staining. A high magnification of (A) showing islet capillaries is shown in (B). (C) Pericyte cell bodies (arrows) can be seen extending αSMA-labeled processes between different capillary branches. (D) Quantification of the fraction of NG2-positive pericytes that expresses αSMA in mouse (M) and human (H) islets. Dots represent individual islets pooled from > 3 mice or human donors. Scale bars, 50 μm (A) and 10 μm (B and C).
Figure 3
Figure 3. Recording Ca2+ responses in living pancreatic slices reveals functional differences between mural cell populations
(A and A′) Z-stack of confocal images of a pancreatic slice from an NG2-GCaMP3 transgenic mouse processed for immunohistochemistry after a physiological experiment. Shown is an islet immunostained for GFP (GCaMP3, green) and NG2 (red). The Ca2+ sensor GCaMP3 is expressed in pericytes (colocalization appears yellow in merged images). Cell nuclei are shown in blue. Scale bars, 20 μm (A) and 10 μm (A′). (B) Confocal image of a pancreatic slice from an NG2-GCaMP3 transgenic mouse showing mural cells expressing GCaMP3 (green) and islet endocrine cells (backscatter signal, red). GCaMP3 is expressed by different mural cells located around arteries, arterioles and within the islet parenchyma. Scale bar, 20 μm. (C) Representative traces showing changes in mean GCaMP3 fluorescence intensity induced by adrenaline (100 μM) in islet pericytes (black), acinar pericytes (purple) and mural cells on the feeding arteriole (gray) or around the artery (blue). Increases in GCaMP3 fluorescence indicate increases in cytosolic Ca2+ levels and are expressed as ΔF/F. Dashed horizontal line indicates the zero value. Each trace corresponds to one cell. (D) Representative traces showing changes in cytosolic Ca2+ levels in islet pericytes (black) and smooth muscle cells (VSMCs, gray) induced by ATP (100 μM). Dashed horizontal line indicates the zero value. (E) Quantification of the percentage of islet pericytes (black bars), acinar pericytes (white bars) and smooth muscle cells (gray bars) that respond to different vasoactive substances: adrenaline (Adr, 50–100 μM), l-nitro-arginine methyl ester (L-NAME, 10 μM), endothelin-1 (ET-1, 10 nM), acetylcholine (ACh, 100 μM), kainate (Kai, 10 μM), calcitonin gene-related peptide (CGRP, 10 μM) and ATP (100 μM). (nd, not determined; N = 3 – 22 cells were examined per substance).
Figure 4
Figure 4. Simultaneous recording of pericyte activation and capillary constriction
(A) Z-stack of confocal images of a pancreatic slice from an NG2-GCaMP3 transgenic mouse after intravascular injection of fluorescent Lycopersicon esculentum lectin to label the blood vessels (white). (B and B′) In the slice shown in (A), GCaMP3 fluorescence (Ca2+ levels) in pericytes (green) and capillaries (labeled with lectin, blue) in islets (red, backscatter signal) can be visualized simultaneously. Zoomed image of (B) is shown in (B′). (C) Sequential confocal images of an islet capillary before (left panel), during (middle panels; * indicates drug application) and after exposure (right panel) of a slice to endothelin 1 (ET-1, 10 nM). White arrows point at a constricting capillary region. (D) Representative traces showing simultaneous changes in cytosolic Ca2+ levels in islet pericytes (green traces) and capillary diameter (black trace) induced by endothelin 1 (10 nM). Dashed line on Ca2+ traces shows the zero value. (E) Temporal projection of a line scan perpendicular to the vessel axis shows the temporal pattern of changes in vessel diameter (reslice image, see STAR Methods and Figure S5). Capillary borders can be seen in white. Endothelin 1 (ET-1) induced a strong constriction of the islet capillary. (F) Quantification of changes in diameter induced by endothelin 1 based on temporal projections as shown in (E). Values were scaled to the initial diameter (before drug application). Changes in diameter are shown for four different capillaries of the same islet. Not all islet capillaries constricted upon stimulation. (G) Temporal projection of line scans of two different islet capillaries stimulated with noradrenaline (NA, 10 μM, left) and high glucose (16G, 16 mM, right). The capillary shown in the top panel is the same as the one shown in (E) that had responded to endothelin 1. The same vessel constricted upon noradrenaline and dilated upon high glucose (responsive capillary). The one shown in the bottom panel does not respond to the stimuli applied (unresponsive capillary). (H and I) Quantification of the percentage of the islet microvasculature that responded to vasoactive stimuli such as noradrenaline (NA), high glucose (16G) or ET-1, plotted for each stimulus (H), or for different islets independently of the stimulus used (I). Scale bars, 50 μm (A, applies to B) and 5 μm (C).
Figure 5
Figure 5. High glucose stimulation of beta cells inhibits pericytes and dilates capillaries through adenosine and A1 receptors
(A) Temporal projections of line scans showing changes in vessel diameter (upper and middle panels) of a feeding arteriole (upper panel) and an islet capillary (middle panel) and of cytosolic Ca2+ levels in a nearby capillary pericyte (green, lower panel) induced by increasing extracellular glucose concentration from 3 mM (3G) to 16 mM (16G) in a living pancreatic slice. High glucose increased capillary, but not arteriole, diameter and simultaneously decreased cytosolic Ca2+ in the pericyte. Theophylline (20 μM, in 16G), a non-specific antagonist of adenosine receptors, reversed the effects of high glucose. (B) Traces of responses as in (A) show the average change in vessel diameter (upper panel, N = 3 capillaries) and cytosolic Ca2+ levels in pericytes (lower panel). Dashed line on Ca2+ traces shows the zero value. Each trace corresponds to one pericyte. (C–E) Traces showing changes in cytosolic Ca2+ levels in islet pericytes induced by (C) high glucose (16 mM, 16G), (D) adenosine (50 μM) in 3 mM glucose and (E) A1 adenosine receptor antagonist (PSB36, 100 nM) in 16 mM glucose. Changes in baseline cytosolic Ca2+ levels (lower panel) are shown at a higher gain. Y-axis bars correspond to 20% change (ΔF/F). Each trace corresponds to one pericyte. Horizontal dashed lines show the zero value, and vertical dashed lines when stimuli were applied. (F) Quantification of the changes in capillary diameter of a responsive capillary induced by high glucose (16G) and the reversal by theophylline (Theo; in 16G) 2 min and 5 min after application of the antagonist. (G) Quantification of the changes in capillary diameter induced by 16 mM glucose. Each pair of symbols is one capillary (N = 10 capillaries pooled from 4 slice preparations, paired t-test). (H) Quantification of changes in cytosolic Ca2+ levels in pericytes induced by high glucose (16G) and high glucose plus theophylline (Theo, 20 μM). The area under the curve (AUC) was quantified in a 4-5 min recording in each condition. N = 4–14 pericytes from 3 slice preparations, one-way ANOVA corrected for multiple comparisons. (I) Quantification of the changes in cytosolic Ca2+ levels in pericytes induced by adenosine (50 μM). Area under the curve (AUC) was quantified in 3 min recordings before, during and after adenosine. Data are scaled to AUC values before adenosine application (dashed horizontal line). N = 7 pericytes from 3 slices preparations, paired t-test.
Figure 6
Figure 6. Raising glycemia dilates islet capillaries in vivo and increases blood flow
(A and B) Z-stack of confocal images of an islet graft 6 months after transplantation into the eye immunostained for NG2 (pericytes, green), CD31 (endothelial cells, red), and insulin (beta cells, gray). Cell nuclei are shown in blue. Pericytes cover capillaries in transplanted islets as they do in the pancreas. (B) Zoomed image of (A). (C–E) Z-stack of confocal images of the graft vasculature visualized with an i.v. injection of FITC-dextran. (D and E) Islet capillaries were imaged before and after an i.p. injection of 20% glucose (2 g/Kg body weight). Glycemia was measured at different time points. A rise in glycemia caused regions of the islet to become perfused (arrow in D) or dilated islet capillaries (arrows in E). Asterisks point at red blood cells. (F) Quantification of changes in capillary diameter in the islet before (glycemia = 147 mg/dL), 5-10 min (glycemia = 279 mg/dL) or 20-30 min (glycemia = 336 mg/dL) after injection of glucose. N = 30 capillaries from 3 islet grafts, one-way ANOVA corrected for multiple comparisons. (G) Capillaries were grouped according to their responses to a rise in glycemia: vessels that showed a progressive dilation (dilating capillaries) or vessels that did not change or exhibited a transient non-significant dilation (non-dilating). N = 13-17 capillaries from 3 islet grafts, one-way ANOVA corrected for multiple comparisons. (H) Quantification of the number of red blood cells, identified as black shadows in the vessel lumen, in different islet capillaries before (glycemia = 147 mg/dL) and after injection of glucose (glycemia 336 mg/dL). N = 4 capillaries, paired t-test. Scale bars, 50 μm (A and C), 20 μm (B, D, and E).
Figure 7
Figure 7. Sympathetic activation of islet pericytes leads to capillary constriction ex vivo and in vivo
(A) Z-stack of confocal images of a mouse islet immunostained for the sympathetic nerve marker tyrosine hydroxylase (TH, green), for αSMA (pericytes, red) and for CD31 (endothelial cells, blue). TH-labeled axons and varicosities can be seen in close contact with endothelial cells and pericytes in islet blood vessels. (B) Representative traces showing changes in cytosolic Ca2+ levels in islet pericytes induced by tyramine (50 μM) and noradrenaline (NA, 50 μM). Values are expressed as ΔF/F. Each trace corresponds to one pericyte. Dashed horizontal line indicates the zero value. (C) Quantification of changes in cytosolic Ca2+ levels in pericytes induced by tyramine (Tyr, 50 μM) and noradrenaline (NA, 50 μM). AUC was quantified in a 2 min recording in each condition and scaled to control values (in 3 mM glucose). N = 9–15 cells per group from 3 slice preparations; one-way ANOVA corrected for multiple comparisons. (D) Temporal projections of line scans through a feeding arteriole (upper panel) and a capillary (lower panel) show a reduction in vessel diameter induced by adrenaline (50 μM) in a living pancreatic slice. (E) Traces showing the average change in vessel diameter induced by adrenaline (black = capillaries, N = 3; gray = arterioles, N = 3). (F) Quantification of changes in vessel diameter for individual capillaries induced by adrenaline (50 μM) and noradrenaline (NA, 10 μM), scaled to the initial diameter (before catecholamine application, in 3G). (G and H) In vivo imaging of islets from NG2-GCaMP3 mice transplanted into the eye before and 5 min after administration of phenylephrine as eye drops. Backscattered light is shown in blue. (H) Increases in cytosolic Ca2+ levels in pericytes are evident in the zoomed images (upper panel, before; lower panel, 5 min after phenylephrine). (I) Trace (green) showing changes in cytosolic Ca2+ levels in islet pericytes in vivo before (left) and 5 min after application of phenylephrine (PE). Vertical dashed lines correspond to the 5 min period that the eye was exposed to eye drops before rinsing with imaging buffer. Values are expressed as ΔF/F. A sustained response to phenylephrine was observed in islet pericytes in vivo, which was similar to the response to adrenaline of islet pericytes in slices (gray trace shown behind the in vivo trace). Average traces ± SEM are shown (N = 3 pericytes in vivo and in slices). (J–L) In vivo imaging of NG2-GCaMP3 islet grafts in the eye before (upper panels) and 5 min after (lower panels) phenylephrine. Phenylephrine increased cytosolic Ca2+ levels in a pericyte (green) wrapping a constricting islet blood vessel (J). Arrows in (J), (K) and (L) point to constricting islet capillaries. Blood vessels were visualized with an i.v. of TRITC-dextran (red or grey) and islet tissue by backscatter (blue in J). (M) Quantification of changes in blood vessel diameter in the islet before and after phenylephrine (N = 16 capillaries from 5 islet grafts in 3 mice; paired t-test). (N) Quantification of the number of red blood cells, identified as black shadows in the vessel lumen, in different islet blood vessels before and after phenylephrine (N = 5 capillaries). Scale bars, 10 μm (A), 50 μm (G), 20 μm (H), and 10 μm (J, K, and L).

References

    1. Armulik A, Abramsson A, Betsholtz C. Endothelial/pericyte interactions. Circ Res. 2005;97:512–523. - PubMed
    1. Armulik A, Genove G, Betsholtz C. Pericytes: developmental, physiological, and pathological perspectives, problems, and promises. Dev Cell. 2011;21:193–215. - PubMed
    1. Atef N, Ktorza A, Picon L, Penicaud L. Increased islet blood flow in obese rats: role of the autonomic nervous system. Am J Physiol. 1992;262:E736–740. - PubMed
    1. Attwell D, Mishra A, Hall CN, O’Farrell FM, Dalkara T. What is a pericyte? J Cereb Blood Flow Metab. 2016;36:451–455. - PMC - PubMed
    1. Ballian N, Brunicardi FC. Islet vasculature as a regulator of endocrine pancreas function. World J Surg. 2007;31:705–714. - PubMed

Publication types

MeSH terms

LinkOut - more resources