. 2018 Mar 6;27(3):667-676.e4.
doi: 10.1016/j.cmet.2018.02.001.

Nicotinamide Improves Aspects of Healthspan, but Not Lifespan, in Mice

Affiliations

Nicotinamide Improves Aspects of Healthspan, but Not Lifespan, in Mice

Sarah J Mitchell et al. Cell Metab. .

Abstract

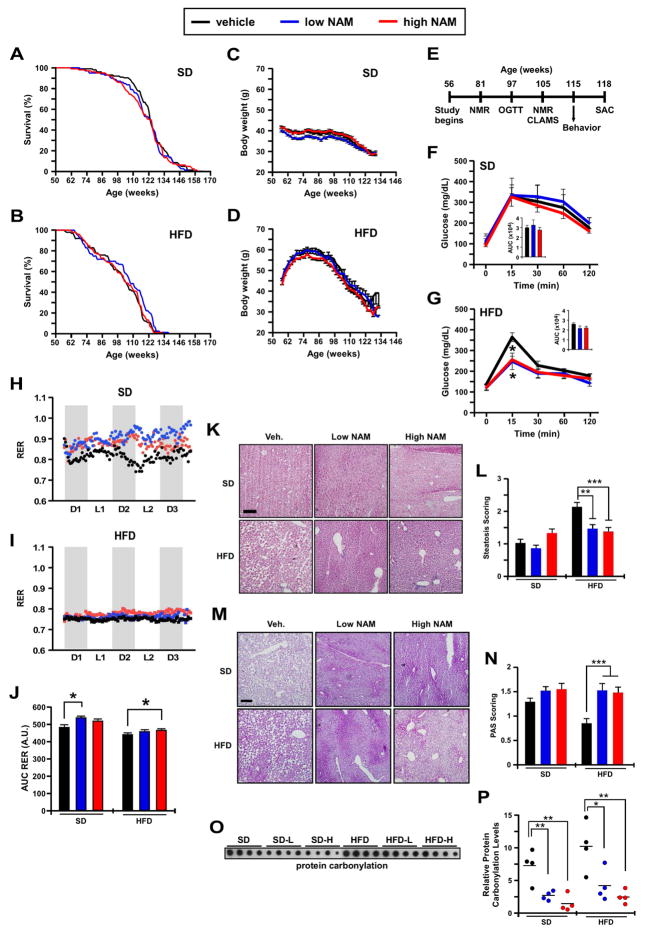
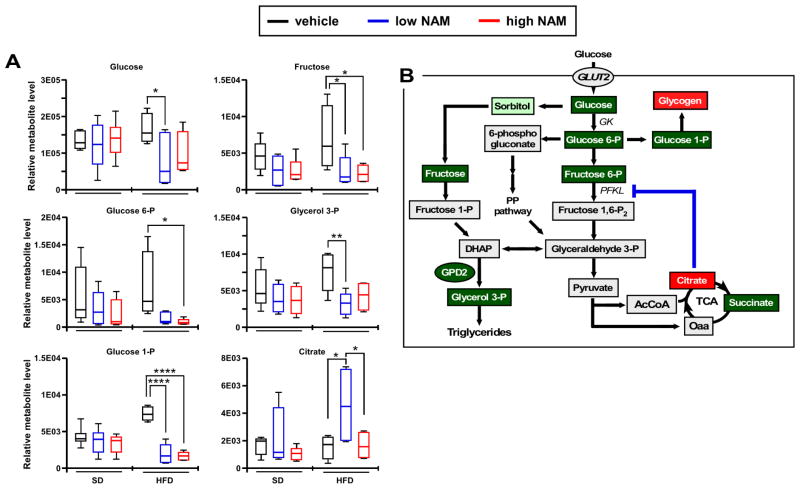
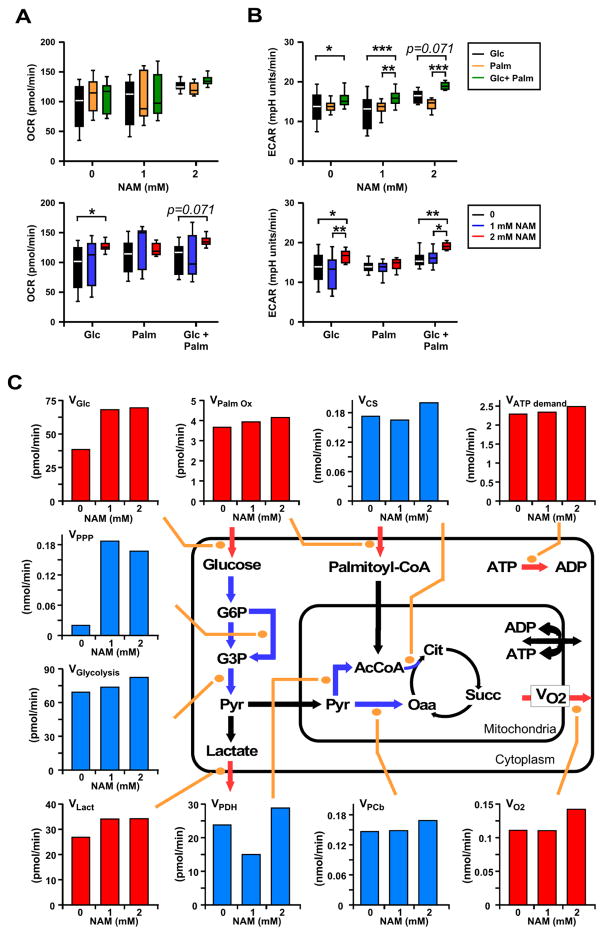
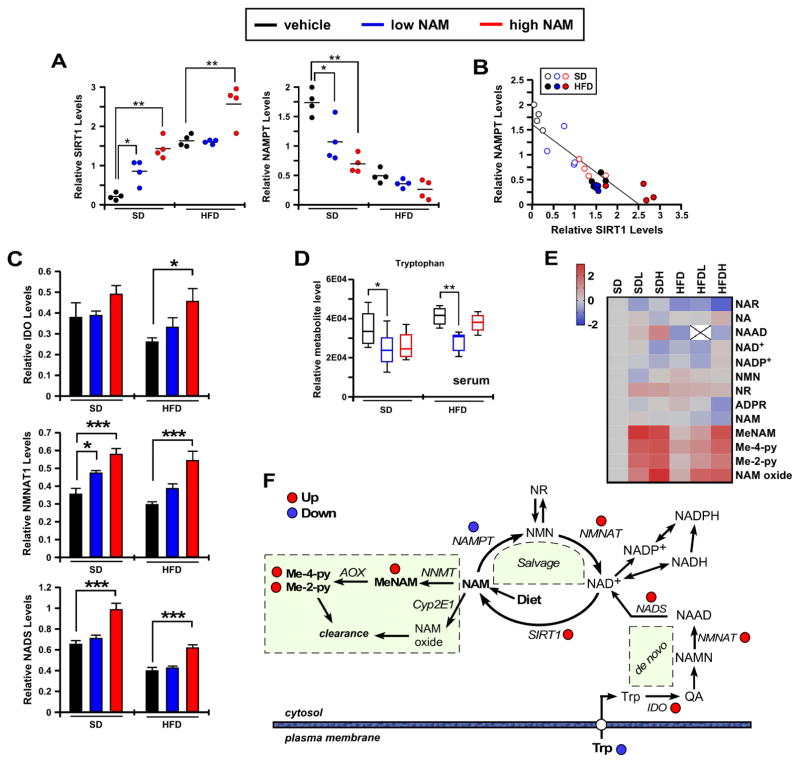
The role in longevity and healthspan of nicotinamide (NAM), the physiological precursor of NAD+, is elusive. Here, we report that chronic NAM supplementation improves healthspan measures in mice without extending lifespan. Untargeted metabolite profiling of the liver and metabolic flux analysis of liver-derived cells revealed NAM-mediated improvement in glucose homeostasis in mice on a high-fat diet (HFD) that was associated with reduced hepatic steatosis and inflammation concomitant with increased glycogen deposition and flux through the pentose phosphate and glycolytic pathways. Targeted NAD metabolome analysis in liver revealed depressed expression of NAM salvage in NAM-treated mice, an effect counteracted by higher expression of de novo NAD biosynthetic enzymes. Although neither hepatic NAD+ nor NADP+ was boosted by NAM, acetylation of some SIRT1 targets was enhanced by NAM supplementation in a diet- and NAM dose-dependent manner. Collectively, our results show health improvement in NAM-supplemented HFD-fed mice in the absence of survival effects.

Keywords: NAD; NAMPT; aging; calorie restriction mimetics; dietary interventions; geroscience; high-fat diet; nicotinamide; sirtuin.


Conflict of interest statement

DECLARATION of INTERESTS

J.L.E. is a former employee and a stockholder in GlaxoSmithKline (GSK), and a current SAB member of Metro Biotech. P.J.E. is a former employee of Sirtris, a GSK company. V.A.B. has a CRADA with ChromaDex. C.B. owns stock in ChromaDex and serves as a consultant to ChromaDex and Cytokinetics. AAS receives royalties on commercial sales of nicotinamide riboside from ChromaDex. AAS is also a consultant and co-founder of Metro MidAtlantic Biotech LLC. D.A.S. is a consultant, equity owner, and inventor on patents licensed to Life Biosciences, Metro International Biotech, Jumpstart Fertility, Liberty Biosecurity, Ovascience and GSK. The remaining authors declare no competing interests.

Figures

Figure 1
Figure 1. Nicotinamide (NAM) treatment alters whole-body physiology and in vivo metabolism without impacting maximum lifespan
(A) Kaplan-Meier survival curves for mice fed a standard diet (SD) or SD supplemented with low-dose or high-dose of NAM (n=100/group). (B) Kaplan-Meier survival curves for mice fed a high-fat diet (HFD) or HFD supplemented with either low-dose or high-dose of NAM (n=100/group). (C and D) Body weight trajectories over the course of the study. (E) Timetable for the measure of various outcomes during the treatment protocol. (F and G) Oral glucose tolerance test. Inset, Area under the curve (AUC) (n = 6/group). (H–J) After 49 weeks of treatment, mice were placed into metabolic cages to measure the respiratory exchange ratio (RER) as detailed in Experimental Procedures, n= 6/group. (K) H & E staining depicted steatosis as circular white gaps caused when the dehydration process leaches the fat out of fixed liver tissues. (L) The degree of steatosis was scored and represented as means ± SEM. (M) Periodic acid-Schiff staining (PAS) for the detection of polysaccharides (e.g., glycogen) in fixed liver tissues. (N) Semi-quantification of PAS staining and representation as mean ± SEM. (K, M) Scale bar, 100 μm. 100X final magnification. (O) Dot blot depicting protein carbonylation levels in the liver of the six experimental groups of mice (n=4/group). (P) Quantitative analysis after normalization to protein content. *p<0.05, **p<0.01, ***p<0.001 vs. control. (See also Figure S1).
Figure 2
Figure 2. Impact of NAM on hepatic metabolites profile in mice fed SD or HFD
(A) Metabolomics analysis illustrating the relative levels of glucose, fructose, glucose 6-phosphate, glucose 1-phosphate, glycerol 3-phosphate, and citrate (n=6/group; metabolites key: red, accumulated; green, depleted) (B) Diagram depicting the alteration in glycolytic metabolite concentrations in HFD livers in response to low NAM supplementation. The blockade of phosphofructokinase, liver type (PFKL) by citrate may account for the reduced formation of glyceraldehyde 3-phosphate, which is central in several metabolic pathways. The depletion in glucose 1-phosphate suggests active glycogen synthesis in response to NAM supplementation. All box plots represent 6 mice/group. *, p<0.05; **, p<0.01; ***, p<0.001; ****, p<0.0001. (See also Figure S2).
Figure 3
Figure 3. Metabolic measurements and metabolic flux analysis in HepG2 cells in the presence or absence of NAM
(A) Baseline oxygen consumption rate (OCR) and (B) extracellular acidification rate (ECAR) were monitored in the presence of 1 mM glucose and 100 nM insulin along with the NAM levels that were used during the overnight preincubation period (0, 1, or 2 mM). The values shown were determined after addition of either 4 mM glucose (Glc, final 5 mM), 200 μM palmitate (Palm, in a 4:1 ratio with fatty acid-free BSA), or the combination of both substrates (Glc+Palm). Two-way ANOVA tests examined the influence of each independent variable (NAM concentration and type of substrate utilization), and provided evidence of interaction between them. *, **, *** P < 0.05, 0.01, and 0.001, respectively. (C) Effect of NAM on experimental and estimated fluxes through main glucose and lipid catabolic pathways. Depicted is an aggregate version of the metabolic pathways involved in the catabolism of glucose and palmitate that accounts only for stoichiometric information and includes glucose uptake and glycogen degradation (omitted in the scheme for the sake of simplicity), lactate generation and efflux, and pyruvate (Pyr) uptake into mitochondria. Mitochondrial acetyl CoA (AcCoA) may be derived from either pyruvate dehydrogenase (PDH) activity or from β-oxidation of palmitoyl-CoA whereas pyruvate may be carboxylated into oxaloacetate (Oaa) by pyruvate carboxylase (PCb). Because at steady state this reaction replenishes the TCA cycle, the PCb flux is equivalent to the citrate efflux from mitochondria. On the other hand, the flux of Pyr decarboxylation through PDH is equivalent to that through the TCA cycle from citrate to Oaa, while the flux through citrate synthase (CS) is the sum of the two, i.e. PDH + PCb. See Experimental Procedures for additional information. Red bars, measured values; blue bars, estimated values; all fluxes in nmol/min or pmol/min depicted in panels A–C were normalized to 1.6 × 10⁴ cells, i.e., nmol/min/1.6 × 104 cells or pmol/min/1.6 × 104 cells.
Figure 4
Figure 4. Impact of NAM supplementation on hepatic NAD+ metabolome and the NAMPT-NAD-SIRT1 pathway
(A) Scatter plots depicting densitometric analysis after normalization of SIRT1 and NAMPT immunoblots to Ponceau S staining of the membrane, n=4/group. (B) Scatter plot displaying the association between NAMPT and SIRT1 protein expression. (C) Densitometric analysis after normalization of IDO, NMNAT1 and NADS immunoblots to Ponceau S staining of the membrane. Bars represent the average ± SEM (n=6). (D) Histograms show the relative tryptophan levels in serum metabolome. *, p<0.05; **, p<0.01; ***, p<0.001. (E) Heatmap illustrates the log2(fold change) values of 13 metabolites from the NAD-related pathway analysis that was evaluated after data normalization with median fold change in each group. (F) Diagram depicting the effect of dietary supplementation of NAM on the liver NAD+ biosynthetic, salvage, and catabolic pathways. Abbreviations: AOX, aldehyde oxidase 1; IDO, indoleamine-pyrrole 2,3-dioxygenase 1; Me-2-py, N-methyl-2-pyridone-5-carboxamide; Me-4-py, N-methyl-4-pyridone-5-carboxamide; MeNAM, methylnicotinamide; NAAD, nicotinic acid adenine dinucleotide; NAD+/NADH, oxidized/reduced nicotinamide adenine dinucleotide; NADP+/NADPH, oxidized/reduced nicotinamide adenine dinucleotide phosphate; NADS, nicotinamide adenine dinucleotide synthase; NAM, nicotinamide; NAMN, nicotinic acid mononucleotide; NAMPT, nicotinamide phosphoribosyltransferase; NMN, nicotinamide mononucleotide; NMNAT, nicotinamide/nicotinic acid mononucleotide adenyltransferase; NNMT, NAM N-methyltransferase; NR, nicotinamide riboside; QA, quinolinic acid; SIRT1, sirtuin 1; Trp, tryptophan. (See also Figures S3, S4).

References

    1. Bogan KL, Brenner C. Nicotinic acid, nicotinamide, and nicotinamide riboside: a molecular evaluation of NAD+ precursor vitamins in human nutrition. Annu Rev Nutr. 2008;28:115–130. - PubMed
    1. Trammell SA, Schmidt MS, Weidemann BJ, Redpath P, Jaksch F, Dellinger RW, Li Z, Abel ED, Migaud ME, Brenner C. Nicotinamide riboside is uniquely and orally bioavailable in mice and humans. Nat Commun. 2016a;7:12948. - PMC - PubMed
    1. Bieganowski P, Brenner C. Discoveries of nicotinamide riboside as a nutrient and conserved NRK genes establish a Preiss-Handler independent route to NAD+ in fungi and humans. Cell. 2004;117:495–502. - PubMed
    1. Belenky P, Racette FG, Bogan KL, McClure JM, Smith JS, Brenner C. Nicotinamide riboside promotes Sir2 silencing and extends lifespan via Nrk and Urh1/Pnp1/Meu1 pathways to NAD+ Cell. 2007a;129:473–484. - PubMed
    1. Bitterman KJ, Anderson RM, Cohen HY, Latorre-Esteves M, Sinclair DA. Inhibition of silencing and accelerated aging by nicotinamide, a putative negative regulator of yeast sir2 and human SIRT1. J Biol Chem. 2002;277:45099–45107. - PubMed

Publication types