. 2018 Mar 6;22(10):2654-2666.
doi: 10.1016/j.celrep.2018.02.051.

An Essential Role for ECSIT in Mitochondrial Complex I Assembly and Mitophagy in Macrophages

Affiliations

An Essential Role for ECSIT in Mitochondrial Complex I Assembly and Mitophagy in Macrophages

Flávia R G Carneiro et al. Cell Rep. .

Abstract

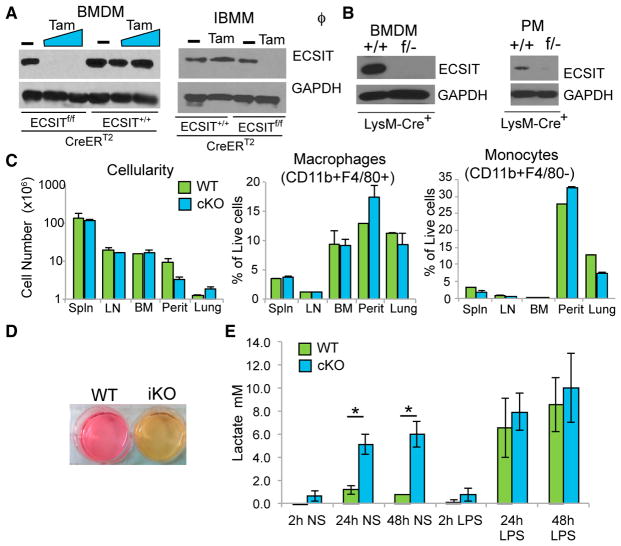
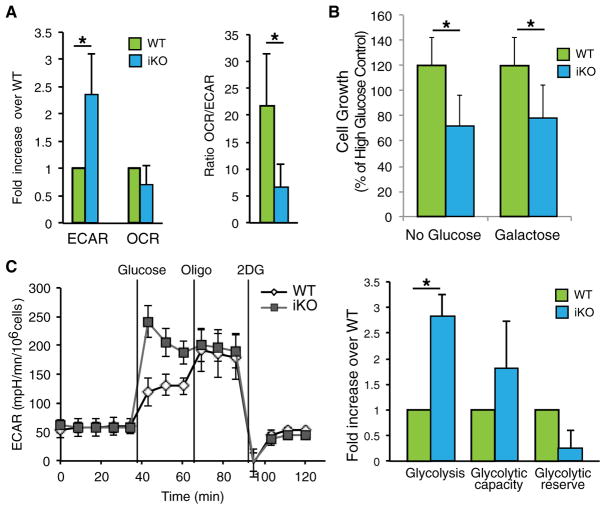
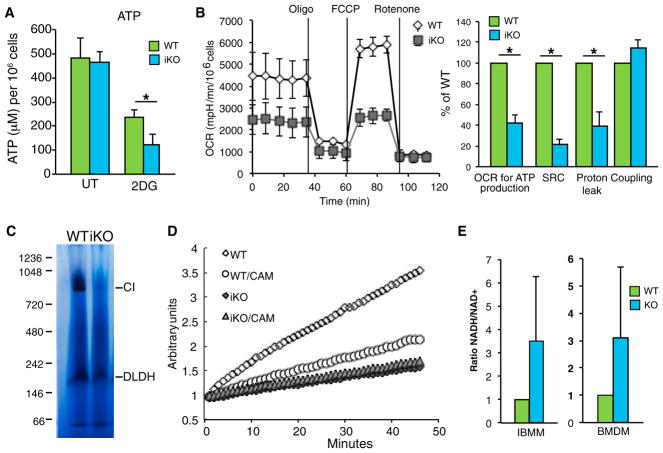
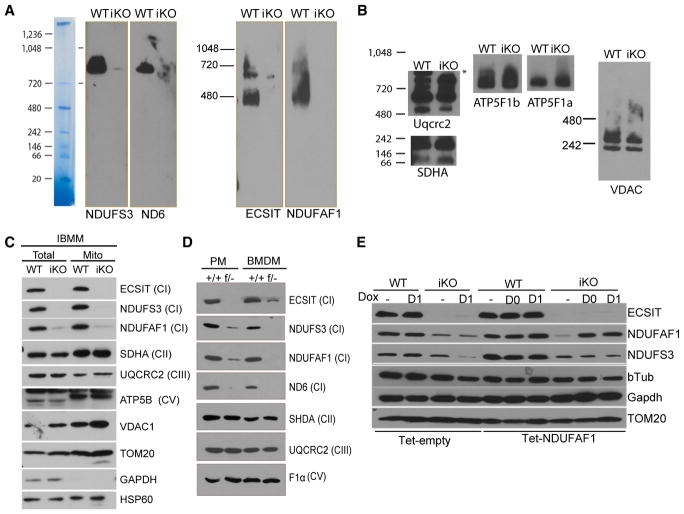
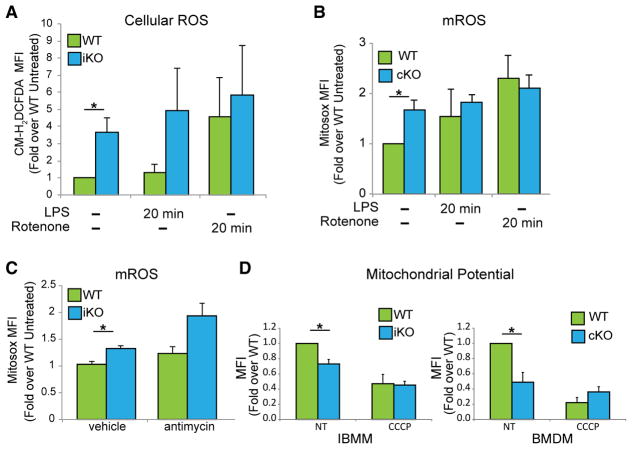
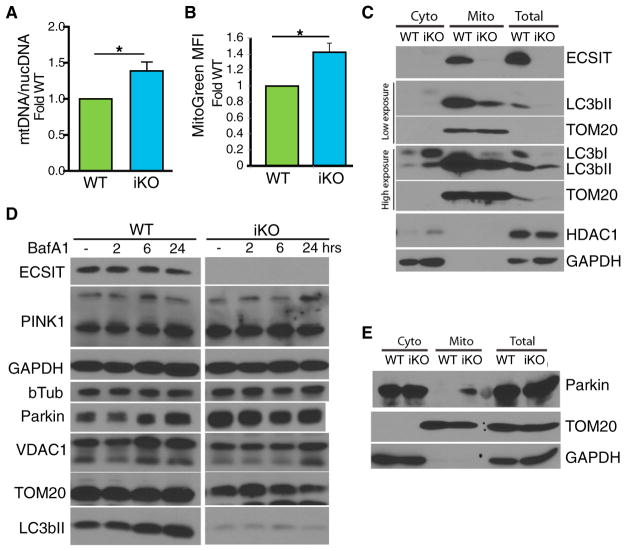
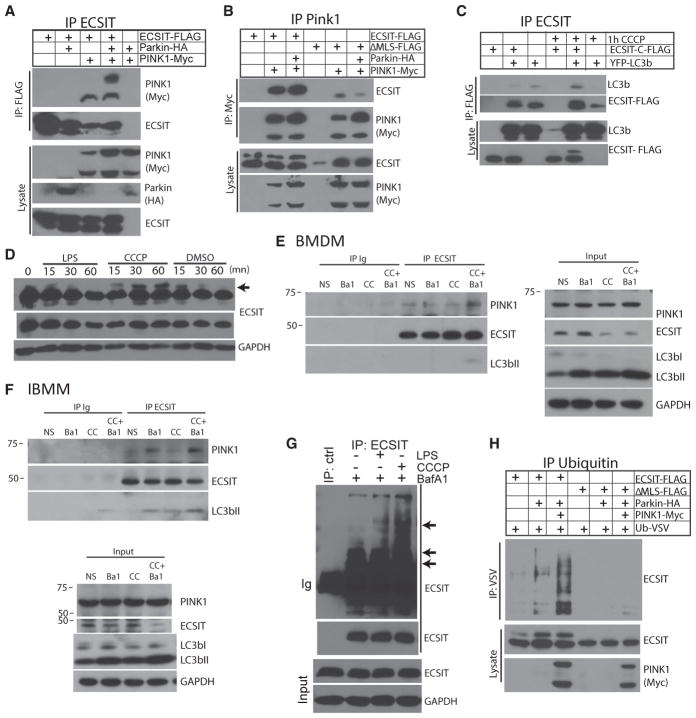
ECSIT is a mitochondrial complex I (CI)-associated protein that has been shown to regulate the production of mitochondrial reactive oxygen species (mROS) following engagement of Toll-like receptors (TLRs). We have generated an Ecsit conditional knockout (CKO) mouse strain to study the in vivo role of ECSIT. ECSIT deletion results in profound alteration of macrophage metabolism, leading to a striking shift to reliance on glycolysis, complete disruption of CI activity, and loss of the CI holoenzyme and multiple subassemblies. An increase in constitutive mROS production in ECSIT-deleted macrophages prevents further TLR-induced mROS production. Surprisingly, ECSIT-deleted cells accumulate damaged mitochondria because of defective mitophagy. ECSIT associates with the mitophagy regulator PINK1 and exhibits Parkin-dependent ubiquitination. However, upon ECSIT deletion, we observed increased mitochondrial Parkin without the expected increase in mitophagy. Taken together, these results demonstrate a key role of ECSIT in CI function, mROS production, and mitophagy-dependent mitochondrial quality control.

Keywords: ROS; complex I; glycolytic switch; mROS; macrophages; mitophagy; oxidative stress.


Conflict of interest statement

DECLARATION OF INTERESTS

The authors declare no competing interests.

Figures

Figure 1
Figure 1. Conditional Deletion of ECSIT in Macrophages Leads to Metabolic Alterations
(A) Immunoblotting for ECSIT in lysates from ECSIT+/+/Cre-ERT2+ and ECSITf/f/Cre-ERT2+ bone-marrow-derived macrophages (BMDMs) 7 days after deletion induction with tamoxifen (Tam) or vehicle (−) (left) and ECSITf/f/Cre-ERT2+ immortalized BMDMs (iBMMs) treated with vehicle (WT) or tamoxifen (iKO) for 48 hr and cultured for 5 days (right). For subsequent figures, IBMMs were assessed 5–12 days after induction of deletion. (B) ECSIT levels in ECSIT+/+/LysM-Cre+ (WT) and ECSITf/−/LysM-Cre+ (cKO) BMDMs and peritoneal macrophages (PMs). (C) Cellularity and proportion in live cells of macrophages (CD11b+ F4/80+) and monocytes (CD11b+ F4/80−) from the spleen (Spln), lymph nodes (LNs), bone marrow (BM), peritoneal cavity (Perit), and lungs of WT and cKO mice (n = 3). (D) Phenol red-containing cell culture media from ECSIT iKO and WT IBMMs. (E) Lactate in supernatants from WT or cKO BMDMs, unstimulated (NS) or LPS-stimulated (100 ng/mL) (n = 2). Shown are means ± SD of n experiments. *p < 0.05 in t test. See also Figure S1.
Figure 2
Figure 2. Increased Glycolysis in ECSIT-Deleted Macrophages
(A) Extracellular acidification rate (ECAR) and oxygen consumption rate (OCR) measured in WT and iKO cells (left) and OCR/ECAR ratio (right) (n = 3). (B) Cell growth measured by crystal violet staining of IBMMs maintained for 48 hr in DMEM without glucose with or without galactose, 5 days after deletion induction (n = 5). (C) The ECAR was assessed after addition of glucose, oligomycin (oligo), and 2-deoxyglucose (2DG). Left: time course of a representative experiment. Right: determination of glycolysis rate, glycolytic capacity, and glycolytic reserve (n = 2). Means ± SD of n experiments are shown. *p < 0.05 in t test. See also Figures S2 and S3.
Figure 3
Figure 3. Loss of CI Activity in the Absence of ECSIT
(A) ATP levels in iKO and WT IBMMs left untreated (UT) or treated with 50 mM 2DG for 4 hr (n = 3). (B) OCR in iKO and WT IBMMs, measured after addition of oligomycin, FCCP, and rotenone. Left: time course of a representative experiment. Right: determination of the OCR used for ATP production. SRC, spare respiratory capacity, OCR because of proton leak, and coupling efficiency (n = 2). (C) CI in-gel activity of mitochondrial complexes from WT and iKO IBMMs; shown is a representative experiment (n = 3). DLDH, dihydrolipoamide dehydrogenase. (D) CI activity in WT and iKO IBMM mitochondria; CAM, chloramphenicol; shown is a representative experiment (n = 3). (E) NADH/NAD+ ratio in lysates of iKO IBMMs (n = 2) and cKO BMDMs (n = 3) compared with WT cells. Shown are means ± SD of n experiments. *p < 0.05 in t test.
Figure 4
Figure 4. Loss of CI Proteins in ECSIT-Deleted Macrophages
(A and B) BN-PAGE followed by western blot of mitochondrial complexes from WT and iKO IBMMs detected with the indicated proteins from (A) complex I and (B) complexes II, III, V, and VDAC1. (C and D) Immunoblot of OXPHOS proteins in (C) mitochondrial preparation and total cell lysates of IBMM and (D) total cell lysate of BMDM and PMs. (E) Immunoblotting of IBMMs transduced with doxycycline-inducible NDUFAF1 (Tet-NDUFAF1) or control (Tet-Empty) and treated with tamoxifen on day 0 and day 1 to induce ECSIT deletion and doxycyclin (Dox) every 24 hr from day 0 or day 1 until analysis on day 3. Shown are representative experiments (n = 3). See also Figure S4.
Figure 5
Figure 5. Mitochondrial Dysfunction in Cells Lacking ECSIT
(A) IBMMs stimulated with rotenone (1 μM) and LPS (100 ng/mL) for 20 min 7 days after deletion induction, stained with chloromethyl derivative of H2DCFDA (2′,7′-dichlorodihydrofluorescein diacetate) (CM-H2DCFDA) and analyzed by flow cytometry for total ROS (n = 3). (B) BMDMs stimulated with rotenone and LPS for 20 min, stained with MitoSOX, and analyzed by flow cytometry for mROS (n = 3). (C) IBMMs stimulated with antimycin A (5 μM) for 20 min and analyzed for mROS like in (B) (n = 3). (D) Δψm measured by flow cytometry using tetra-methylrhodamine, methyl ester (TMRM) in IBMMs and BMDMs, in the absence (non treated, NT) or presence of CCCP for 1 h (30 μM) (n = 3). Shown are means ± SD of n experiments. *p < 0.05 in t test. See also Figure S5.
Figure 6
Figure 6. Altered Mitophagy in ECSIT-Deleted Macrophages
(A) Ratio of mitochondrial DNA (mtDNA) over nuclear DNA (nucDNA) copies, determined by qPCR in IBMMs 7 days after deletion induction (n = 4). (B) IBMMs stained with mitotracker green and analyzed by flow cytometry (n = 4). (A and B) Fold change over WT. Shown are means ± SEM of n experiments. *p < 0.05 in t test. (C and E) Western blot analysis of (C) LC3b and (E) Parkin in total lysate, isolated mitochondria, and cytosol of WT and iKO IBMM (representative experiment of n = 3). (D) Western blot analysis of cellular lysates of WT and iKO IBMMs treated with 5 nM BafA1 (representative experiment of n = 3).
Figure 7
Figure 7. ECSIT Interacts with Mitophagy Regulators
(A and B) Coimmunoprecipitation (coIP) of (A) PINK1 with ECSIT and (B) ECSIT with PINK1 and western blot analysis of immunoprecipitated proteins and input lysate after overexpression in 293FT cells (ΔMLS, ECSIT lacking the MLS). (C) CoIP of LC3b with ECSIT and western blot after overexpression in 293FT cells with or without CCCP for 1 hr (30 μM). (D) Western blot analysis of ECSIT in lysates of WT IBMMs treated with LPS (100 ng/mL), CCCP (30 μM), or vehicle (DMSO) for the indicated times. (E and F) Western blot analysis of proteins coimmunoprecipitated with anti-ECSIT or control antibody (immunoglobulin heavy chain [Ig]) in lysates of WT BMDMs (E) or IBMMs (F) treated with 10 nM Bafilomycin A1 (Ba1) for 5 hr and/or 20 μM of CCCP (CC) for 1 hr. (G) IP of ECSIT and control IP (ctrl) and western blot analysis of immunoprecipitated ECSIT (top, long exposure; bottom, short exposure) and input lysate in WT IBMMs treated with LPS (100 ng/mL), CCCP (30 μM), BafA1 (10 nM), or vehicle (−) for 1 hr. (H) IP of ubiquitinated proteins and western blot analysis for ECSIT after overexpression of ECSIT, Parkin, PINK1, and VSV-tagged ubiquitin in 293FT.

References

    1. Alston CL, Compton AG, Formosa LE, Strecker V, Oláhová M, Haack TB, Smet J, Stouffs K, Diakumis P, Ciara E, et al. Biallelic Mutations in TMEM126B Cause Severe Complex I Deficiency with a Variable Clinical Phenotype. Am J Hum Genet. 2016;99:217–227. - PMC - PubMed
    1. Andrews B, Carroll J, Ding S, Fearnley IM, Walker JE. Assembly factors for the membrane arm of human complex I. Proc Natl Acad Sci USA. 2013;110:18934–18939. - PMC - PubMed
    1. Arlt H, Tauer R, Feldmann H, Neupert W, Langer T. The YTA10–12 complex, an AAA protease with chaperone-like activity in the inner membrane of mitochondria. Cell. 1996;85:875–885. - PubMed
    1. Ashrafi G, Schwarz TL. The pathways of mitophagy for quality control and clearance of mitochondria. Cell Death Differ. 2013;20:31–42. - PMC - PubMed
    1. Baertling F, Sánchez-Caballero L, van den Brand MAM, Wintjes LT, Brink M, van den Brandt FA, Wilson C, Rodenburg RJT, Nijtmans LGJ. NDUFAF4 variants are associated with Leigh syndrome and cause a specific mitochondrial complex I assembly defect. Eur J Hum Genet. 2017;25:1273–1277. - PMC - PubMed

Publication types