. 2018 Mar 6;22(10):2667-2676.
doi: 10.1016/j.celrep.2018.02.032.

α Cell Function and Gene Expression Are Compromised in Type 1 Diabetes

Affiliations

α Cell Function and Gene Expression Are Compromised in Type 1 Diabetes

Marcela Brissova et al. Cell Rep. .

Abstract

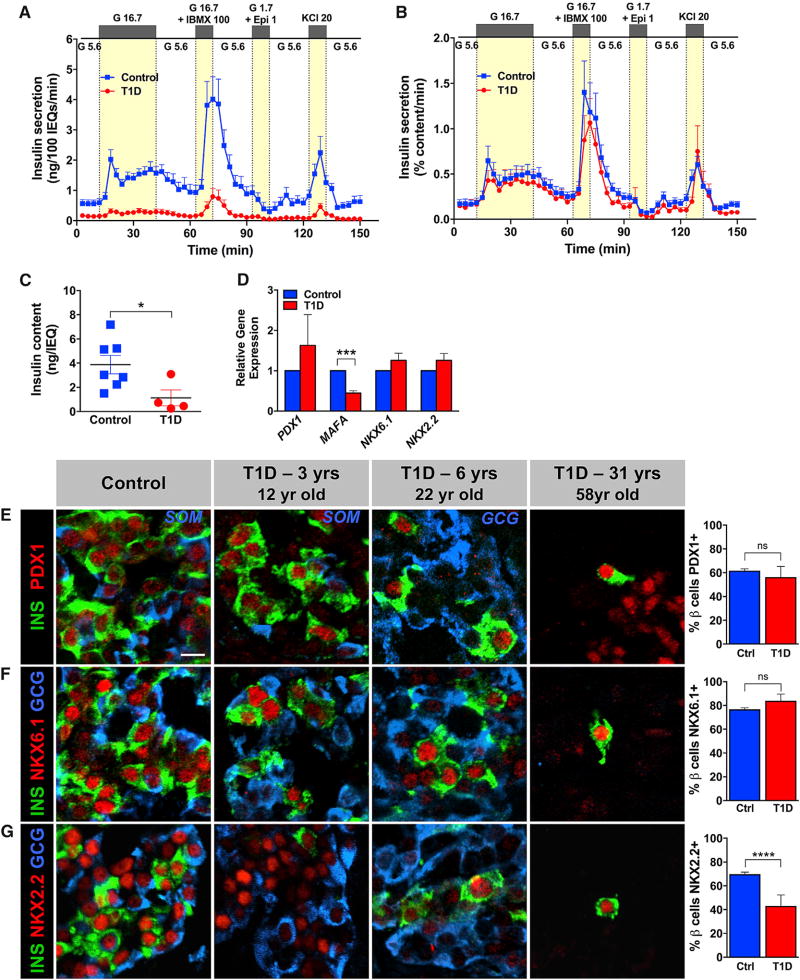
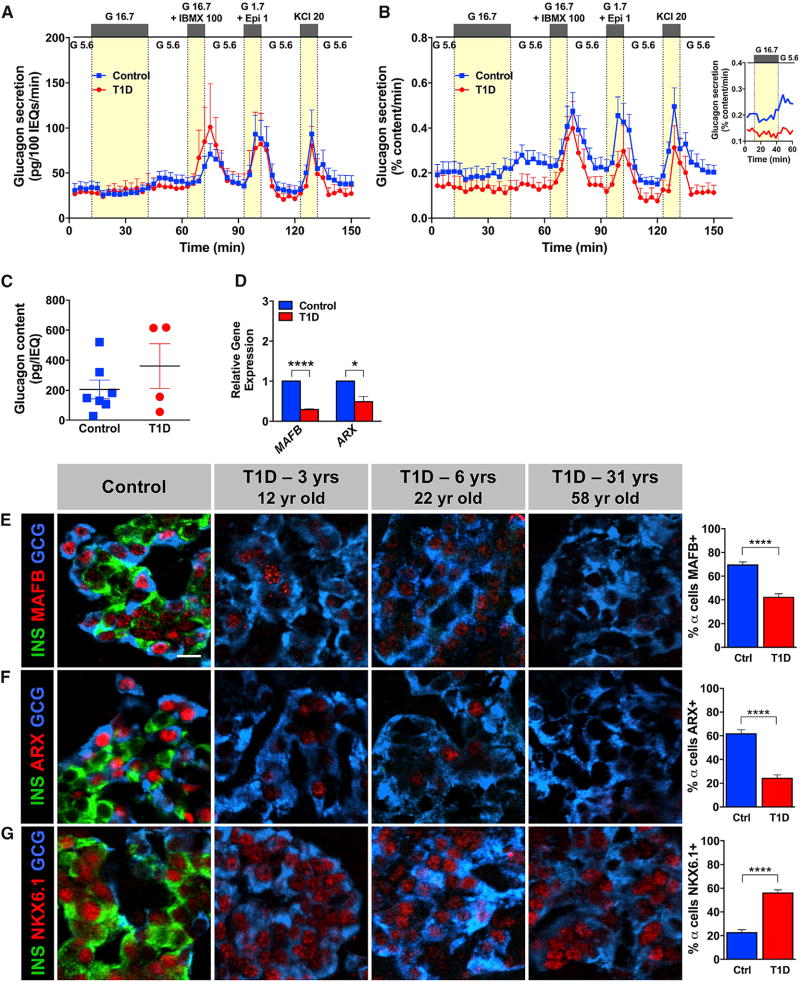
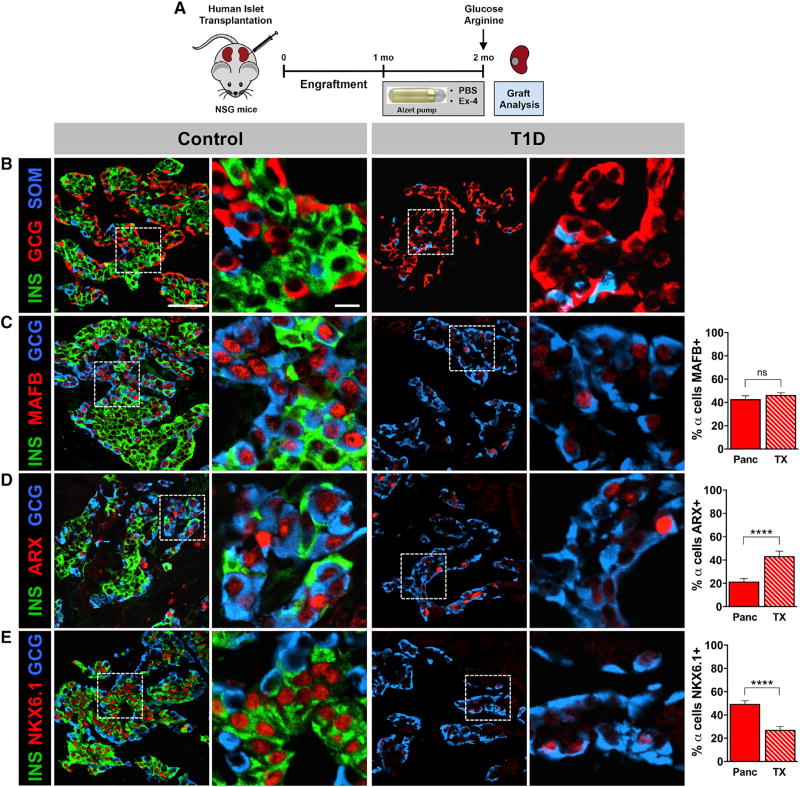
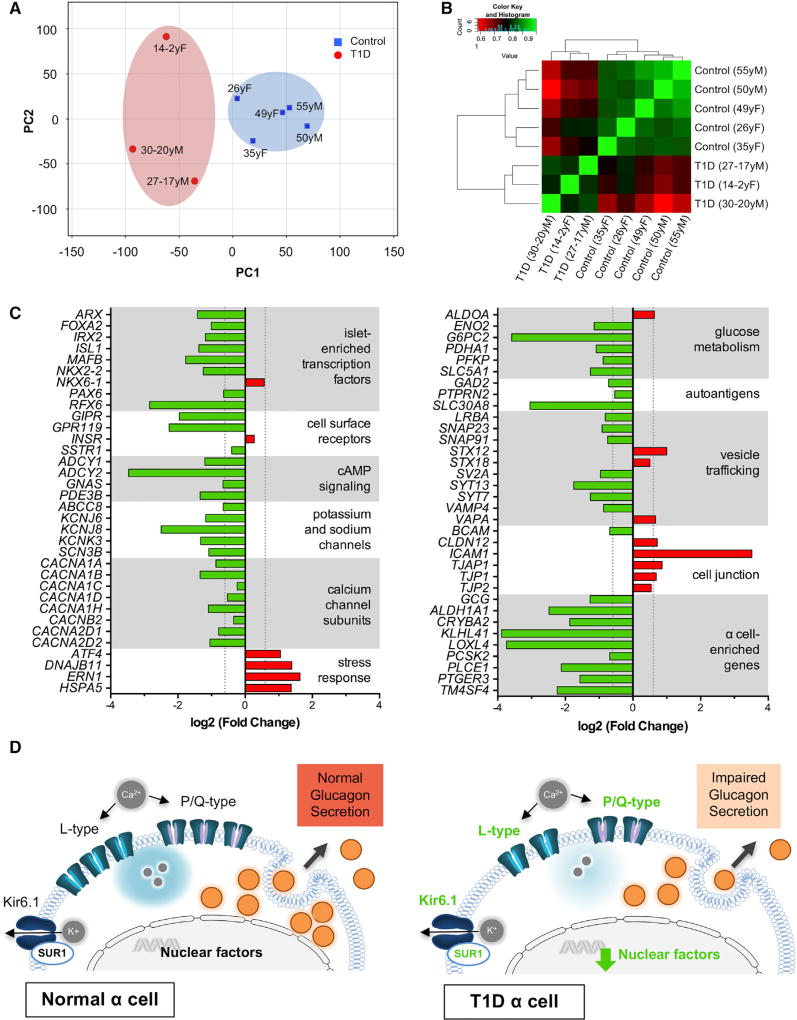
Many patients with type 1 diabetes (T1D) have residual β cells producing small amounts of C-peptide long after disease onset but develop an inadequate glucagon response to hypoglycemia following T1D diagnosis. The features of these residual β cells and α cells in the islet endocrine compartment are largely unknown, due to the difficulty of comprehensive investigation. By studying the T1D pancreas and isolated islets, we show that remnant β cells appeared to maintain several aspects of regulated insulin secretion. However, the function of T1D α cells was markedly reduced, and these cells had alterations in transcription factors constituting α and β cell identity. In the native pancreas and after placing the T1D islets into a non-autoimmune, normoglycemic in vivo environment, there was no evidence of α-to-β cell conversion. These results suggest an explanation for the disordered T1D counterregulatory glucagon response to hypoglycemia.

Keywords: alpha cells; glucagon; human; insulin; pancreatic islet; type 1 diabetes.


Figures

Figure 1
Figure 1. T1D β Cells in Recent-Onset T1D Retain Secretory Properties and Gene Expression Pattern Similar to Normal β Cells
(A and B) Insulin secretion was assessed in islets isolated from donors with recent-onset T1D (n = 4; ages 12–22 years; donors nos. 1, 3, 4, and 5) and compared to normal controls (n = 7; ages 7–21 years); G 5.6–5.6 mM glucose, G 16.7–16.7 mM glucose, G 16.7 + IBMX 100–16.7 mM glucose + 100 µM isobutylmethylxanthine (IBMX), G 1.7 + Epi 1–1.7 mM glucose + 1 µM epinephrine, KCl 20–20 mM potassium chloride. (A) Insulin secretion normalized to overall islet cell volume (expressed as islet equivalents [IEQs]); ****p < 0.0001. (B) Insulin secretion normalized to islet insulin content; ***p = 0.0005. Data in (A) and (B) were compared by two-way ANOVA. (C) Insulin content of control (3.873 ± 0.763 ng/IEQ) and T1D islets (1.131 ± 0.660 ng/IEQ); p = 0.0394; data are represented as mean ± SEM. (D) Expression of β-cell-enriched transcription factors by qRT-PCR in whole T1D islets (n = 3 donors; ages 12–22 years; donors nos. 1, 4, and 5) and controls (n = 3 donors; ages 11–29 years) was normalized to endogenous control and INS expression; ***p < 0.0007. (E–G) Expression of β-cell-enriched transcription factors in the native pancreatic tissue from donors with recent-onset T1D (n = 2; ages 12–22 years; donors nos. 1 and 5) was compared to 58-year-old donor with 31 years of T1D duration (donor no. 8) and controls (n = 7; ages 8–55 years). The pancreas of 58-year-old T1D donor did not have any insulin+ islets; only rare β cells were found in exocrine parenchyma. T1D β cells (n = 3 donors; ages 12–58 years; donors nos. 1, 5, and 8) had normal expression of β-cell-enriched transcription factors PDX1 (E) and NKX6.1 (F) but decreased expression of NKX2.2 (G) compared to controls (n = 7 donors; ages 8–55 years); ****p < 0.0001; ns, not significant. Data in (C)–(G) were compared by two-tailed Student’s t test. Data in (A)–(G) are shown as mean ± SEM. The scale bar in (E) represents 10 µm and also corresponds to (F) and (G). See also Figures S1 and S2.
Figure 2
Figure 2. T1D α Cells in Recent-Onset T1D Have Reduced Glucagon Secretion and Dysregulated Gene Expression
The same sets of islets shown in Figures 1A and 1B were simultaneously analyzed for glucagon secretion. The same non-diabetic controls were used as Figure 1. The labeling of islet stimuli is identical to that in Figure 1. (A) Glucagon secretion normalized to overall islet cell volume (expressed as IEQs); p = 0.2470. (B) Glucagon secretion normalized to islet glucagon content; ****p < 0.0001. Data in (A) and (B) were compared by two-way ANOVA. Inset shows mean glucagon response to low glucose following the 30-min inhibition with high glucose. (C) Glucagon content in control (206 ± 62 pg/IEQ) and T1D islets (362 ± 149 pg/IEQ); p = 0.2831; data are represented as mean ± SEM. (D) Expression of α-cell-enriched factors by qRT-PCR in whole T1D islets (n = 3 donors; ages 12–22 years; donors nos. 1, 4, and 5) and controls (n = 3 donors; ages 11–29 years) was normalized to endogenous control and GCG expression; ****p < 0.0001; *p = 0.0184. (E–G) Analysis of native pancreatic tissue for expression of islet-enriched transcription factors. T1D α cells (n = 4 donors; ages 12–58 years; donors nos. 1, 2, 5, and 8) expressed β cell marker NKX6.1 (G) and lost bona fide α cell markers MAFB (E) and ARX (F) in most T1D α cells compared to controls (n = 7 donors; ages 8–55 years); ****p < 0.0001. Data in (C)–(G) were compared by two-tailed Student’s t test. Data in (A)–(G) are shown as mean ± SEM. The scale bar in (E) represents 10 µm and also corresponds to (F) and (G). See also Figures S1 and S3.
Figure 3
Figure 3. T1D α Cells Do Not Show Evidence of α-to-β Cell Reprogramming in Normoglycemic, Non-autoimmune Environment
(A) Islets from donors with recent-onset and long-standing T1D (n = 3 donors; 12–58 years; donors nos. 1, 5, and 8) depicted in Figures 1 and 2 were transplanted into NSG mice. After 1-month engraftment, mice were treated with either PBS or Ex-4 for an additional 1 month. Representative images of islet grafts are from the 12-year-old individual with 3-year T1D duration (donor no. 1). In control and T1D columns, regions denoted by the dashed line in images on the left (B)–(E) (scale bar in B is 50 µm) are displayed on the right (scale bar is 10 µm). (B) Insulin (INS) and glucagon (GCG) double-positive cells were not detected in either type of T1D islet grafts (PBS or Ex-4). (C–E) As there were no phenotypic differences between PBS and Ex-4 treatment groups, representative images were taken from both cohorts and analyzed for α cell transcription factor expression. Change in number of GCG+ cells expressing MAFB (C), ARX (D), and NKX6.1 (E) in transplanted T1D islets (TX) relative to donor’s native pancreas (Panc) is shown. ****p < 0.0001; ns, not significant. Data in (C)–(E) are shown as mean ± SEM and were compared by two-tailed Student’s t test.
Figure 4
Figure 4. Genes Critical to α Cell Function Are Differentially Expressed in T1D α Cells
Transcriptome by RNA-sequencing analysis of purified human α cells from T1D donors (n = 3; ages 14–30 years; donors nos. 3, 6, and 7) and controls (n = 5; ages 26–55 years). (A) Principal-component analysis (PCA) plot shows clustering of α cell samples from control and T1D donors. (B) Heatmap of the pairwise correlation between all samples based on the Spearman correlation coefficient. Perfect correlation is indicated by 1. (C) Genes associated with α cell identity and function are significantly downregulated in the T1D α cells with increased expression of stress response factors and cell-cell contact proteins. Vertical dotted lines represent point of significance for fold change (FC) = 1.53 threshold analysis; p < 0.05 for all values shown. (D) Proposed model for disrupted glucagon secretion in T1D α cells. Normal α cell function is maintained by islet-enriched transcription factors, which regulate α cell machinery necessary for glucagon synthesis and secretion (left panel). Altered expression of transcription factors likely leads to reduced α cell glucagon production, disrupted calcium signaling, and electrical activity that results in impaired glucagon secretion (right panel; green font indicates downregulation). See also data in Figure S4 and Tables S3 and S4.

References

    1. Alkorta-Aranburu G, Sukhanova M, Carmody D, Hoffman T, Wysinger L, Keller-Ramey J, Li Z, Johnson AK, Kobiernicki F, Botes S, et al. Improved molecular diagnosis of patients with neonatal diabetes using a combined next-generation sequencing and MS-MLPA approach. J. Pediatr. Endocrinol. Metab. 2016;29:523–531. - PubMed
    1. Balamurugan AN, Chang Y, Fung JJ, Trucco M, Bottino R. Flexible management of enzymatic digestion improves human islet isolation outcome from sub-optimal donor pancreata. Am. J. Transplant. 2003;3:1135–1142. - PubMed
    1. Blodgett DM, Nowosielska A, Afik S, Pechhold S, Cura AJ, Kennedy NJ, Kim S, Kucukural A, Davis RJ, Kent SC, et al. Novel observations from next-generation RNA sequencing of highly purified human adult and fetal islet cell subsets. Diabetes. 2015;64:3172–3181. - PMC - PubMed
    1. Bolli G, de Feo P, Compagnucci P, Cartechini MG, Angeletti G, Santeusanio F, Brunetti P, Gerich JE. Abnormal glucose counterregulation in insulin-dependent diabetes mellitus. Interaction of anti-insulin antibodies and impaired glucagon and epinephrine secretion. Diabetes. 1983;32:134–141. - PubMed
    1. Brissova M, Aamodt K, Brahmachary P, Prasad N, Hong J-Y, Dai C, Mellati M, Shostak A, Poffenberger G, Aramandla R, et al. Islet microenvironment, modulated by vascular endothelial growth factor-A signaling, promotes β cell regeneration. Cell Metab. 2014;19:498–511. - PMC - PubMed

Publication types

MeSH terms