

Delayed Sputum Culture Conversion in Tuberculosis-Human Immunodeficiency Virus-Coinfected Patients With Low Isoniazid and Rifampicin Concentrations
- PMID: 29514175
- PMCID: PMC6094003
- DOI: 10.1093/cid/ciy179
Delayed Sputum Culture Conversion in Tuberculosis-Human Immunodeficiency Virus-Coinfected Patients With Low Isoniazid and Rifampicin Concentrations
Abstract
Background: The relationship between concentrations of antituberculosis drugs, sputum culture conversion, and treatment outcome remains unclear. We sought to determine the association between antituberculosis drug concentrations and sputum conversion among patients coinfected with tuberculosis and human immunodeficiency virus (HIV) and receiving first-line antituberculosis drugs.
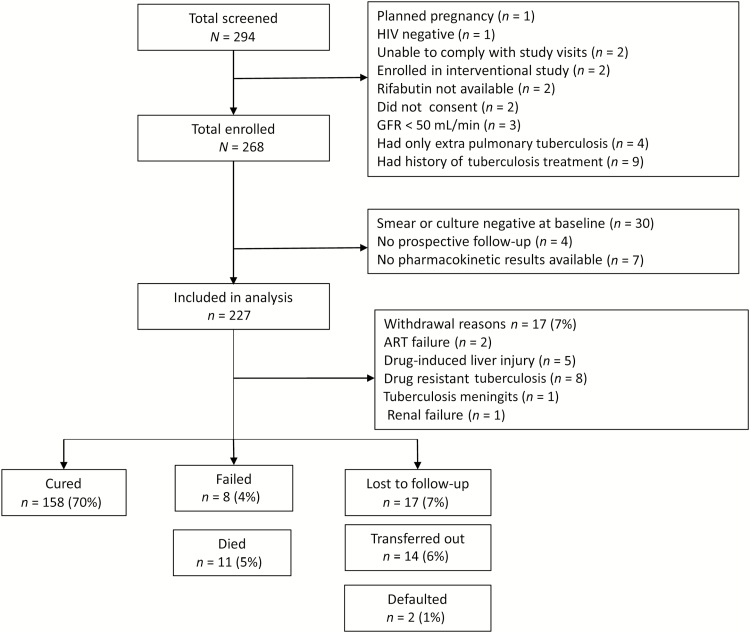
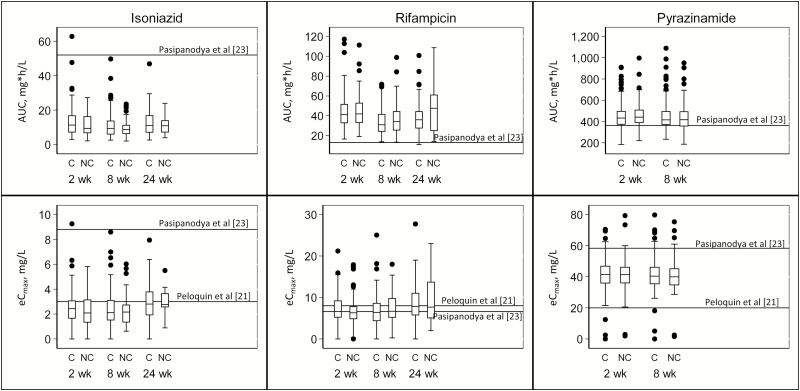
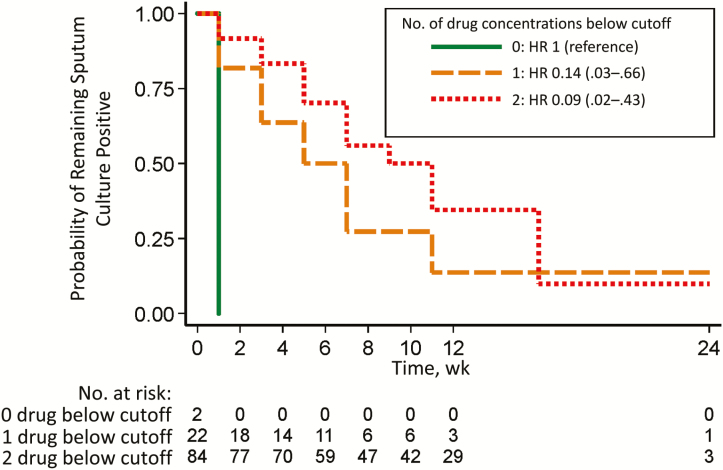
Methods: We enrolled HIV-infected Ugandans with pulmonary tuberculosis. Estimation of first-line antituberculosis drug concentrations was performed 1, 2, and 4 hours after drug intake at 2, 8, and 24 weeks of tuberculosis treatment. Serial sputum cultures were performed at each visit. Time-to-event analysis was used to determine factors associated with sputum culture conversion.
Results: We enrolled 268 HIV-infected patients. Patients with low isoniazid and rifampicin concentrations were less likely to have sputum culture conversion before the end of tuberculosis treatment (hazard ratio, 0.54; 95% confidence interval, .37-.77; P = .001) or by the end of follow-up (0.61; .44-.85; P = .003). Patients in the highest quartile for area under the rifampicin and isoniazid concentration-time curves for were twice as likely to experience sputum conversion than those in the lowest quartile. Rifampicin and isoniazid concentrations below the thresholds and weight <55 kg were both risk factors for unfavorable tuberculosis treatment outcomes. Only 4.4% of the participants had treatment failure.
Conclusion: Although low antituberculosis drug concentrations did not translate to a high proportion of patients with treatment failure, the association between low concentrations of rifampicin and isoniazid and delayed culture conversion may have implications for tuberculosis transmission. Clinical Trials Registration: NCT01782950.
Figures
Comment in
-
Individualizing Tuberculosis (TB) Treatment: Are TB Programs in High Burden Settings Ready for Prime Time Therapeutic Drug Monitoring?Clin Infect Dis. 2018 Aug 16;67(5):717-718. doi: 10.1093/cid/ciy184. Clin Infect Dis. 2018. PMID: 29514180 No abstract available.
-
Therapeutic Drug Monitoring: The Need for Practical Guidance.Clin Infect Dis. 2019 Mar 5;68(6):1065-1066. doi: 10.1093/cid/ciy787. Clin Infect Dis. 2019. PMID: 30219826 Free PMC article. No abstract available.
References
-
- World Health Organization. Global tuberculosis report 2016. Available at: http://www.who.int/tb/publications/global_report/en/. Accessed 2 March 2017.
-
- Nandawula J. Prevalence and factors associated with non-conversion of positive sputum smears at 8 weeks of treatment among new pulmonary tuberculosis patients in Kampala [master’s thesis]. Kampala, Uganda: College of Health Sciences, Makerere University, 2013.
-
- Zhao FZ, Levy MH, Wen S. Sputum microscopy results at two and three months predict outcome of tuberculosis treatment. Int J Tuberc Lung Dis 1997; 1:570–2. - PubMed
Publication types
MeSH terms
Substances
Associated data
Grants and funding
LinkOut - more resources
Full Text Sources
Other Literature Sources
Medical
