. 2018 May 15;27(10):1711-1722.
doi: 10.1093/hmg/ddy076.

Loss of CLN7 results in depletion of soluble lysosomal proteins and impaired mTOR reactivation

Affiliations

Loss of CLN7 results in depletion of soluble lysosomal proteins and impaired mTOR reactivation

Tatyana Danyukova et al. Hum Mol Genet. .

Abstract

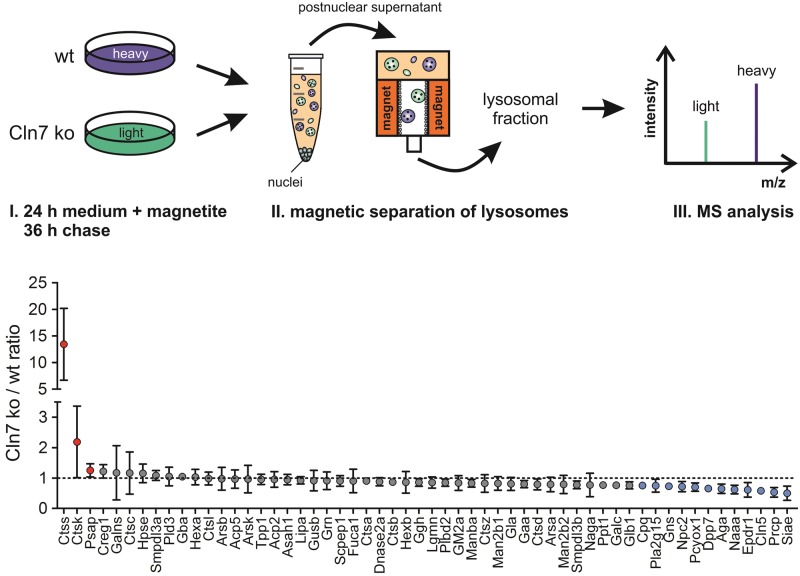
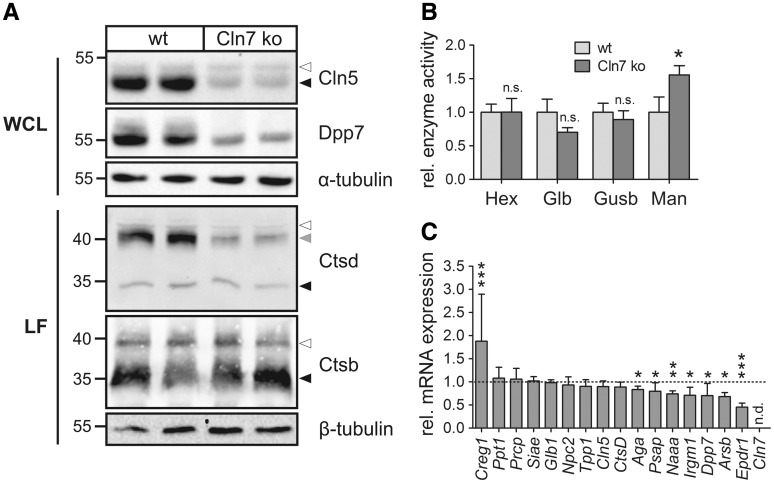
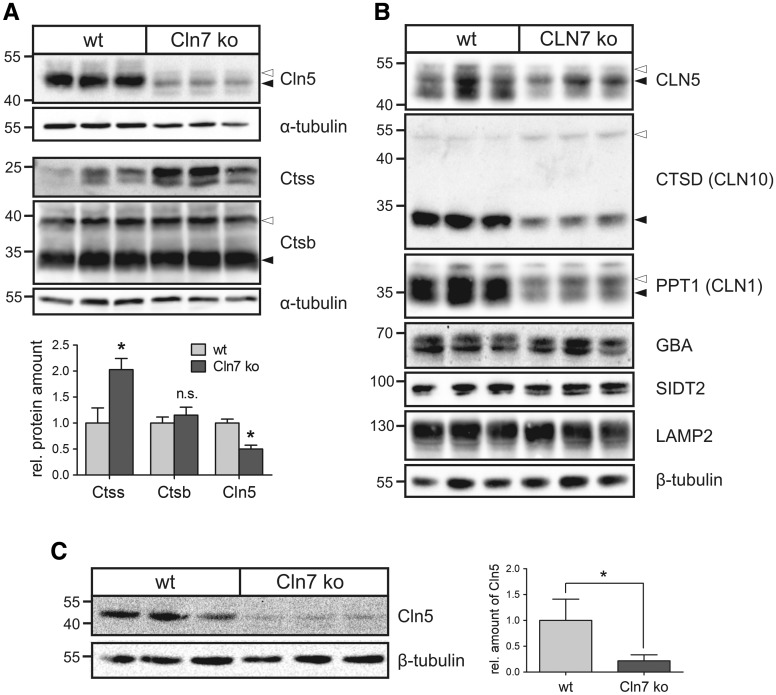
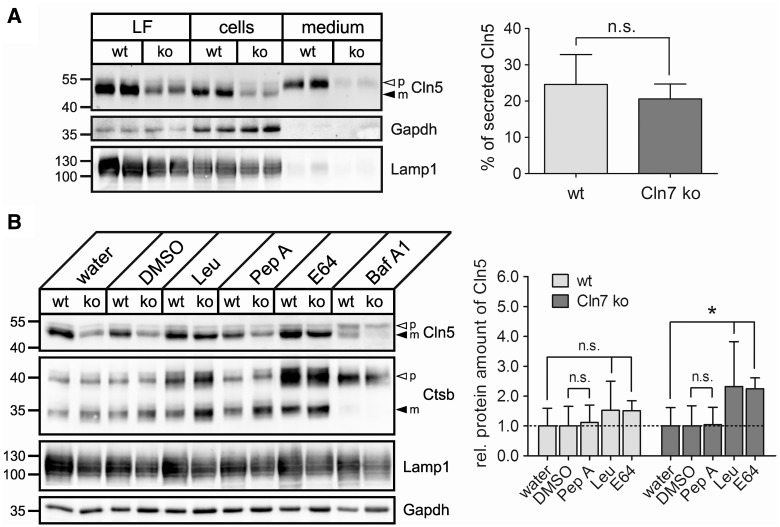
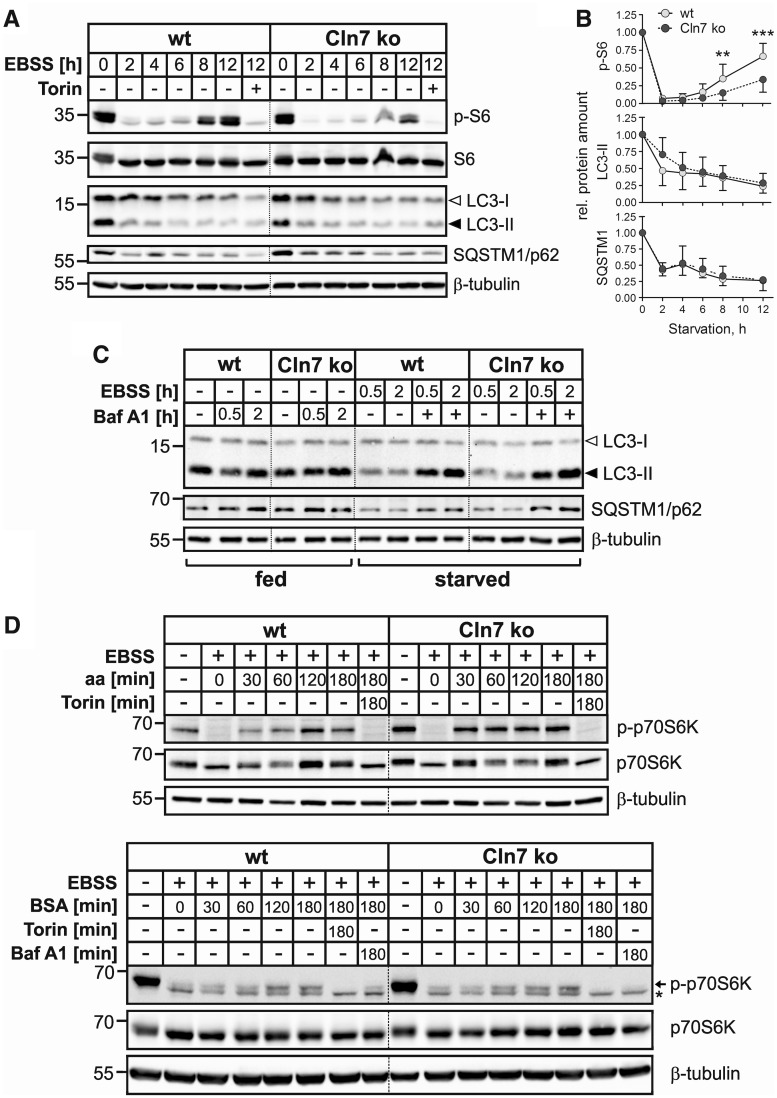
Defects in the MFSD8 gene encoding the lysosomal membrane protein CLN7 lead to CLN7 disease, a neurodegenerative lysosomal storage disorder belonging to the group of neuronal ceroid lipofuscinoses. Here, we have performed a SILAC-based quantitative analysis of the lysosomal proteome using Cln7-deficient mouse embryonic fibroblasts (MEFs) from a Cln7 knockout (ko) mouse model. From 3335 different proteins identified, we detected 56 soluble lysosomal proteins and 29 highly abundant lysosomal membrane proteins. Quantification revealed that the amounts of 12 different soluble lysosomal proteins were significantly reduced in Cln7 ko MEFs compared with wild-type controls. One of the most significantly depleted lysosomal proteins was Cln5 protein that underlies another distinct neuronal ceroid lipofuscinosis disorder. Expression analyses showed that the mRNA expression, biosynthesis, intracellular sorting and proteolytic processing of Cln5 were not affected, whereas the depletion of mature Cln5 protein was due to increased proteolytic degradation by cysteine proteases in Cln7 ko lysosomes. Considering the similar phenotypes of CLN5 and CLN7 patients, our data suggest that depletion of CLN5 may play an important part in the pathogenesis of CLN7 disease. In addition, we found a defect in the ability of Cln7 ko MEFs to adapt to starvation conditions as shown by impaired mammalian target of rapamycin complex 1 reactivation, reduced autolysosome tubulation and increased perinuclear accumulation of autolysosomes compared with controls. In summary, depletion of multiple soluble lysosomal proteins suggest a critical role of CLN7 for lysosomal function, which may contribute to the pathogenesis and progression of CLN7 disease.


Figures

Figure 1.
Figure 1.
SILAC-based comparative analysis of lysosomal proteomes of wild-type and Cln7 ko MEFs. Wild-type (wt) and Cln7 knockout (ko) MEFs were grown in heavy and light isotope-labelled medium and incubated in medium containing magnetite particles for 24 h, followed by 36 h of chase. Equal amounts of postnuclear supernatants from MEFs of both genotypes were pooled prior to magnetic isolation of lysosomes and MS analysis. Soluble lysosomal proteins identified in the lysosomal fractions by MS analysis were plotted against the Cln7 ko/wt ratio determined in four individual SILAC samples (mean ± SD). Lysosomal proteins with increased and decreased amounts in Cln7 ko lysosomes are indicated with red and blue circles, respectively. A list of all lysosomal proteins identified and the corresponding Cln7 ko/wt ratios are given in the Supplementary Material (Tables S1 and S2).
Figure 2.
Figure 2.
Validation of SILAC data using Cln7 ko and wild-type MEFs. (A) Whole cell lysates (WCL) and lysosome-enriched fractions (LF) of Cln7 ko and wild-type MEFs were analysed by Cln5, Dpp7, cathepsin D (Ctsd) and cathepsin B (Ctsb) immunoblotting. α- and β-tubulin western blotting was performed to control equal loading. The positions of the molecular mass markers and the precursor, intermediate and mature forms of Cln5, Ctsb and Ctsd are indicated with white, grey and black arrowheads, respectively. (B) Specific enzymatic activities of β-hexosaminidase (Hex), β-galactosidase (Glb), β-glucuronidase (Gusb) and α-mannosidase (Man) in whole cell lysates of wild-type and Cln7 ko MEFs. The activities relative to wild-type controls are shown (mean ± SD, *P < 0.05, n = 4, two-tailed Student’s t-test). (C) Relative mRNA expression levels of selected lysosomal genes in Cln7 ko MEFs in comparison to wild-type controls (set as 1.0). Data are plotted as mean values ± SD (*P < 0.05, **P < 0.01, ***P < 0.001, n = 3–6, two-tailed Student’s t-test). n.d.: not detected.
Figure 3.
Figure 3.
Decreased Cln5 protein amounts in Cln7 ko cells and brain tissue. (A) Primary bone macrophages isolated from 5-month-old Cln7 ko and age-matched wild-type mice (N = 3) were cultivated for 14 days. Whole cell lysates were analysed by immunoblotting using antibodies against Cln5, cathepsins S (Ctss) and B (Ctsb). Equal loading was verified by α-tubulin western blotting. The positions of the molecular mass markers and the precursor (open arrowhead) and mature (filled arrowhead) Cln5 and Ctsb proteins, respectively, are indicated. Densitometric quantification of the immunoreactive band intensities has been performed and the relative protein amounts are shown in a bar diagram (mean ± SD, n = 3–5). n.s.: not significant, *P < 0.05 (two-tailed Student’s t-test). (B) Lysosome-enriched fractions of CLN7 ko and wild-type HAP1 cells were analysed by western blotting using antibodies against CLN5, cathepsin D (CTSD), PPT1, glucocerebrosidase (GBA), SIDT2 and LAMP2. Equal loading was confirmed by α-tubulin western blotting. The positions of the molecular mass markers and the precursor (open arrowhead) and mature (filled arrowhead) forms of CLN5, CTSD and PPT1, respectively, are indicated. (C) Whole brain lysates from three 10-month-old Cln7 ko and age-matched wild-type mice were analysed by Cln5 immunoblotting. β-Tubulin western blotting was used as loading control. The positions of the molecular mass markers are indicated. Bar diagram represents densitometric analysis of Cln5 protein levels normalized to the loading control (mean ± SD, n = 5). *P < 0.05 (two-tailed Student’s t-test).
Figure 4.
Figure 4.
Increased turnover of Cln5 by cysteine proteases in Cln7 ko lysosomes. (A) Wild-type and Cln7 ko MEFs were incubated in Opti-MEM medium for 24 h. Lysosome-enriched fractions (LF, 50 µg protein), whole cell extracts (100 µg protein) and conditioned media (20%) were analysed by western blotting using anti-Cln5 and anti-Lamp1 antibodies. Equal loading in LF and total cell extracts was confirmed by Lamp1 and Gapdh immunoblotting, respectively. The positions of the molecular mass markers and the precursor (p, open arrowhead) and mature (m, filled arrowhead) Cln5 proteins are indicated. Densitometric quantification of the immunoreactive band intensities from four independent experiments has been performed and the percentage of secreted Cln5 precursor forms related to the total amount of Cln5 is shown in a bar diagram (mean ± SD). n.s.: not significant (two-tailed Student’s t-test). (B) Wild-type and Cln7 ko MEFs were incubated in the presence of leupeptin (Leu, 100 µm), pepstatin A (Pep A, 30 µm), E64 (50 µm) or bafilomycin A1 (Baf A1, 100 nm) for 20 h. Water- and DMSO-treated cells served as negative controls for leupeptin/E64- and pepstatin/bafilomycin-treated cells, respectively. Whole cell extracts (75 µg protein) were analysed by immunoblotting using antibodies against Cln5, cathepsin B (Ctsb) and Lamp1. Equal loading was confirmed by Gapdh western blotting. The positions of the molecular mass markers as well as the precursor (p, open arrowhead) and mature (m, filled arrowhead) Cln5 and Ctsb proteins, respectively, are indicated. Densitometric quantification of the immunoreactive band intensities from at least three independent experiments was performed, and the total Cln5 protein amount was calculated (mean ± SD) relative to water or DMSO controls (set as 1.0). n.s.: not significant, *P < 0.05 compared with a corresponding negative control (two-tailed Student’s t-test).
Figure 5.
Figure 5.
mTORC1 reactivation upon starvation is impaired in Cln7 ko MEFs. (A) Wild-type (wt) and Cln7 ko MEFs were either incubated in the presence of serum and amino acids for 12 h or starved for 2, 4, 6, 8 or 12 h in amino acid-deficient EBSS medium lacking serum. MEFs starved in EBSS in the presence of the mTOR inhibitor torin 1 for 12 h were used as controls. Total cell extracts were prepared and analysed by phospho-S6 (p-S6; Ser235/236), S6, LC3 and SQSTM1/p62 immunoblotting. Equal loading was confirmed by β-tubulin western blotting. The positions of the molecular mass markers are indicated. (B) Densitometric analysis of the immunoreactive band intensities shown in (A). Data from at least three independent experiments were analysed. Results are shown as mean ± SD. ***P < 0.001, **P < 0.01 (two-tailed Student’s t-test). (C) Wild-type and Cln7 ko MEFs were incubated either in complete culture medium (fed) containing bafilomycin A1 (Baf A1, 100 nm) or in amino acid- and serum-free EBSS medium in the absence or presence of Baf A1 (starved) for 0.5 or 2 h. Total cell extracts were analysed by LC3 and SQSTM1/p62 immunoblotting. β-Tubulin immunoblotting was used as loading control. The positions of the molecular mass markers are indicated. (D) Wild-type and Cln7 ko MEFs were starved for amino acids and serum in EBSS medium for 1 h. Cells were either harvested or mTORC1 was re-activated by DMEM containing amino acids (aa, upper panel) or EBSS containing 3% (w/v) BSA (lower panel) for 30, 60, 120 and 180 min. MEFs incubated in DMEM in the presence of the mTOR inhibitor torin 1 (upper panel) or incubated in EBSS/3% BSA containing torin 1 or Baf A1 (lower panel) for 180 min were used as controls. Non-starved MEFs incubated in medium containing amino acids and serum were used as additional controls. Total cell extracts were prepared and analysed by phospho-p70S6K (p-p70S6K; Thr389) and p70S6K immunoblotting. The positions of the band corresponding to phospho-p70S6K and an unspecific band are marked with an arrow and an asterisk, respectively (lower panel). Equal loading was confirmed by β-tubulin western blotting. The positions of the molecular mass markers are indicated.

Similar articles

Cited by

References

    1. Mole S.E., Williams R.E., Goebel H.H. (2011) The Neuronal Ceroid Lipofuscinoses (Batten Disease) Contemporary Neurology Series, 2nd edn Oxford University Press Inc, New York.
    1. Kollmann K., Uusi-Rauva K., Scifo E., Tyynelä J., Jalanko A., Braulke T. (2013) Cell biology and function of neuronal ceroid lipofuscinosis-related proteins. Biochim. Biophys. Acta, 1832, 1866–1881. - PubMed
    1. Di Fruscio G., Schulz A., De Cegli R., Savarese M., Mutarelli M., Parenti G., Banfi S., Braulke T., Nigro V., Ballabio A. (2015) Lysoplex: an efficient toolkit to detect DNA sequence variations in the autophagy-lysosomal pathway. Autophagy, 11, 928–938. - PMC - PubMed
    1. Siintola E., Topcu M., Aula N., Lohi H., Minassian B.A., Paterson A.D., Liu X.Q., Wilson C., Lahtinen U., Anttonen A.K.. et al. (2007) The novel neuronal ceroid lipofuscinosis gene MFSD8 encodes a putative lysosomal transporter. Am. J. Hum. Genet., 81, 136–146. - PMC - PubMed
    1. Kousi M., Lehesjoki A.E., Mole S.E. (2012) Update of the mutation spectrum and clinical correlations of over 360 mutations in eight genes that underlie the neuronal ceroid lipofuscinoses. Hum. Mutat., 33, 42–63. - PubMed

Publication types

MeSH terms

Supplementary concepts