. 2018 Apr 20;46(7):3579-3594.
doi: 10.1093/nar/gky145.

Cellular uptake mediated by epidermal growth factor receptor facilitates the intracellular activity of phosphorothioate-modified antisense oligonucleotides

Affiliations

Cellular uptake mediated by epidermal growth factor receptor facilitates the intracellular activity of phosphorothioate-modified antisense oligonucleotides

Shiyu Wang et al. Nucleic Acids Res. .

Abstract

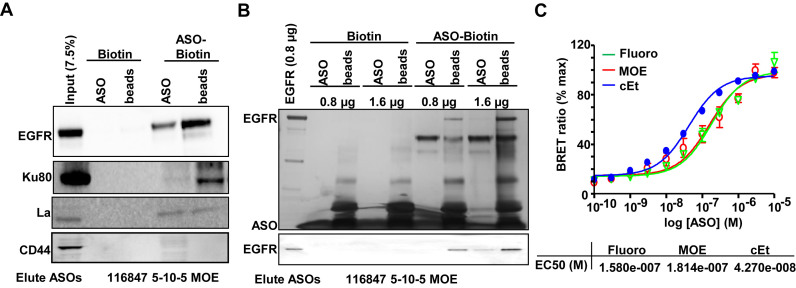
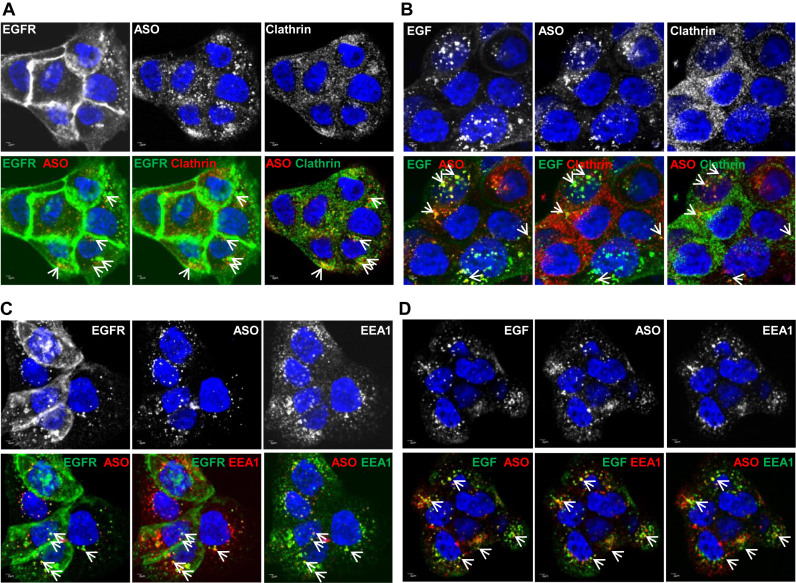
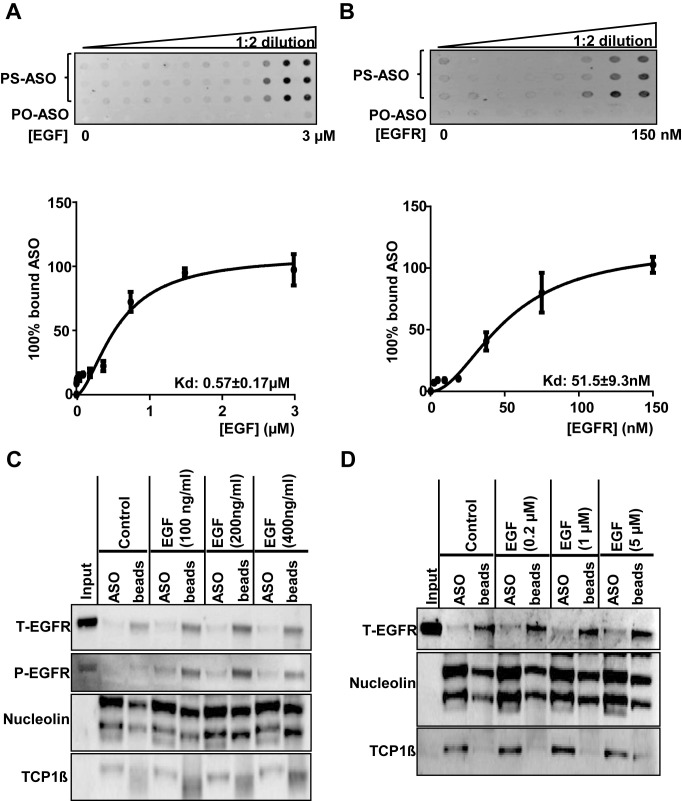
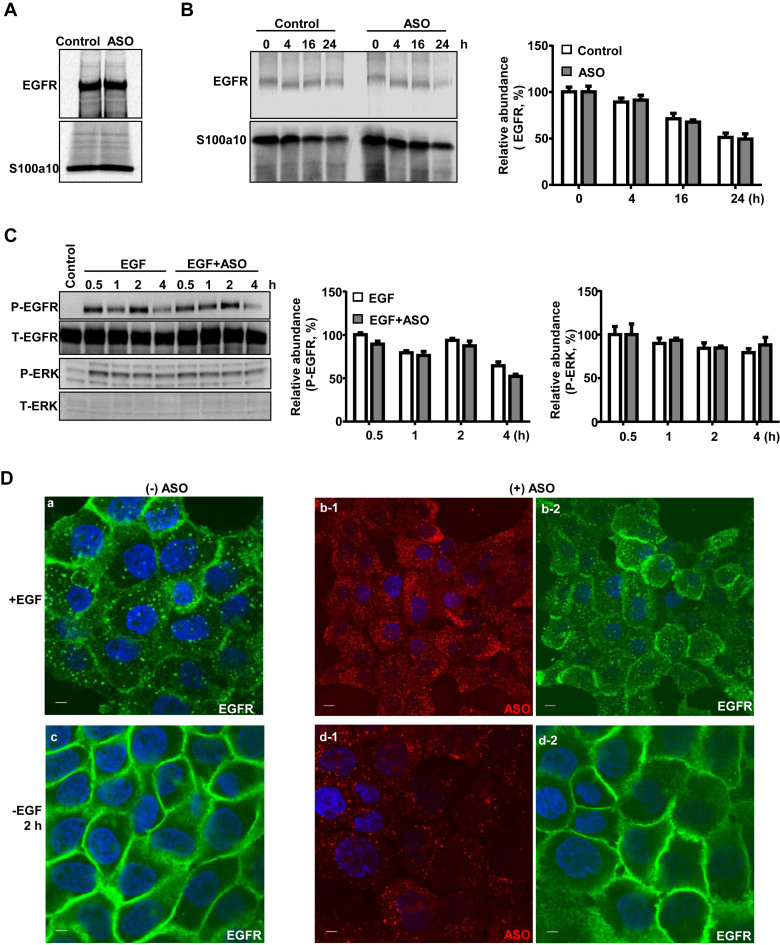
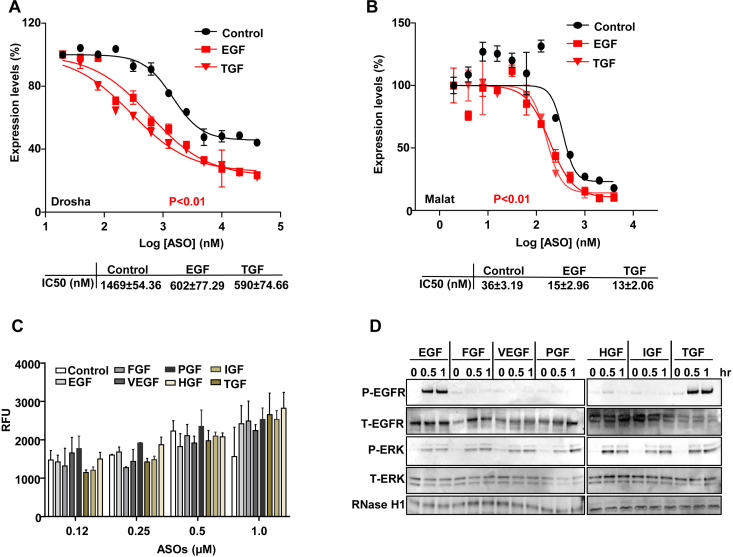
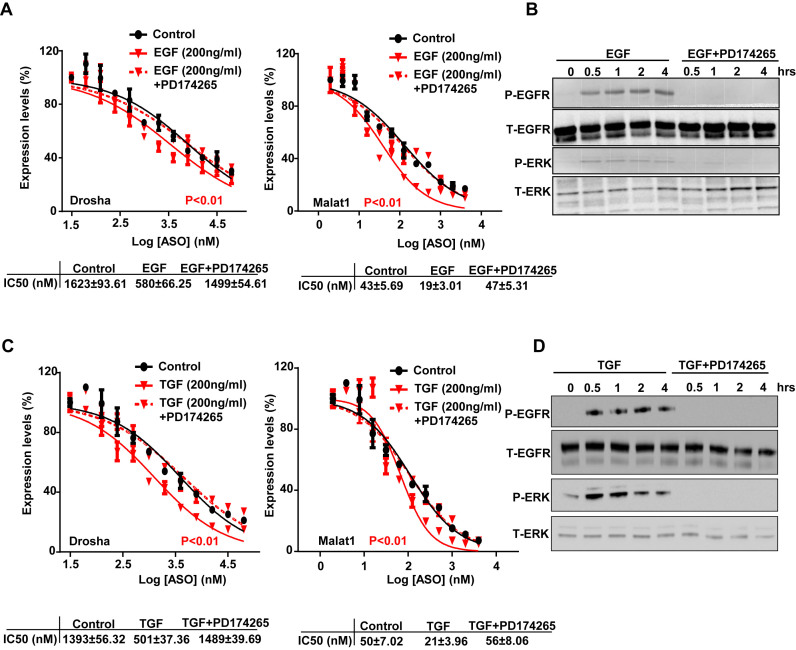
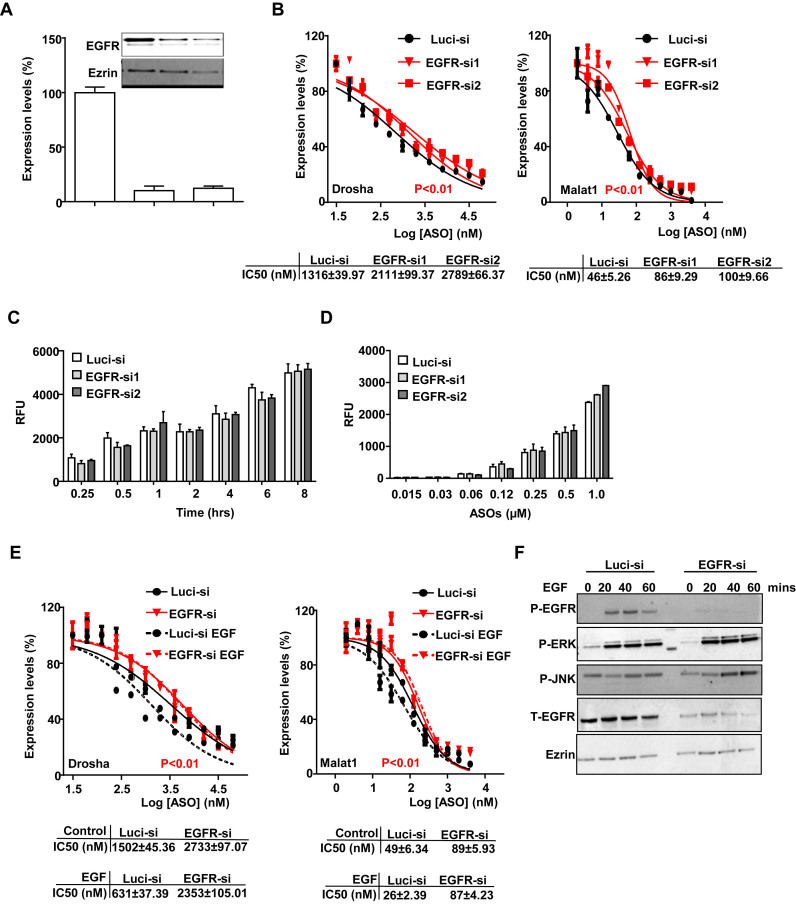
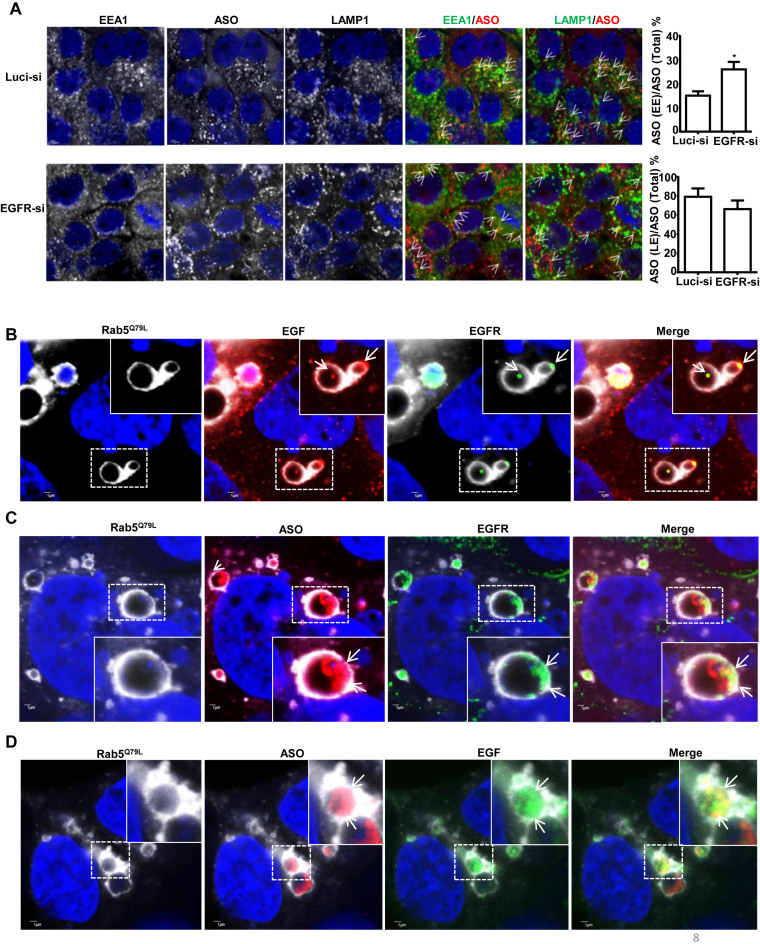
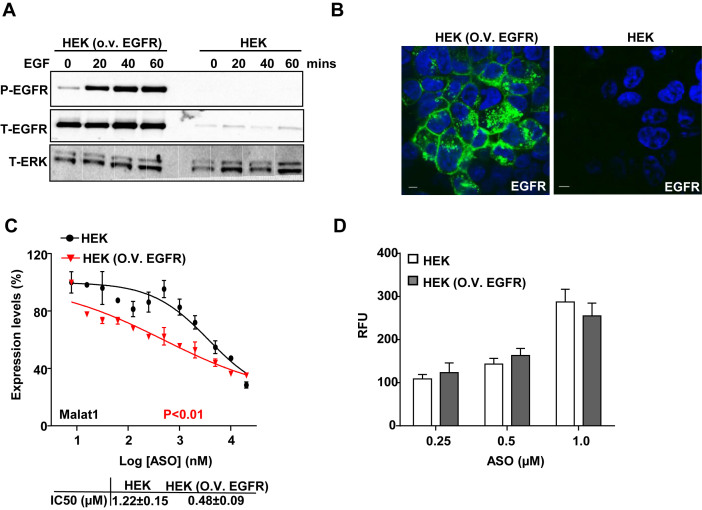
Chemically modified antisense oligonucleotides (ASOs) with phosphorothioate (PS) linkages have been extensively studied as research and therapeutic agents. PS-ASOs can enter the cell and trigger cleavage of complementary RNA by RNase H1 even in the absence of transfection reagent. A number of cell surface proteins have been identified that bind PS-ASOs and mediate their cellular uptake; however, the mechanisms that lead to productive internalization of PS-ASOs are not well understood. Here, we characterized the interaction between PS-ASOs and epidermal growth factor receptor (EGFR). We found that PS-ASOs trafficked together with EGF and EGFR into clathrin-coated pit structures. Their co-localization was also observed at early endosomes and inside enlarged late endosomes. Reduction of EGFR decreased PS-ASO activity without affecting EGF-mediated signaling pathways and overexpression of EGFR increased PS-ASO activity in cells. Furthermore, reduction of EGFR delays PS-ASO trafficking from early to late endosomes. Thus, EGFR binds to PS-ASOs at the cell surface and mediates essential steps for active (productive) cellular uptake of PS-ASOs through its cargo-dependent trafficking processes which migrate PS-ASOs from early to late endosomes. This EGFR-mediated process can also serve as an additional model to better understand the mechanism of intracellular uptake and endosomal release of PS-ASOs.


Figures

Figure 1.
Figure 1.
EGFR interacts with PS-ASOs. (A) Western analyses of proteins that were eluted with PS-ASOs (ASO, IONIS ID 116847) or that remained on the biotinylated PS-ASO coated beads (beads). Neutravidin agarose beads pre-coated with either biotinylated 2′-MOE PS-ASOs (ASO-Biotin, IONIS ID 451104) or control biotin (Biotin) were incubated with cell lysates of A431, washed, and proteins were eluted using non-biotinylated PS-ASOs (IONIS ID 116847), which has the same modification and sequences (CTGCTAGCCTCTGGATTTGA) as the biotinylated PS-ASO (IONIS ID 451104). The experiments were repeated at least three times and representative results are shown. (B) Proteins eluted with PS-ASOs (ASO, IONIS ID 116847) or that remained on the beads (beads) were visualized by silver staining (Upper panel) in a 4–12% gradient SDS-PAGE. Blot of aliquoted proteins from the above experiment was probed for EGFR by western (lower panel). Affinity selection was performed using the biotinylated 2′-MOE PS-ASO (ASO-Biotin, IONIS ID 451104) or control biotin (Biotin), as (A), but with either 0.8 μg or 1.6 μg purified recombinant EGFR. The experiments were repeated at least three times and representative results are shown. (C) Relative affinities for 2′-Fluoro, 2′-cEt and 2′-MOE PS-ASOs were determined by competitive ASO binding to the NLuc/EGFR fusion protein containing extracellular domain and transmembrane domain in a BRET assay. 10 nM 5′- Alexa Fluor 594 conjugated cEt PS-ASO (Ionis ID: 766636) was competed with unconjugated 2′-Fluoro, 2′-MOE, or 2′-cEt PS-ASO at concentrations from 0.1 to 10,000 nM. Relative EC50 values are shown.
Figure 2.
Figure 2.
PS-ASOs traffic together with EGF and EGFR through the endocytic pathway. (A) Representative images of immunofluorescent staining for clathrin and EGFR in A431 cells incubated with non-labeled EGF and Cy3-labeled PS-ASOs for 30 min. The nuclei were stained with Hoechst 33342 (blue). The arrow indicates co-localization between EGFR (green) and PS-ASOs (red); between EGFR (green) and clathrin (red); between PS-ASOs (red) and clathrin (green). Scale bars, 2 μm. (B) Representative images of immunofluorescent staining for clathrin in A431 cells incubated with FITC-EGF and Cy3-labeled PS-ASOs for 30 min. The nuclei were stained with Hoechst 33342 (blue). The arrow indicates co-localization between EGF (green) and PS-ASOs (red); between EGF (green) and clathrin (red); between PS-ASOs (red) and clathrin (green). Scale bars, 2 μm. (C) Representative images of immunofluorescent staining for EEA1 and EGFR in A431 cells incubated with non-labeled EGF and Cy3-labeled PS-ASOs for 30 min. The nuclei were stained with Hoechst 33342 (blue). The arrow indicates co-localization between EGFR (green) and PS-ASOs (red); between EGFR (green) and EEA1 (red); and between PS-ASOs (red) and EEA1 (green). Scale bars, 2 μm. (D) Representative images of immunofluorescent staining for EEA1 in A431 cells incubated with FITC-EGF and Cy3-labeled PS-ASOs for 30 min. The nuclei were stained with Hoechst 33342 (blue). The arrow indicates co-localization between EGF (green) and PS-ASOs (red); between EGF (green) and EEA1 (red); between PS-ASOs (red) and EEA1 (green); Scale bars, 2 μm.
Figure 3.
Figure 3.
PS-ASOs interact with EGFR more tightly than with EGF. (A and B) The membrane binding assay for EGF or EGFR and PS-ASOs. EGF at concentrations ranging from 3 nM to 3 μM or purified recombinant EGFR protein at concentrations ranging from 5 nM to 150 nM were incubated with PS-ASOs for 1 h at 37°C and the samples were loaded on a Hybond ECL nitrocellulose membrane. The signal intensities retained in nitrocellulose membrane for the protein bound form of the FITC-labeled 2′-MOE gapmer PS-ASO (PS-ASO, IONIS ID 256903) or phosphodiester ASO (PO-ASO) were quantified and the binding curves for EGF (A) and EGFR (B) were plotted using Prism. The error bars represent standard deviations from three experiments; (C) EGFR (total EGFR, T-EGFR) was blotted after PS-ASO affinity selection as shown in Figure 1, except that cell lysates were from A431 cells treated with indicated concentrations of EGF. The same blot was probed sequentially with antibodies to phosphorylated EGFR (P-EGFR), Nucleolin, and TCP1β. The experiments were repeated at least three times and representative results are shown; (D) EGFR (total EGFR, T-EGFR) was blotted after affinity selection as shown in Figure 1, except that the bound proteins were eluted by PS-ASOs in the presence of EGF at indicated concentrations. The same blot was probed sequentially with different antibodies against other ASO-binding proteins (Nucleolin and TCP1β). The experiments were repeated at least three times and representative results are shown.
Figure 4.
Figure 4.
PS-ASOs do not affect EGFR synthesis, degradation and recycling. (A) A431 cells were pulse labeled with [35S]-Met/Cys for 50 min. EGFR and S100a10 were immunoprecipitated using their specific antibodies, and analyzed by SDS-PAGE. (B) Intracellular levels of nascent EGFR were chased and analyzed by SDS-PAGE at indicated times after the labeling and were visualized and quantified by autoradiography, as in (A). S100a10 was detected and used as a loading control. (C) Protein samples were analyzed by western analyses from A431 cells treated with EGF or EGF and PS-ASOs. The blot was probed sequentially with antibodies specific to the various proteins and the images were quantified by ImageLab (Bio-Rad). (D) Representative images of immunofluorescent staining for EGFR (green) in A431 cells incubated with EGF (a) or EGF and Cy3-labeled PS-ASOs (red) (b-1 and b-2) for 16 h, and then 2 h after the removal of EGF (c) or EGF and Cy3-labeled PS-ASOs (d-1 and d-2). The nuclei were stained with Hoechst 33342 (blue). Scale bars, 5 μm.
Figure 5.
Figure 5.
EGF increases the activity but not uptake of PS-ASOs in A431 cells. (A and B) Reduction of Drosha (A) and Malat1 (B) RNA was determined by qRT-PCR analysis of A431 cells treated with EGF or TGF for 4 h before they were incubated with PS-ASOs. Data are relative to untreated cells. The error bars represent standard deviations from 3 independent experiments. Activity curves were fitted from data plotted in panels and IC50 was calculated based on a non-linear regression model. P (in red) <0.01, EGF or TGF treatment versus control; P values were computed by one-way ANOVA as the concentrations of PS-ASOs were set as random effect. (C) Intracellular fluorescence of Cy3-PS-ASOs was quantified by flow cytometry to determine PS-ASO uptake (RFU) in A431 cells treated with different growth factors for 4 h before they were incubated with Cy3-PS-ASOs for 2 h. The error bars represent standard deviations from 3 independent experiments. (D) Western analyses of proteins from A431 cells treated with different growth factors for indicated times. The blot was probed sequentially with different antibodies: phosphorylated EGFR (P-EGFR), total EGFR (T-EGFR), phosphorylated ERK (P-ERK), total ERK (T-ERK) and RNase H1.
Figure 6.
Figure 6.
PD174265 reverses EGF or TGF driven increase in PS-ASO activity. (A) The levels of Drosha and Malat1 RNAs were quantified by qRT-PCR analysis of A431 cells treated with EGF or EGF and PD174265. Data are relative to untreated cells. The error bars represent standard deviations from 3 independent experiments. Activity curves were fitted from data plotted in panels based on a non-liner regression model and IC50 was calculated based on a non-linear regression model. P (in red) <0.01, EGF or TGF treatment versus control; P (in red) <0.01, EGF treatment versus control; P values were computed by one-way ANOVA as the concentrations of PS-ASOs were set as random effect. (B) Western analyses of proteins in A431 cells pre-treated with or without PD174265 followed by the treatment of EGF. The blot was probed sequentially with different antibodies for phosphorylated EGFR (P-EGFR), total EGFR (T-EGFR), phosphorylated ERK (P-ERK), total ERK (T-ERK). (C) Target reduction of Drosha and Malat1 RNAs was quantified by qRT-PCR analysis of A431 cells treated with TGF or TGF and PD174265. Data are relative to no PS-ASO control. The error bars represent standard deviations from three independent experiments. Activity curves were fitted from data plotted in panels and IC50 was calculated based on a non-liner regression model. P (in red) <0.01, TGF treatment versus control. P values were computed by One-way ANOVA as the concentrations of PS-ASOs were set as random effect. (D) Western analyses of proteins from A431 cells pre-treated with or without PD174265 followed by the treatment of TGF, as in (B).
Figure 7.
Figure 7.
Reduction of EGFR decreases PS-ASO activity. (A) A431 cells were treated with control (Luci-si) or siRNAs targeting EGFR as indicated. RNA and protein levels of EGFR were determined by qRT-PCR and western analyses, respectively. RNA levels are relative to Luci-siRNA treated samples. Ezrin was served as a loading control. (B) Cells pre-treated with siRNAs for 48 h were incubated with PS-ASOs targeting either Drosha or Malat1 RNA for 16 h. RNA levels were quantified using qRT-PCR. The error bars represent standard deviations from three independent experiments. Activity curves were fitted from data plotted in panels and IC50 was calculated based on a non-linear regression model. P<0.01 (in red), EGFR-si1 or EGFR-si2 versus Luci-si; P values were computed by One-way ANOVA as the concentrations of PS-ASOs were set as random effect. (C and D) Intracellular fluorescence of Cy3-PS-ASOs was quantified by flow cytometry in siRNA-treated cells to determine uptake (RFU) as a function of time at 0.5 μM (C) or as a function of PS-ASO concentration at 2 h (D). The error bars represent standard deviations from three independent experiments. (E) qRT-PCR quantification of Drosha and Malat1 RNAs in A431 cells treated with control siRNA or EGFR siRNA, which were further incubated with EGF for 4 h before treatment with PS-ASOs. Data are relative to untreated cells. Activity curves were fitted from data plotted in panels and IC50 was calculated based on a non-liner regression model. The error bars represent standard deviations from 3 independent experiments. P< 0.01 (in red), EGFR-si versus Luci-si with or without EGF treatment; P values were computed by one-way ANOVA as the concentrations of PS-ASOs were set as random effect. (F) Western analyses for various proteins in A431 cells treated with control siRNA or siRNA targeting EGFR, which were incubated with EGF for indicated times.
Figure 8.
Figure 8.
Reduction of EGFR delays PS-ASO trafficking from early to late endosomes. (A) Representative images of immunofluorescent staining for EEA1 (green), and LAMP1 (green) in control (Luci-si) or EGFR reduced (EGFR-si) A431 cells incubated with Cy3-labeled PS-ASOs (red) for 2 h. Representative co-localization was indicated by arrows, between EEA1 or LAMP1 and PS-ASO; Scale bars, 2 μm. The PS-ASO-positive EEs or LEs were counted in 20 cells, and the percentage of the PS-ASO-positive EEs or LEs was calculated relative to the total numbers of the PS-ASO-positive foci; *P< 0.05, computed by Student's t-test. (B) Representative images of immunofluorescent staining for EGFR in RAB5(Q79L)-GFP overexpressing A431 cells treated with Alexa Fluor 647-EGF for 4 h. The nuclei were stained with Hoechst 33342 (blue). Enlarged images show co-localization, indicated by arrows, between EGFR (green) and EGF (red); Scale bars, 1 μm. (C) Representative images of immunofluorescent staining for EGFR in RAB5(Q79L)-GFP overexpressing A431 cells treated with Cy3-PS-ASOs and non-labeled EGF. The nuclei were stained with Hoechst 33342 (blue). Enlarged images show co-localization, indicated by arrows, between EGFR (green) and PS-ASOs (red); Scale bars, 1 μm. (D) Representative images of RAB5(Q79L)-GFP overexpressing A431 cells treated with Alexa Fluor 647-EGF and Cy3-PS-ASOs for 4 h. Enlarged images show co-localization, indicated by arrows, between PS-ASOs (red) and EGF (green); The nuclei were stained with Hoechst 33342 (blue). Scale bars, 1 μm.
Figure 9.
Figure 9.
Overexpression of EGFR increases PS-ASO activity in HEK cells. (A) Western analyses for proteins in control or EGFR overexpressing HEK cells treated with EGF for indicated time. The blot was probed sequentially with different antibodies detecting phosphorylated EGFR (P-EGFR), total EGFR (T-EGFR) and total ERK (T-ERK) as loading control. (B) Representative images of immunofluorescent staining for EGFR (green) in HEK cells overexpressing EGFR. Nuclei were stained with Hoechst 33342 (blue). Scale bar, 5 μm. (C) Reduction of Malat1 RNA was quantified by qRT-PCR in HEK cells with or without overexpression of EGFR. Data are relative to untreated cells. Activity curves were fitted from data plotted in panels based on a non-linear regression model. The error bars represent standard deviations from 3 independent experiments. P< 0.01 (in red), HEK versus HEK (O.V. EGFR); P value was computed by One-way ANOVA as the concentrations of PS-ASOs were set as random effect; IC50 was calculated based on a non-liner regression model. (D) Intracellular fluorescence of Cy3-PS-ASO was quantified by flow cytometry to determine PS-ASO uptake (RFU) in HEK cells with or without overexpression of EGFR.

Similar articles

Cited by

References

    1. Wu H., Lima W.F., Crooke S.T.. Properties of cloned and expressed human RNase H1. J. Biol. Chem. 1999; 274:28270–28278. - PubMed
    1. Bennett C.F., Swayze E.E.. RNA targeting therapeutics: molecular mechanisms of antisense oligonucleotides as a therapeutic platform. Annu. Rev. Pharmacol. Toxicol. 2010; 50:259–293. - PubMed
    1. Crooke S.T. Antisense strategies. Curr. Mol. Med. 2004; 4:465–487. - PubMed
    1. Yu R.Z., Grundy J.S., Geary R.S.. Clinical pharmacokinetics of second generation antisense oligonucleotides. Expert Opin. Drug Metab. Toxicol. 2013; 9:169–182. - PubMed
    1. Crooke S.T. Progress in antisense technology. Annu. Rev. Med. 2004; 55:61–95. - PubMed

Publication types

MeSH terms