. 2018 May 19;69(11):2837-2846.
doi: 10.1093/jxb/ery080.

Phytochrome B regulates resource allocation in Brassica rapa

Affiliations

Phytochrome B regulates resource allocation in Brassica rapa

Andrej A Arsovski et al. J Exp Bot. .

Abstract

Crop biomass and yield are tightly linked to how the light signaling network translates information about the environment into allocation of resources, including photosynthates. Once activated, the phytochrome (phy) class of photoreceptors signal and re-deploy carbon resources to alter growth, plant architecture, and reproductive timing. Most of the previous characterization of the light-modulated growth program has been performed in the reference plant Arabidopsis thaliana. Here, we use Brassica rapa as a crop model to test for conservation of the phytochrome-carbon network. In response to elevated levels of CO2, B. rapa seedlings showed increases in hypocotyl length, shoot and root fresh weight, and the number of lateral roots. All of these responses were dependent on nitrogen and polar auxin transport. In addition, we identified putative B. rapa orthologs of PhyB and isolated two nonsense alleles. BrphyB mutants had significantly decreased or absent CO2-stimulated growth responses. Mutant seedlings also showed misregulation of auxin-dependent genes and genes involved in chloroplast development. Adult mutant plants had reduced chlorophyll levels, photosynthetic rate, stomatal index, and seed yield. These findings support a recently proposed holistic role for phytochromes in regulating resource allocation, biomass production, and metabolic state in the developing plant.


Figures
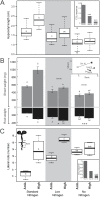
Fig. 1.
Fig. 1.
Nitrogen availability limits growth increase in high CO2. (A) Average hypocotyl lengths of 10-day-old B. rapa seedlings on media containing standard, low, or no nitrogen in ambient (400 ppm) or high (1000 ppm) CO2. The bold line is the median of at least four independent biological replicates with five seedlings per replicate. (B) Average shoot and root weights of the same seedlings from (A). Inset shows ln(root fresh weight, mg) on the x-axis and ln(shoot fresh weight, mg) on the y-axis, Stn N=standard media, low N=low nitrogen medium, No N=no nitrogen medium. Filled marker points indicate high CO2; open marker points are ambient CO2. (C) Number of lateral roots within the 4 cm of the primary root near the crown of seedlings from (A), counted on day 7. Box plot ‘whiskers’ denote the maximum and minimum of the data, circles are outliers, the top edge of the box is the third quartile of the data, and the bottom edge is the first quartile. Different letters indicate that samples had significantly different means (ANOVA and Tukey HSD multiple comparison test). Insets show fold response to high CO2 compared with ambient CO2. Asterisks indicate which conditions give a significantly different response to CO2 when compared with standard conditions (***P<0.001, *P<0.05, ANOVA).
Fig. 2.
Fig. 2.
CO2-responsive growth requires auxin transport. (A) Average hypocotyl lengths of 10-day-old B. rapa seedlings on standard media with mock or NPA treatment, in ambient (400 ppm) or high (1000 ppm) CO2. The bold black line is the median of at least four independent biological replicates with five seedlings per replicate. (B) Average shoot and root weights of the same seedlings from (A). Inset shows ln(root fresh weight, mg) on the x-axis and ln(shoot fresh weight, mg) on the y-axis, Stn=standard medium, NPA= NPA medium. Filled marker points indicate high CO2; open marker points are ambient CO2. (C) Number of lateral roots within the 4 cm of primary root near the crown of seedlings from (A), counted on day 7. Letters indicate significant differences of pairwise mean comparisons (ANOVA and Tukey HSD multiple comparison test). Seedlings exposed to NPA have a significantly reduced response to elevated CO2 (P<0.01, ANOVA).
Fig. 3.
Fig. 3.
Response to elevated CO2 requires BrPhyB. (A) Gene expression (qRT-PCR) in phyB mutants. Expression relative to PP2A control. Different letters denote statistical significance compared with the wild type (P<0.001, ANOVA and Tukey HSD multiple comparison test). Asterisks indicate a significantly different response to CO2 compared with the wild type (***P<0.001, **P<0.01, *P<0.05, ANOVA, n=3). (B) Average hypocotyl lengths of 10-day-old B. rapa seedlings on standard, low, or no nitrogen media in ambient (400 ppm) or high (800 ppm) CO2. The bold black line is the median of at least four independent biological replicates with five seedlings per replicate. The inset shows the fold response to high CO2 compared with ambient CO2. Asterisks indicate that all mutants have a significantly different response to CO2 than the wild type (***P<0.001, **P<0.01, *P<0.05, ANOVA). (C) Average shoot and root weights of the same seedlings from (A); inset shows ln(root fresh weight, mg) on the x-axis and ln(shoot fresh weight on the y-axis, square= wild type, triangle=average of phyB-1 and phyB-3. Filled marker points indicate high CO2; open marker points are ambient CO2. CO2 response in all mutants is significantly different from that in the wild type (P<0.05, ANOVA). (D) Number of lateral roots within the 4 cm of primary root near the crown of seedlings from (A), counted on day 7. CO2 response in all mutants is significantly different from that of the wild type (P<0.001, ANOVA). Letters show significant differences of pairwise mean comparisons (ANOVA and Tukey HSD multiple comparison test).
Fig. 4.
Fig. 4.
BrPHYB is required for a normal photosynthetic rate. (A) Total chlorophyll (ChlA+ChlB) in leaf tissue from at least twelve, 3-week-old wild-type and phyB mutant plants. Measured as µg mg–1 of harvested fresh tissue. (B) Photosynthetic rate (µmol CO2 m–2 s–1) from the same plants as (A). (C) Stomatal index measured as the number of stomata/number of epidermal cells from the same plants as (A). (D) Fresh weight of aboveground tissue from at least five, 6-week-old plants. (E) Dry weight of 6-week-old plants from (E). (F) Seed yield at harvest. Letters show significant differences of pairwise mean comparisons (ANOVA and Tukey HSD multiple comparison test).

References

    1. Aerts R, de Caluwe H, Konings H. 1992. Seasonal allocation of biomass and nitrogen in four carex species from mesotrophic and eutrophic fens as affected by nitrogen supply. Journal of Ecology 80, 653–664.
    1. Ainsworth EA, Long SP. 2005. What have we learned from 15 years of free-air CO2 enrichment (FACE)? A meta-analytic review of the responses of photosynthesis, canopy properties and plant production to rising CO2. New Phytologist 165, 351–371. - PubMed
    1. Alvarez JM, Vidal EA, Gutiérrez RA. 2012. Integration of local and systemic signaling pathways for plant N responses. Current Opinion in Plant Biology 15, 185–191. - PubMed
    1. Anderson LJ, Derner JD, Polley HW, Gordon WS, Eissenstat DM, Jackson RB. 2010. Root responses along a subambient to elevated CO2 gradient in a C3–C4 grassland. Global Change Biology 16, 454–468.
    1. Beilstein MA, Nagalingum NS, Clements MD, Manchester SR, Mathews S. 2010. Dated molecular phylogenies indicate a Miocene origin for Arabidopsis thaliana. Proceedings of the National Academy of Sciences, USA 107, 18724–18728. - PMC - PubMed

Publication types

MeSH terms