

Genomic Amplifications and Distal 6q Loss: Novel Markers for Poor Survival in High-risk Neuroblastoma Patients
- PMID: 29514301
- PMCID: PMC6186524
- DOI: 10.1093/jnci/djy022
Genomic Amplifications and Distal 6q Loss: Novel Markers for Poor Survival in High-risk Neuroblastoma Patients
Abstract
Background: Neuroblastoma is characterized by substantial clinical heterogeneity. Despite intensive treatment, the survival rates of high-risk neuroblastoma patients are still disappointingly low. Somatic chromosomal copy number aberrations have been shown to be associated with patient outcome, particularly in low- and intermediate-risk neuroblastoma patients. To improve outcome prediction in high-risk neuroblastoma, we aimed to design a prognostic classification method based on copy number aberrations.
Methods: In an international collaboration, normalized high-resolution DNA copy number data (arrayCGH and SNP arrays) from 556 high-risk neuroblastomas obtained at diagnosis were collected from nine collaborative groups and segmented using the same method. We applied logistic and Cox proportional hazard regression to identify genomic aberrations associated with poor outcome.
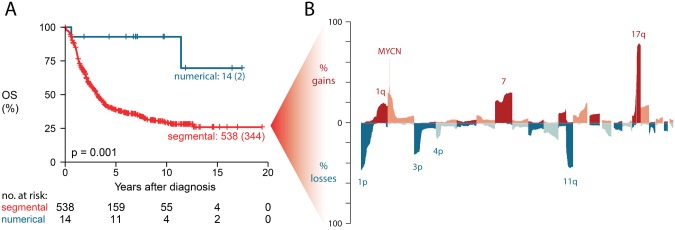
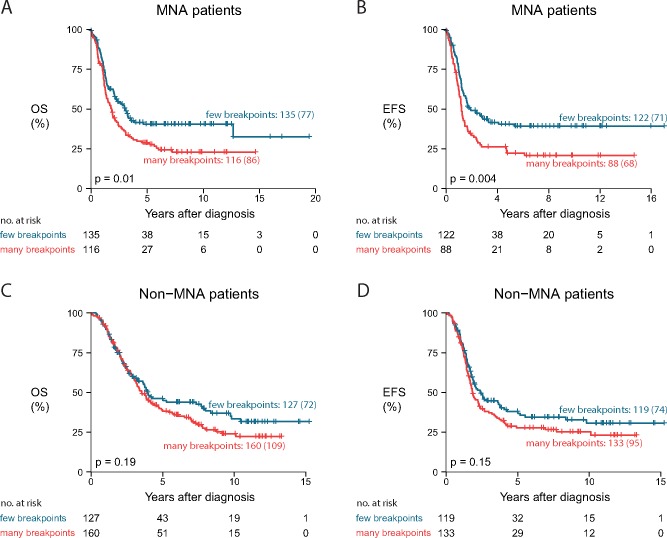
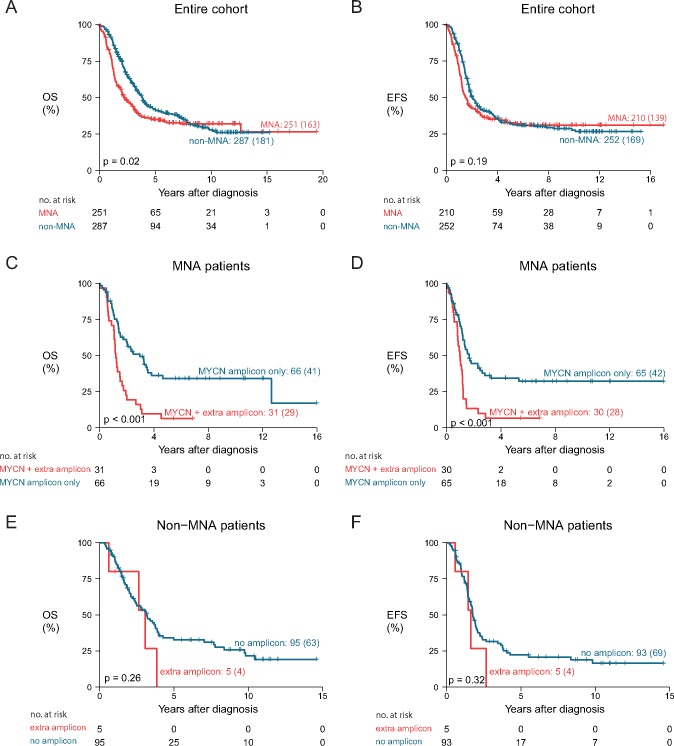
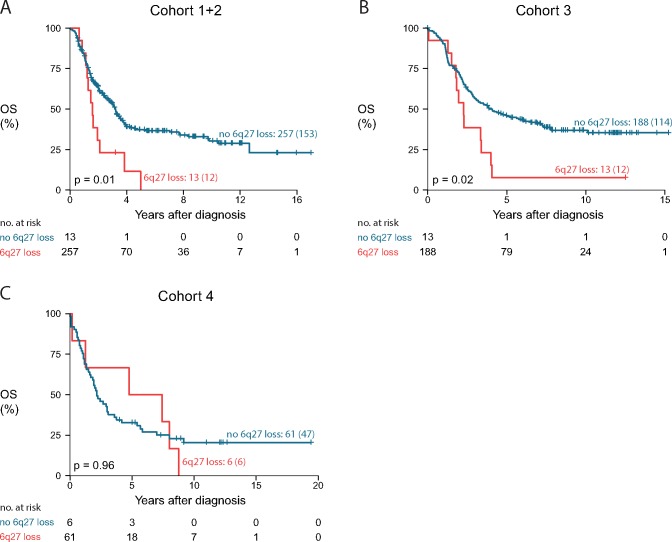
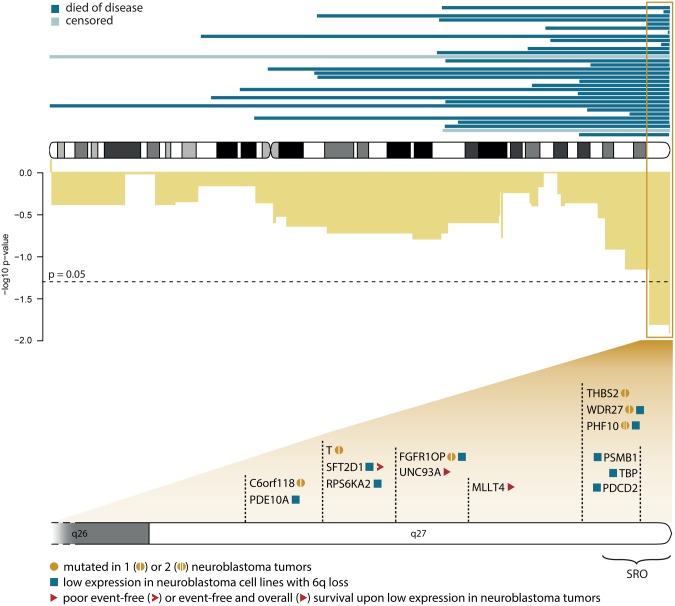
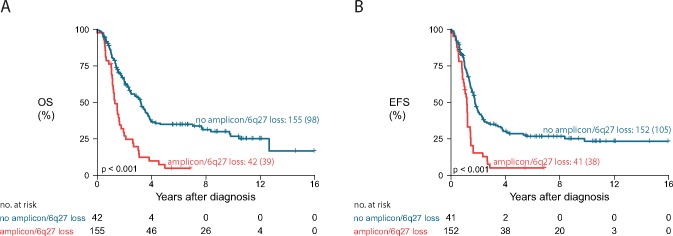
Results: In this study, we identified two types of copy number aberrations that are associated with extremely poor outcome. Distal 6q losses were detected in 5.9% of patients and were associated with a 10-year survival probability of only 3.4% (95% confidence interval [CI] = 0.5% to 23.3%, two-sided P = .002). Amplifications of regions not encompassing the MYCN locus were detected in 18.1% of patients and were associated with a 10-year survival probability of only 5.8% (95% CI = 1.5% to 22.2%, two-sided P < .001).
Conclusions: Using a unique large copy number data set of high-risk neuroblastoma cases, we identified a small subset of high-risk neuroblastoma patients with extremely low survival probability that might be eligible for inclusion in clinical trials of new therapeutics. The amplicons may also nominate alternative treatments that target the amplified genes.
Figures
Similar articles
-
Age dependence of tumor genetics in unfavorable neuroblastoma: arrayCGH profiles of 34 consecutive cases, using a Swedish 25-year neuroblastoma cohort for validation.BMC Cancer. 2013 May 9;13:231. doi: 10.1186/1471-2407-13-231. BMC Cancer. 2013. PMID: 23656755 Free PMC article.
-
Clinical evaluation of integrated panel testing by next-generation sequencing for somatic mutations in neuroblastomas with MYCN unamplification.Oncotarget. 2017 Jul 25;8(30):49689-49701. doi: 10.18632/oncotarget.17917. Oncotarget. 2017. PMID: 28591696 Free PMC article.
-
FISH analyses for alterations in chromosomes 1, 2, 3, and 11 define high-risk groups in neuroblastoma.Med Pediatr Oncol. 2003 Jul;41(1):30-5. doi: 10.1002/mpo.10313. Med Pediatr Oncol. 2003. PMID: 12764740
-
Risk estimation of neuroblastoma patients using molecular markers.Klin Padiatr. 2008 May-Jun;220(3):137-46. doi: 10.1055/s-2008-1065345. Klin Padiatr. 2008. PMID: 18478485 Review.
-
Neuroblastoma: biology and staging.Curr Oncol Rep. 2009 Nov;11(6):431-8. doi: 10.1007/s11912-009-0059-6. Curr Oncol Rep. 2009. PMID: 19840520 Review.
Cited by
-
Bioinformatics analysis of recurrent deletion regions in neuroblastoma.Med Oncol. 2022 Jan 20;39(3):31. doi: 10.1007/s12032-021-01639-y. Med Oncol. 2022. PMID: 35059899
-
High-dose DFMO alters protein translation in neuroblastoma.Neoplasia. 2025 Oct;68:101215. doi: 10.1016/j.neo.2025.101215. Epub 2025 Aug 6. Neoplasia. 2025. PMID: 40774224 Free PMC article.
-
MEIS2 Is an Adrenergic Core Regulatory Transcription Factor Involved in Early Initiation of TH-MYCN-Driven Neuroblastoma Formation.Cancers (Basel). 2021 Sep 24;13(19):4783. doi: 10.3390/cancers13194783. Cancers (Basel). 2021. PMID: 34638267 Free PMC article.
-
Kinome multigenic panel identified novel druggable EPHB4-V871I somatic variant in high-risk neuroblastoma.J Cell Mol Med. 2020 Jun;24(11):6459-6471. doi: 10.1111/jcmm.15297. Epub 2020 Apr 26. J Cell Mol Med. 2020. PMID: 32336043 Free PMC article.
-
Revised Neuroblastoma Risk Classification System: A Report From the Children's Oncology Group.J Clin Oncol. 2021 Oct 10;39(29):3229-3241. doi: 10.1200/JCO.21.00278. Epub 2021 Jul 28. J Clin Oncol. 2021. PMID: 34319759 Free PMC article.
References
-
- Westermann F, Schwab M.. Genetic parameters of neuroblastomas. Cancer Lett. 2002;1842:127–147. - PubMed
Publication types
MeSH terms
Substances
Grants and funding
LinkOut - more resources
Full Text Sources
Other Literature Sources
Medical
Molecular Biology Databases
