

The Entamoeba histolytica TBP and TRF1 transcription factors are GAAC-box binding proteins, which display differential gene expression under different stress stimuli and during the interaction with mammalian cells
- PMID: 29514716
- PMCID: PMC5842622
- DOI: 10.1186/s13071-018-2698-7
The Entamoeba histolytica TBP and TRF1 transcription factors are GAAC-box binding proteins, which display differential gene expression under different stress stimuli and during the interaction with mammalian cells
Abstract
Background: Entamoeba histolytica is the protozoan parasite responsible for human amebiasis. It causes up to 100,000 deaths worldwide each year. This parasite has two closely related basal transcription factors, the TATA-box binding protein (EhTBP) and the TBP-related factor 1 (EhTRF1). TBP binds to the canonical TATTTAAA-box, as well as to different TATA variants. TRF1 also binds to the TATTTAAA-box. However, their binding capacity to diverse core promoter elements, including the GAAC-element, and their role in gene regulation in this parasite remains unknown.
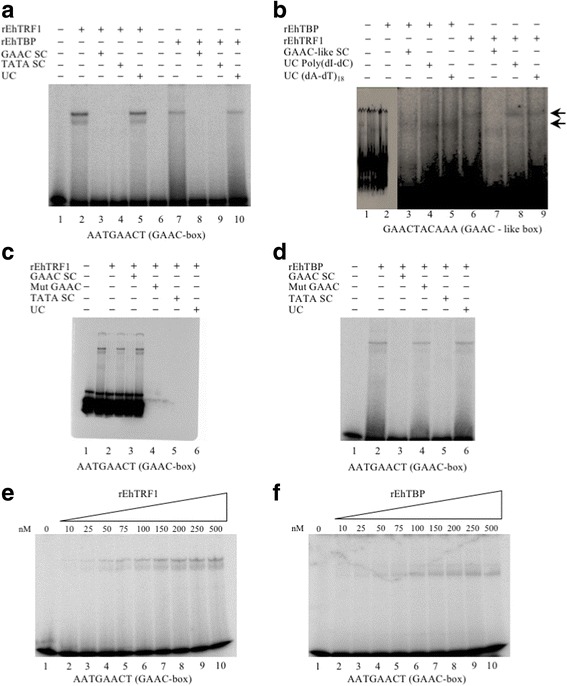
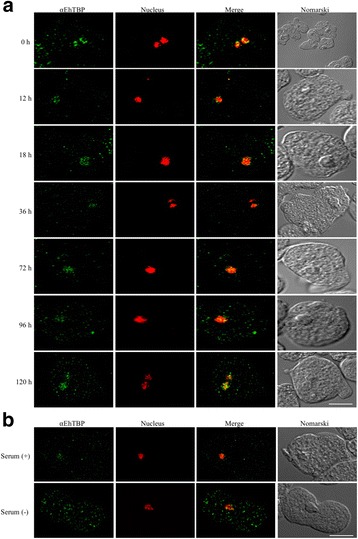
Methods: EMSA experiments were performed to determine the binding capacity of recombinant TBP and TRF1 to TATA variants, GAAC and GAAC-like boxes. For the functional analysis under different stress stimuli (e.g. growth curve, serum depletion, heat-shock, and UV-irradiation) and during the interaction with mammalian cells (erythrocytes, MDCK cell monolayers, and hepatocytes of hamsters), RT-qPCR, and gene knockdown were performed.
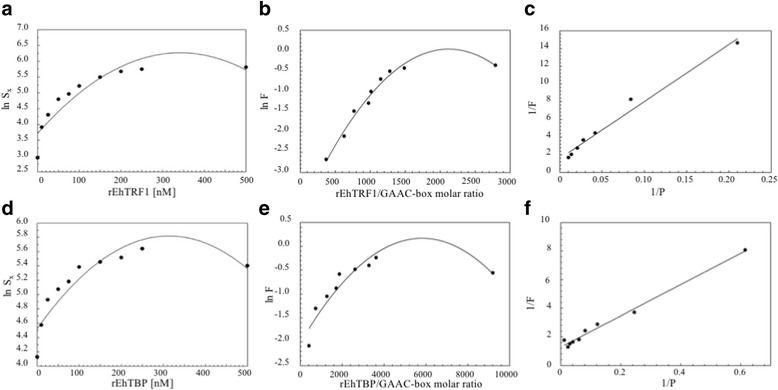
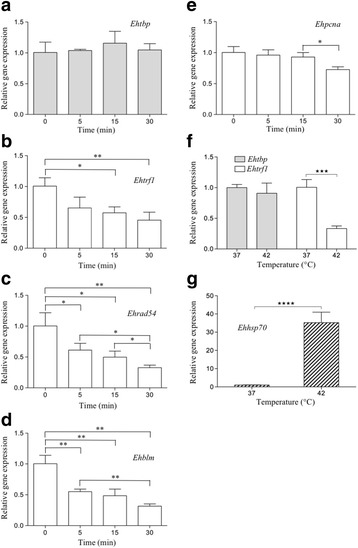
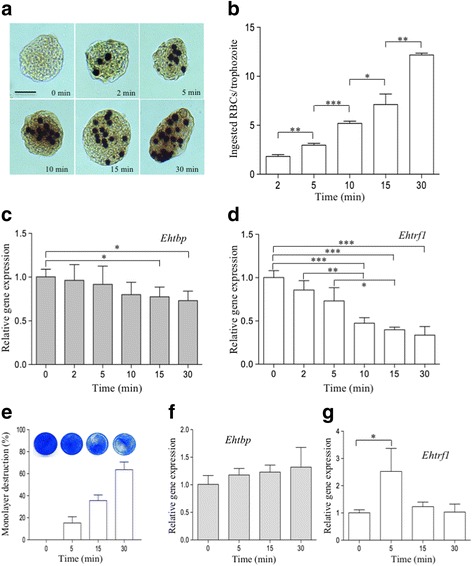
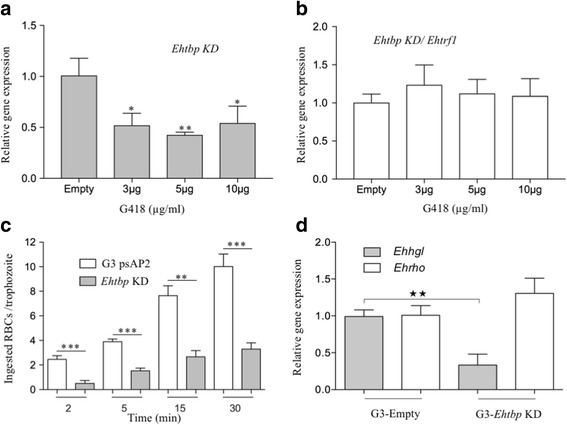
Results: Both transcription factors bound to the different TATA variants tested, as well as to the GAAC-boxes, suggesting that they are GAAC-box-binding proteins. The K D values determined for TBP and TRF1 for the different TATA variants and GAAC-box were in the range of 10-12 M to 10-11 M. During the death phase of growth or in serum depletion, Ehtbp mRNA levels significantly increased, whereas the mRNA level of Ehtrf1 did not change under these conditions. Ehtrf1 gene expression was negatively regulated by UV-irradiation and heat-shock stress, with no changes in Ehtbp gene expression. Moreover, Ehtrf1 gene also showed a negative regulation during erythrophagocytosis, liver abscess formation, and a transient expression level increase at the initial phase of MDCK cell destruction. Finally, the Ehtbp gene knockdown displayed a drastic decrease in the efficiency of erythrophagocytosis in G3 trophozoites.
Conclusions: To our knowledge, this study reveals that these basal transcription factors are able to bind multiple core promoter elements. However, their immediate change in gene expression level in response to different stimuli, as well as during the interaction with mammalian cells, and the diminishing of erythrophagocytosis by silencing the Ehtbp gene indicate the different physiological roles of these transcription factors in E. histolytica.
Keywords: Different stress stimuli; Differential gene expression; EhTBP; EhTRF1; Entamoeba histolytica; GAAC-box mutation; Gene knockdown.
Conflict of interest statement
Ethics approval and consent to participate
The Institutional Animal Care and Use Committee (IACUC) ethics committee reviewed and approved the animal care and use of hamsters in in vivo experiments. The institutional animal breeding facility fulfills the international regulations for the animal use and care (CINVESTAV Approval Number: BOO.02.03.02.01.908).
Consent for publication
Not applicable.
Competing interests
The authors declare that they have no competing interests.
Publisher’s Note
Springer Nature remains neutral with regard to jurisdictional claims in published maps and institutional affiliations.
Figures


Similar articles
-
Identification of the gene encoding the TATA box-binding protein-associated factor 1 (TAF1) and its putative role in the heat shock response in the protozoan parasite Entamoeba histolytica.Parasitol Res. 2019 Feb;118(2):517-538. doi: 10.1007/s00436-018-6170-6. Epub 2018 Dec 15. Parasitol Res. 2019. PMID: 30552577
-
Entamoeba histolytica: a unicellular organism containing two active genes encoding for members of the TBP family.Protein Expr Purif. 2010 Mar;70(1):48-59. doi: 10.1016/j.pep.2009.12.007. Epub 2009 Dec 21. Protein Expr Purif. 2010. PMID: 20026212
-
Entamoeba histolytica TATA-box binding protein binds to different TATA variants in vitro.FEBS J. 2005 Mar;272(6):1354-66. doi: 10.1111/j.1742-4658.2005.04566.x. FEBS J. 2005. PMID: 15752353
-
The highly diverse TATA box-binding proteins among protists: A review.Mol Biochem Parasitol. 2020 Sep;239:111312. doi: 10.1016/j.molbiopara.2020.111312. Epub 2020 Aug 6. Mol Biochem Parasitol. 2020. PMID: 32771681 Review.
-
TATA box polymorphisms in human gene promoters and associated hereditary pathologies.Biochemistry (Mosc). 2009 Feb;74(2):117-29. doi: 10.1134/s0006297909020011. Biochemistry (Mosc). 2009. PMID: 19267666 Review.
Cited by
-
Entamoeba stage conversion: progress and new insights.Curr Opin Microbiol. 2020 Dec;58:62-68. doi: 10.1016/j.mib.2020.09.005. Epub 2020 Oct 6. Curr Opin Microbiol. 2020. PMID: 33032142 Free PMC article. Review.
-
Target acquired: transcriptional regulators as drug targets for protozoan parasites.Int J Parasitol. 2021 Jul;51(8):599-611. doi: 10.1016/j.ijpara.2020.12.007. Epub 2021 Mar 13. Int J Parasitol. 2021. PMID: 33722681 Free PMC article. Review.
-
Identification of the gene encoding the TATA box-binding protein-associated factor 1 (TAF1) and its putative role in the heat shock response in the protozoan parasite Entamoeba histolytica.Parasitol Res. 2019 Feb;118(2):517-538. doi: 10.1007/s00436-018-6170-6. Epub 2018 Dec 15. Parasitol Res. 2019. PMID: 30552577
-
Promoter-Bound Full-Length Intronic Circular RNAs-RNA Polymerase II Complexes Regulate Gene Expression in the Human Parasite Entamoeba histolytica.Noncoding RNA. 2022 Jan 27;8(1):12. doi: 10.3390/ncrna8010012. Noncoding RNA. 2022. PMID: 35202086 Free PMC article.
-
Anaerobic peroxisomes in Entamoeba histolytica metabolize myo-inositol.PLoS Pathog. 2021 Nov 15;17(11):e1010041. doi: 10.1371/journal.ppat.1010041. eCollection 2021 Nov. PLoS Pathog. 2021. PMID: 34780573 Free PMC article.
References
Publication types
MeSH terms
Substances
Grants and funding
LinkOut - more resources
Full Text Sources
Other Literature Sources
