. 2018 Mar 13;2(5):534-548.
doi: 10.1182/bloodadvances.2017013599.

Sipa1 deficiency-induced bone marrow niche alterations lead to the initiation of myeloproliferative neoplasm

Affiliations

Sipa1 deficiency-induced bone marrow niche alterations lead to the initiation of myeloproliferative neoplasm

Pingnan Xiao et al. Blood Adv. .

Abstract

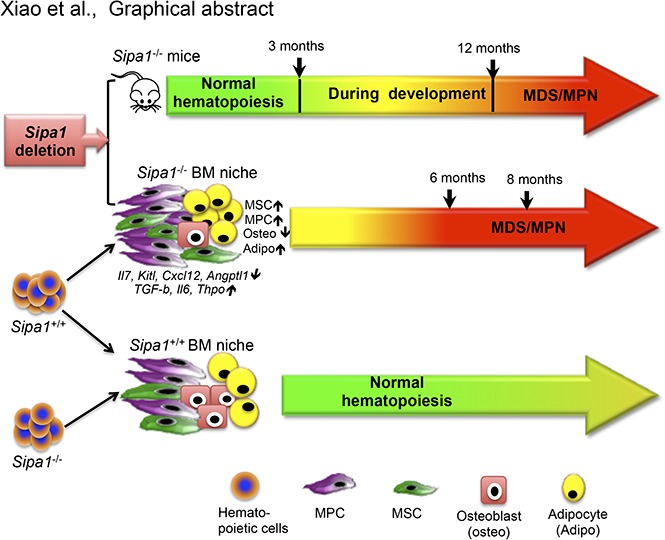
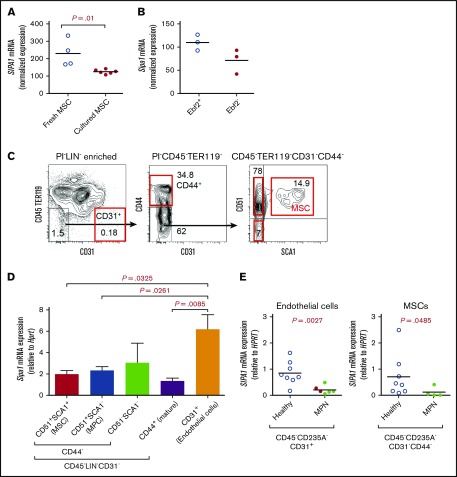
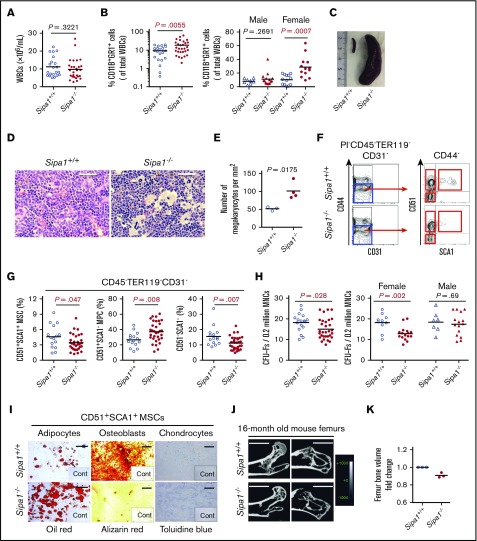
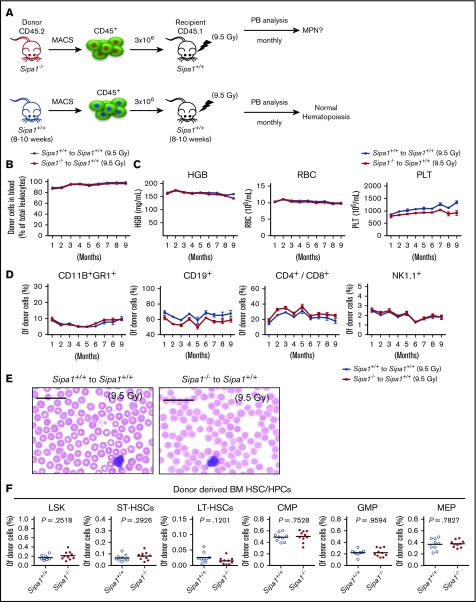
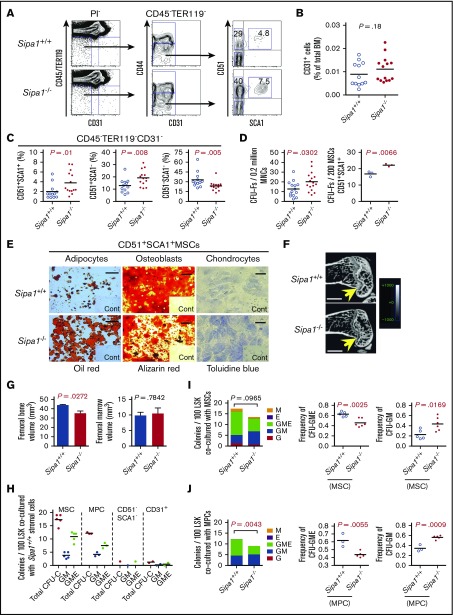
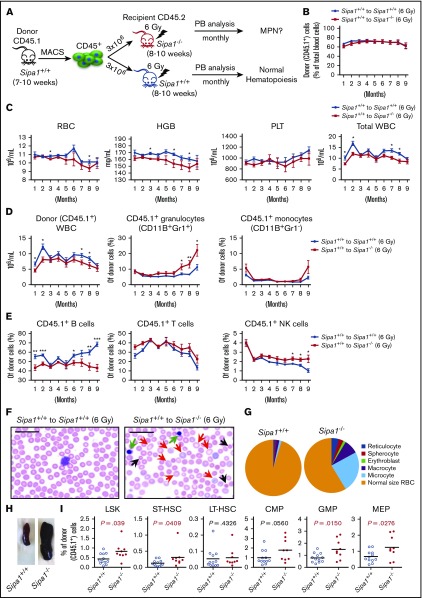
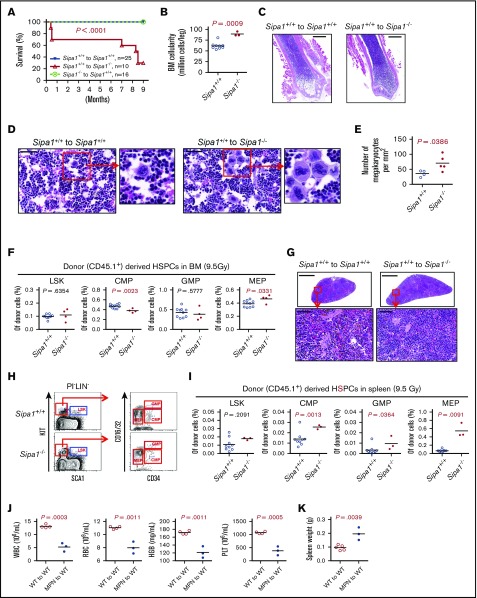
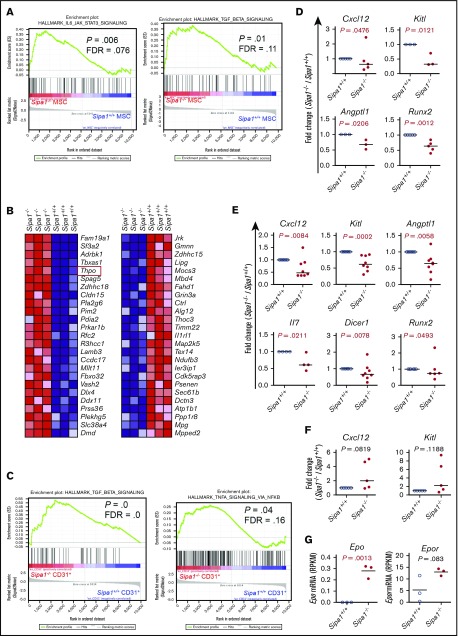
Mutations of signal-induced proliferation-associated gene 1 (SIPA1), a RAP1 GTPase-activating protein, were reported in patients with juvenile myelomonocytic leukemia, a childhood myelodysplastic/myeloproliferative neoplasm (MDS/MPN). Sipa1 deficiency in mice leads to the development of age-dependent MPN. However, Sipa1 expression in bone marrow (BM) microenvironment and its effect on the pathogenesis of MPN remain unclear. We here report that Sipa1 is expressed in human and mouse BM stromal cells and downregulated in these cells from patients with MPN or MDS/MPN at diagnosis. By using the Sipa1-/- MPN mouse model, we find that Sipa1 deletion causes phenotypic and functional alterations of BM mesenchymal stem and progenitor cells prior to the initiation of the MPN. Importantly, the altered Sipa1-/- BM niche is required for the development of MDS/MPN following transplantation of normal hematopoietic cells. RNA sequencing reveals an enhanced inflammatory cytokine signaling and dysregulated Dicer1, Kitl, Angptl1, Cxcl12, and Thpo in the Sipa1-/- BM cellular niches. Our data suggest that Sipa1 expression in the BM niche is critical for maintaining BM niche homeostasis. Moreover, Sipa1 loss-induced BM niche alterations likely enable evolution of clonal hematopoiesis to the hematological malignancies. Therefore, restoring Sipa1 expression or modulating the altered signaling pathways involved might offer therapeutic potential for MPN.


Conflict of interest statement

Conflict-of-interest disclosure: The authors declare no competing financial interests.

Figures

None
Graphical abstract
Figure 1.
Figure 1.
Sipa1 is expressed in BM mesenchymal cells and downregulated in the stromal cells from patients with MPN. (A-B) Microarray analysis showed SIPA1 gene expression in native and culture-expanded BM MSCs of healthy donors (A) and mice (B). The data on SIPA1 expression in human MSCs were extracted from 2 independent experiments previously done on the freshly sorted CD45CD235ACD31CD44 cells and the culture-expanded MSCs. The data on Sipa1 expression in the Ebf2+ MSCs were from 3 independent experiments. The expression in mouse cells was normalized to 4 housekeeping genes, including Gapdh, β-Actin, Transferrin Receptor, Pyruvate Carboxylase, in mouse cells and to 3 housekeeping genes, including GAPDH, β-Actin, ISGF-3 (STAT1), in human cells by DNA-Chip analyzer (dChip) analysis, as described., (C) FACS profiles showing the gating strategy for sorting of SCA1+CD51+ MSCs, SCA1CD51+ MPCs, and the more mature SCA1CD51 stromal cells from young adult mouse BM. The cells were first gated within CD45TER119CD31CD44 cells, and then the CD31+ endothelial cells and the CD44+ mature stromal cells were gated within the CD45TER119 cells as indicated. (D) qPCR analysis of Sipa1 messenger RNA (mRNA) expression in the BM stromal cell subsets. Data are mean ± standard error of the mean (SEM), from 5 independent experiments. Hprt was used to normalize the expression. P values were calculated by unpaired Student t test. (E) qPCR analysis revealed downregulation of SIPA1 expression in the BM endothelial cells and MSCs of newly diagnosed patients with CML, CNL, and CMML. P values between the patients and the age-matched healthy controls were tested by unpaired Mann-Whitney U test. HPRT was used to normalize the expression. Red dot indicates CMML and CNL samples.
Figure 2.
Figure 2.
Myeloproliferation and altered BM niches in aged Sipa1−/− MPN mice. The PB, BM, and spleen from the age- and sex-matched aged (16-17 months old) Sipa1+/+ and Sipa1−/− mice were collected for analyzing both hematopoiesis and BM niches. Statistical analysis was performed by unpaired Mann-Whitney U test. (A) Total white blood cells (WBCs) in 16-month-old Sipa1+/+ and Sipa1−/− mice. (B) Myeloid cells in the PB of the Sipa1+/+ and Sipa1−/− male and female mice. (C) A representative splenomegaly (right) of the aged Sipa1−/− mice. (D) Hematoxylin and eosin (H&E) staining of dysplastic MKs in the Sipa1−/− mouse BM. Scale bars represent 50 μm. (E) The increased numbers of MKs in the Sipa1−/− mouse BM. The data are expressed as numbers per squared millimeters. (F) FACS profiles for phenotypic analysis of BM stromal cells in the Sipa1+/+ and Sipa1−/− mice. The CD44 cells were first gated within CD45TER119CD31 cells and then subdivided into SCA1+CD51+ MSCs, SCA1CD51+ MPCs, and SCA1CD51 mature stromal cells. (G) Altered stromal cell composition in the BM of 16-month-old Sipa1−/− mice. Data are percent of the cells within total CD45TER119CD31 cells from 8 independent experiments. (H) CFU-F frequencies in whole BM cells. The right panel shows the difference in the frequencies of CFU-Fs observed between the female or male Sipa1+/+ and Sipa1−/− mice. (I) Multilineage differentiation potentials of the Sipa1−/− BM MSCs. Scale bars represent 250 μm (left), 500 μm (middle), and 100 μm (right). n = 3 independent sorting experiments. (J) μCT images of femurs in the aged Sipa1+/+ and Sipa1−/− female mice. Scale bars represent 1.0 mm. (K) Femoral bone volumes of Sipa1+/+ and Sipa1−/− mice. The statistical difference was determined by Mann-Whitney U test (A) or unpaired Student t test (B-E,G-H). See also supplemental Figure 1. Cont, control.
Figure 3.
Figure 3.
Sipa1−/− hematopoietic cells failed to develop any hematological disorders after transplantation into young Sipa1+/+mice. (A) Transplantation setup. The CD45.2+ cells from 8- to 10-week-old Sipa1+/+ or Sipa1−/− mouse BM were transplanted into lethally irradiated CD45.1 Sipa1+/+ recipient mice (8-10 weeks old). Donor-derived lineages in the PB were analyzed by FACS monthly after transplantation. (B) Total donor engraftment in the recipient PB. (C) Red blood cells (RBC), hemoglobin (HGB), and platelets (PLT) in the recipient PB. (D) FACS analysis of blood lineage reconstitution after transplantation. The data are mean ± SEM, from 2 independent experiments, n = 9 to 10 per group. (E) H&E staining of PB smears of the Sipa1+/+ recipients 9 months after transplantation of donor Sipa1−/− or Sipa1+/+ BM CD45.2+ cells. Scale bars represent 25 μm. (F) Reconstitution of HSPCs in the recipient BM 9 months after transplantation. CMP, common myeloid progenitor; LT-HSCs, long-term HSCs; ST-HSCs, short-term HSCs.
Figure 4.
Figure 4.
Phenotypic and functional alterations of BM mesenchymal cells in the Sipa1−/− mice prior to the initiation of MPN. (A) Representative FACS profiles of the analysis of BM stromal cells subsets in 3-month-old Sipa1+/+ and Sipa1−/− mice. The CD45TER119CD31PI cells were first divided into the CD44 and CD44+ cells. The SCA1+CD51+ MSCs, SCA1+CD51 MPCs, and SCA1CD51 cells were subsequently gated within the CD44 cells. (B) The frequency of CD31+ cells in the Sipa1+/+ and Sipa1−/− mouse BM. (C) The percent of the MSCs, MPCs, and the SCA1CD51 cells within total CD45TER119CD31 stromal cells. The data are from 3 independent experiments. (D) CFU-F frequencies in Sipa1+/+ and Sipa1−/− mouse BM MNCs and FACS-sorted MSCs. (E) Multilineage differentiation potentials of MSCs from Sipa1+/+ and Sipa1−/− BM. Scale bars represent 250 μm (left), 500 μm (middle), and 50 μm (right). n = 3 independent sorting experiments. (F) Representative μCT images of the longitudinal femoral section indicating reduced bone mass of Sipa1−/− mouse femurs. Scale bars represent 1.0 mm. (G) Femoral bone (left) and marrow (right) volumes of Sipa1+/+ and Sipa1−/− mice. n = 3 per group of each genotype. (H) Colony-forming unit in culture (CFU-C) colonies derived from 100 LSK cells cocultured with Sipa1+/+ BM MSC, MPC, CD51SCA1 mature stromal cells and endothelial cells. Total CFU-C, colonies with GM, G, M, erythrocytes (E), and GME lineages were counted. (I-J) The numbers of CFU-C colonies per 100 LSK cells after coculture with Sipa1+/+ and Sipa1−/− MSC (I) and MPC (J). Data were collected from 2 to 3 independent experiments. The statistical difference was determined by unpaired Student t test. See also in supplemental Figure 2.
Figure 5.
Figure 5.
Sipa1−/− niche induces MDS/MPN from normal hematopoietic cells after transplantation following sublethal irradiation. (A) Experimental design, normal hematopoietic cells. Three million normal BM CD45.1+ cells from a 7- to 10-week-old Sipa1+/+ mouse were sorted by magnetic-activated cell sorting (MACS) and transplanted into sublethally irradiated CD45.2+ young (8-10 week old) Sipa1+/+ and Sipa1−/− recipient mice. The PB of the recipients was monitored monthly after transplantation. (B) Total donor-derived blood reconstitution in the Sipa1+/+ and Sipa1−/− recipients after transplantation. Data are mean ± SEM, from 2 independent experiments, n = 12 Sipa1+/+ recipients and n = 10 Sipa1−/− recipients. (C) RBCs, HGB, PLTs, and total WBCs in the recipient PB. The PB was analyzed monthly for monitoring the development of the disorders in the PB of the sublethally irradiated Sipa1+/+ and Sipa1−/− recipients after transplantation. (D) Donor-derived WBC and myeloid cells in Sipa1+/+ and Sipa1−/− mice after transplantation. (E) Donor-derived B cells, T cells, and natural killer cells in the Sipa1+/+ and Sipa1−/− mice after transplantation. (F) H&E staining of PB smears of the Sipa1+/+ and Sipa1−/− recipients 9 months after transplantation. Scale bars represent 25 μm. Black arrows indicate microcytes; red arrows indicate macrocytes, and green arrows indicate erythroblasts, respectively. (G) Distribution of reticulocytes, macrocytes, microcytes, spherocytes, erythroblasts, and normal size RBC. (H) Splenomegaly in the Sipa1−/− recipients 6 to 9 months after transplantation. (I) Enhanced expansion of donor-derived HSPCs in the recipient Sipa1−/− BM 9 months after transplantation. The donor-derived (CD45.1+) HSCs and HPCs were calculated in total BM Lineage (LIN) cells. *P < .05; **P < .01; ***P < .001, analyzed by unpaired Mann-Whitney U test. See also in supplemental Figure 3.
Figure 6.
Figure 6.
Development of lethal MDS/MPN in the lethally irradiated Sipa1−/− recipients. Three million normal BM CD45.1+ cells from 8- to 9-week-old Sipa1+/+ mice were transplanted into lethally irradiated CD45.2+ young (8-10 week old) Sipa1+/+ and Sipa1−/− recipient mice. (A) Kaplan-Meier survival curves of the lethally irradiated Sipa1+/+ and Sipa1−/− recipients after transplantation. The statistic difference was determined by Logrank Mantel Cox test. (B) The total BM cellularity 9 months after the transplantation. (C) Representative H&E-stained femoral sections showed increased leukocytes infiltration in the BM from the Sipa1−/− recipients. Scale bars represent 1.0 mm. (D) Representative H&E-stained femoral sections showed increased MKs in the BM of the Sipa1−/− recipient mice. Scale bars represent 50 μm (black) and 25 μm (white). (E) The increased numbers of MKs in the Sipa1−/− recipient bone sections. The data are expressed as numbers per squared millimeters. (F) The frequencies of HSPCs in the recipient BM at the endpoint of the experiments. (G) H&E-stained spleen sections of Sipa1+/+ and Sipa1−/− recipients 9 months after transplantation. Scale bars represent 1.0 mm for the upper panels and 50 μm for the lower panels. (H) Representative FACS profile showing gating strategy for HSPCs in spleen of Sipa1+/+ and Sipa1−/− recipients 7 to 9 months after transplantation. (I) Frequencies of HSPCs in spleens of the Sipa1+/+ and Sipa1−/− recipients. (J) Reduced mature blood cells in the PB of secondary recipients 6 months after transplantation of the spleen cells from a primary Sipa1−/− recipient with MPN. (K) The spleen weight of the secondary recipient mice 6 months after transplantation. The statistical differences in panels B-K were determined by nonparametric Mann-Whitney U test or parametric Student t test with Welch’s correction according the data distribution. See also in supplemental Figure 4. KIT, CD117 or Proto-Oncogene C-Kit; WT, wild type.
Figure 7.
Figure 7.
Altered molecular profiles of BM stromal cell subsets in Sipa1−/−young adult mice. Gene set enrichment analysis was carried out on the RNA-sequencing data to identify differentially expressed genes in the Sipa1−/− stromal cells. The RNA sequencing was performed on FACS-sorted BM MSCs, MPCs, and endothelial cells from 2 to 3-month-old mice. Data were from 3 independent experiments. False discovery rate-q value represents the false discovery rate of the P value. (A) Upregulated IL-6/JAK2/STAT3 and TGF-β signaling pathways in the Sipa1−/− MSCs vs Sipa1+/+ MSCs. (B) The top 25 altered genes in the Sipa1−/− MPCs relative to that in the Sipa1+/+ mice. The red frame highlights Thpo gene. Red indicates high expression, and blue indicates low expression. (C) Enhanced TGF-β and TNF-α signaling in the Sipa1−/− endothelial cells. (D) qPCR analysis of Kitl, Angptl1, Cxcl12, and Runx2 expressions in Sipa1+/+ and Sipa1−/− MSCs. (E) qPCR analysis of Kitl, Angptl1, Il7, Cxcl12, Dicer1, and Runx2 expressions in Sipa1+/+ and Sipa1−/− MPCs. (F) qPCR analysis of Kitl and Cxcl12 expressions in Sipa1+/+ and Sipa1−/− endothelial cells. The statistical differences in panels D-F were analyzed by unpaired Mann-Whitney U test or Kolmogorov-Smirnov test. (G) RNA sequencing revealed upregulation of Epo and Epor in the Sipa1−/− endothelial cells. P values were calculated by unpaired Student t test. See also in supplemental Figures 5 and 6.

Similar articles

Cited by

References

    1. Schofield R. The relationship between the spleen colony-forming cell and the haemopoietic stem cell. Blood Cells. 1978;4(1-2):7-25. - PubMed
    1. Hoggatt J, Kfoury Y, Scadden DT. Hematopoietic stem cell niche in health and disease. Annu Rev Pathol. 2016;11:555-581. - PubMed
    1. Boulais PE, Frenette PS. Making sense of hematopoietic stem cell niches. Blood. 2015;125(17):2621-2629. - PMC - PubMed
    1. Pittenger MF, Mackay AM, Beck SC, et al. . Multilineage potential of adult human mesenchymal stem cells. Science. 1999;284(5411):143-147. - PubMed
    1. Omatsu Y, Sugiyama T, Kohara H, et al. . The essential functions of adipo-osteogenic progenitors as the hematopoietic stem and progenitor cell niche. Immunity. 2010;33(3):387-399. - PubMed

Publication types