Review
. 2018 Apr 2;150(4):521-537.
doi: 10.1085/jgp.201711959. Epub 2018 Mar 7.

Calcium-induced release of calcium in muscle: 50 years of work and the emerging consensus

Affiliations
Review

Calcium-induced release of calcium in muscle: 50 years of work and the emerging consensus

Eduardo Ríos. J Gen Physiol. .

Abstract

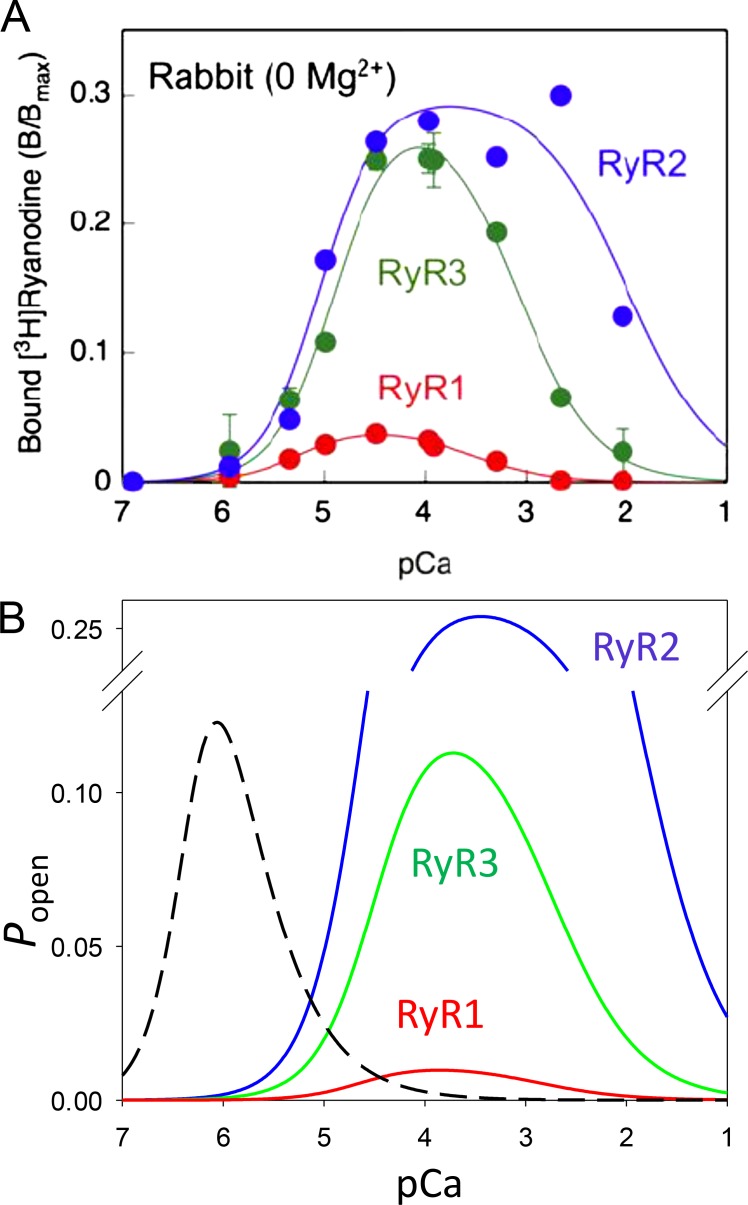
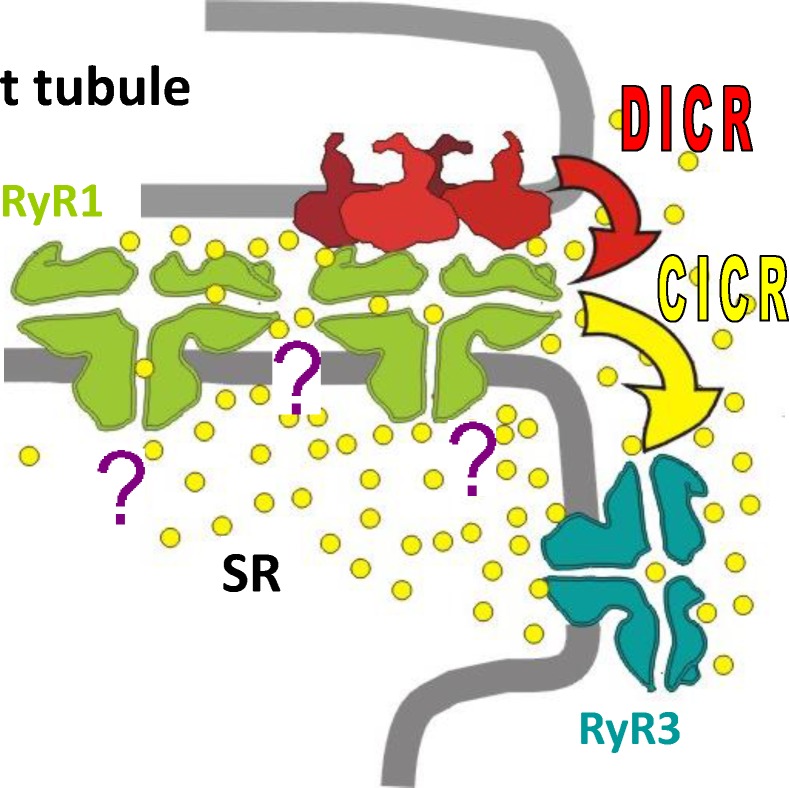
Ryanodine-sensitive intracellular Ca2+ channels (RyRs) open upon binding Ca2+ at cytosolic-facing sites. This results in concerted, self-reinforcing opening of RyRs clustered in specialized regions on the membranes of Ca2+ storage organelles (endoplasmic reticulum and sarcoplasmic reticulum), a process that produces Ca2+-induced Ca2+ release (CICR). The process is optimized to achieve large but brief and localized increases in cytosolic Ca2+ concentration, a feature now believed to be critical for encoding the multiplicity of signals conveyed by this ion. In this paper, I trace the path of research that led to a consensus on the physiological significance of CICR in skeletal muscle, beginning with its discovery. I focus on the approaches that were developed to quantify the contribution of CICR to the Ca2+ increase that results in contraction, as opposed to the flux activated directly by membrane depolarization (depolarization-induced Ca2+ release [DICR]). Although the emerging consensus is that CICR plays an important role alongside DICR in most taxa, its contribution in most mammalian muscles appears to be limited to embryogenesis. Finally, I survey the relevance of CICR, confirmed or plausible, to pathogenesis as well as the multiple questions about activation of release channels that remain unanswered after 50 years.


Figures

Figure 1.
Figure 1.
Ca2+ dependence of channel open probability of the three RyR isoforms. Ca2+ dependence measured by ryanodine binding to rabbit muscle preparations. (A) Data and fits by Eq. 2 in the absence of extracellular-side Mg2+. (B) Best fits in 1 mM Mg2+. Data from Murayama and Kurebayashi (2011); fit parameters listed with their Fig. 2. The dashed curve in B represents the best fit to rate constants of Ca2+ release from cardiac SR vesicles, measured with stopped-flow mixing by Sánchez et al. (2003) in the absence of Mg2+. The equation is k=kmax[Ca2+]naKiniKanaKini+[Ca2+]naKini+[Ca2+]niKana,with parameter values given in their Fig. 5.
Figure 2.
Figure 2.
The relative placement of RyRs and CaVs in muscle. (A) Thin section showing double rows of “feet” (RyRs). (B) Freeze fracture of SR membrane, again showing feet. (C) Freeze fracture of t tubule membrane. (D) Interpretation by Block et al. (1988) and proposed correspondence between components of release flux and contributions by either V channels (linked to sensors and therefore assumed to engage in DICR) or C channels (assumed to activate by CICR and rapidly undergo CDI). A–C, previously unpublished, are a gift from C. Franzini-Armstrong. D recasts drawings by Ríos and Pizarro (1988).
Figure 3.
Figure 3.
Voltage dependence of the ratio of release flux measures. Flux measures P (peak) and S (steady) are defined in Fig. 2. (A) Measured ratios P/S in frog and rat muscle. (B) A model in which the peak component is attributed to flux through C channels activated by Ca2+ domains near open V channels. The graphs illustrate components provided by three open V channels (thick lines) and their sum (thin lines). C channels open when [Ca2+] goes above a threshold level (dashed line). (C) The model accounted qualitatively for the modal dependence P/S (Vm) in frog muscle (open circles). A simple change in parameters that made the C channels less excitable did not fully account for the qualitative characteristics of the dependence in the rat (filled circles). Details in Shirokova et al. (1996).
Figure 4.
Figure 4.
Self-consistent simulation of a hybrid DICR–CICR model of Ca2+ release. (A) Geometry. Ca2+ is released via alternating V and C RyRs in double rows. Local [Ca2+] is determined by Ca2+ diffusing inside a junctional gap and surrounding wide cytosol. (B) A diagram depicts the model for activation and inactivation of C channels. V channels depend on Vm according to a quantitative allosteric scheme (Ríos et al., 1993). They are assumed not to inactivate. (C) Successive snapshots of the array of channels in one Monte Carlo realization. An event started at 0 ms with voltage activation of two channels progresses via CICR along the array. The Ca2+ transient associated with this event has spatial and temporal properties of a Ca2+ spark. Note that it was sufficient with the inactivation of one channel ahead of the activation wave to stop its downward progression. From Stern et al. (1997).
Figure 5.
Figure 5.
Ca2+ release near the resting potential. (A) Evolution of total released calcium [CaT] upon application of pulses (top) at Vm near the resting potential. (B) Log of the slope of plots in A versus applied voltage. The slope (3.7 mV)−1 corresponds to an effective sensing charge of 6.7 e. At Vm greater than −55 mV, the slope was reported to diminish. From Pape et al. (1995).
Figure 6.
Figure 6.
The effect of a fast Ca2+ buffer on calculated Ca2+ release flux. (A) Flux calculated by Jacquemond et al. (1991) from cytosolic Ca2+ transients measured in frog myofibers before and after injection of BAPTA. (B) Reference record from A with superimposed lines depicting predictions of the records that would result if BAPTA abolished inactivation (orange) or activation by Ca2+ (blue). The calculations of flux by Jacquemond et al. (1991) are consistent with abolition of CICR.
Figure 7.
Figure 7.
The effect of BAPTA on Vm-elicited flux is strongly dependent on the applied voltage. Δ[CaEGTA] measures total Ca released. The difference in amount at −60 mV is nil (BAPTA delays the transfer of released Ca2+ to EGTA). It is maximal at intermediate voltages (−45 mV in this case). This evidence of Vm dependence of a putative CICR component is consistent with the modal Vm dependence of P/S illustrated with Fig. 3. From Pape et al. (2002).
Figure 8.
Figure 8.
Expression of RyR3 in a myofiber from adult mouse. (A) Isolated myofiber held at resting potential under patch clamp. Fluo-4 reveals abortive Ca waves originating at a swollen nucleus (W). Simultaneously, spontaneous sparks (s) appear randomly, exclusively in the fiber segment within the white bracket. (B) Confocal scan along line A–A in A. An applied pulse of −40 mV elicits a response that includes sparks in the segment within the white bracket, but is devoid of sparks in the adjacent segment (cyan bracket). The Ca2+ transient is greater in the segment with sparks (white trace). (C) The calculated Ca2+ release flux includes a peak in the sparking region (black trace) that is not present in the sparkless area (cyan). Modified from Pouvreau et al. (2007).
Figure 9.
Figure 9.
Junctional and parajunctional feet in muscle of young zebrafish embryo. Triads shown in transversal section. (A) EM images. (B) Interpretive colorization. Parajunctional feet, marked purple, disappear upon injection of morpholinos (not depicted in this figure). (C) Average of reference sparks. (D) Average of events in morphant larvae, which are scarce and smaller. Modified from Perni et al. (2015). Bar, 50 nM.
Figure 10.
Figure 10.
CICR in amyotrophic lateral sclerosis. (A) Single myofiber from a reference mouse. (B) Myofibers from a mouse constitutively expressing an amyotrophic lateral sclerosis–linked SOD1 mutation. Absence of tetramethyl rhodamine ethyl ester (TMRE) fluorescence marks segments lacking mitochondrial transmembrane potential. Cytosolic Fluo-4 reveals ECRE in response to osmotic stress. In the mutant, ECRE evolve to global Ca2+ release, which stops at the edge of the damaged segment. (C) MitoTracker staining indicates that mitochondria are present in the damaged regions. Eventually, the lesions progress to mitochondrial destruction. Modified from Zhou et al. (2010).
Figure 11.
Figure 11.
Consensus and questions. RyR1 or α, located exclusively at t–SR junctions, are activated conformationally by CaV1.1 (DICR). RyR3 or β, absent in most mammalian muscles, are located parajunctionally and activated by Ca2+ (CICR). Question marks represent the unknown role of uncoupled junctional RyR1 (C channels), the unconfirmed possibility of allosteric RyR–RyR interactions, and the evolving quest on RyR control from within the SR. Modified from Pouvreau et al. (2007).

Similar articles

Cited by

References

    1. Airey J.A., Beck C.F., Murakami K., Tanksley S.J., Deerinck T.J., Ellisman M.H., and Sutko J.L.. 1990. Identification and localization of two triad junctional foot protein isoforms in mature avian fast twitch skeletal muscle. J. Biol. Chem. 265:14187–14194. - PubMed
    1. Almers W. 1978. Gating currents and charge movements in excitable membranes. Rev. Physiol. Biochem. Pharmacol. 82:96–190. 10.1007/BFb0030498 - DOI - PubMed
    1. Amos W.B., White J.G., and Fordham M.. 1987. Use of confocal imaging in the study of biological structures. Appl. Opt. 26:3239–3243. 10.1364/AO.26.003239 - DOI - PubMed
    1. Anderson K., Cohn A.H., and Meissner G.. 1994. High-affinity [3H]PN200-110 and [3H]ryanodine binding to rabbit and frog skeletal muscle. Am. J. Physiol. 266:C462–C466. 10.1152/ajpcell.1994.266.2.C462 - DOI - PubMed
    1. Apostol S., Ursu D., Lehmann-Horn F., and Melzer W.. 2009. Local calcium signals induced by hyper-osmotic stress in mammalian skeletal muscle cells. J. Muscle Res. Cell Motil. 30:97–109. 10.1007/s10974-009-9179-8 - DOI - PubMed

Publication types