. 2018 Apr 27;92(10):e02181-17.
doi: 10.1128/JVI.02181-17. Print 2018 May 15.

Human T Lymphocytes Are Permissive for Dengue Virus Replication

Affiliations

Human T Lymphocytes Are Permissive for Dengue Virus Replication

Guilherme F Silveira et al. J Virol. .

Abstract

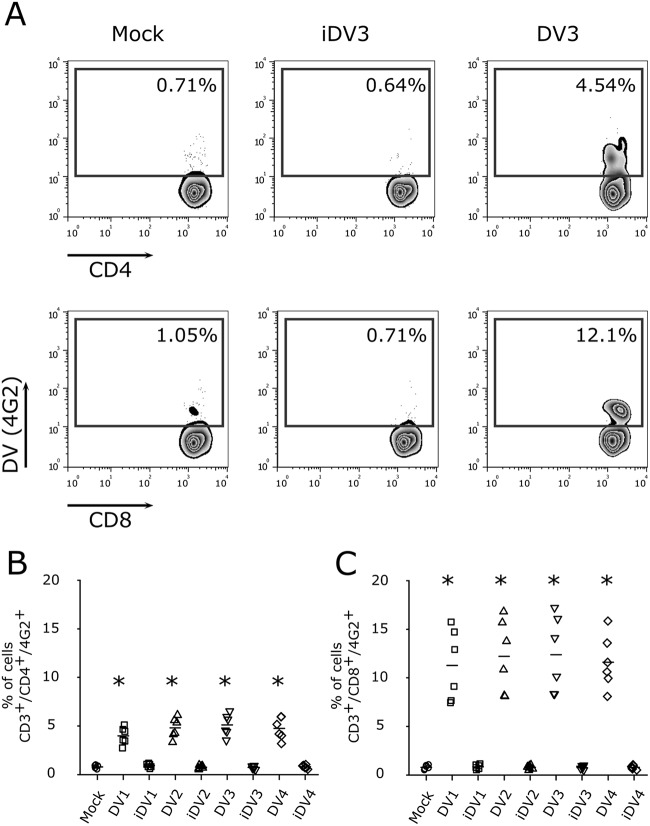
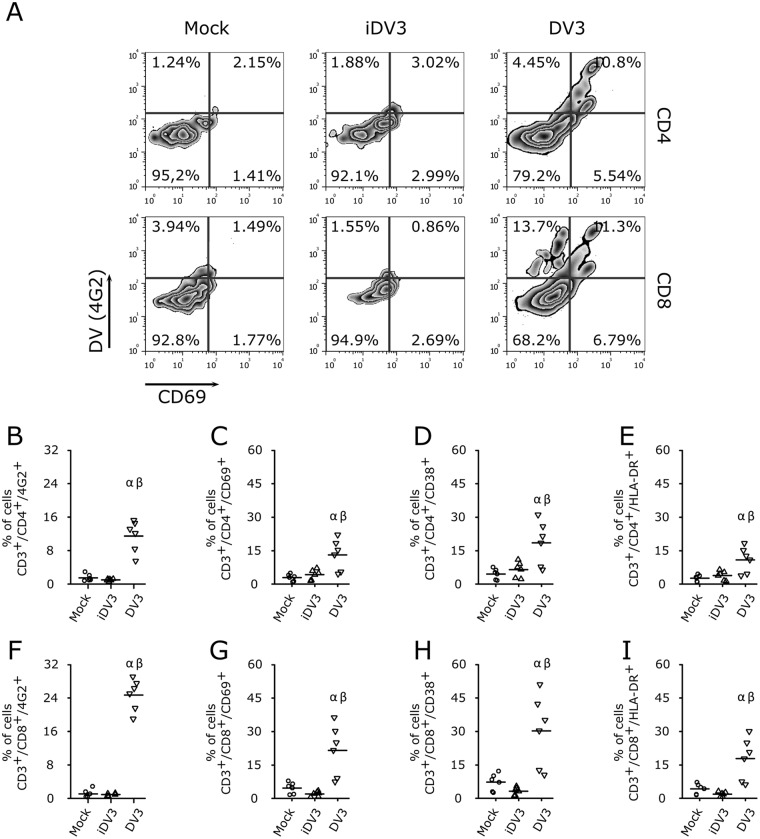
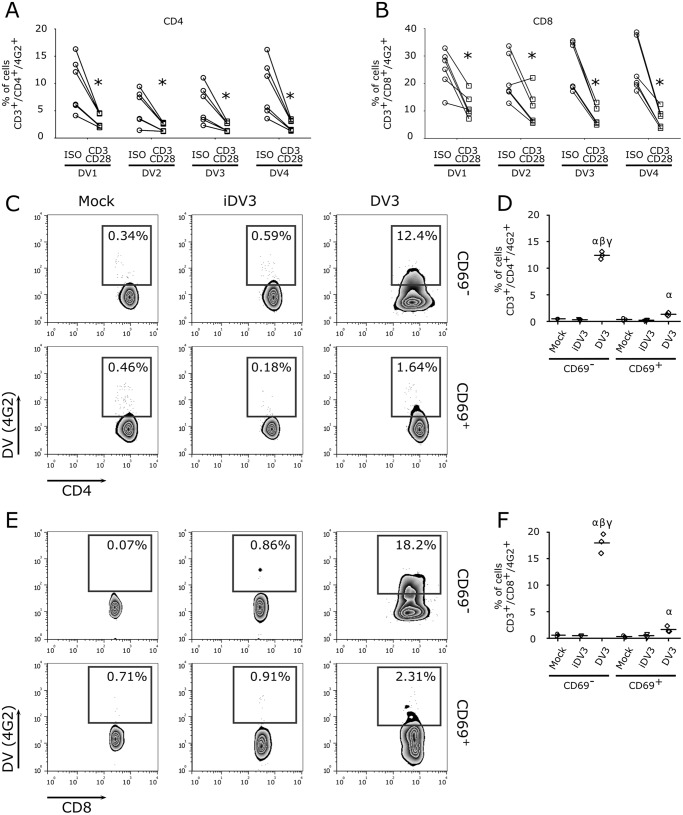
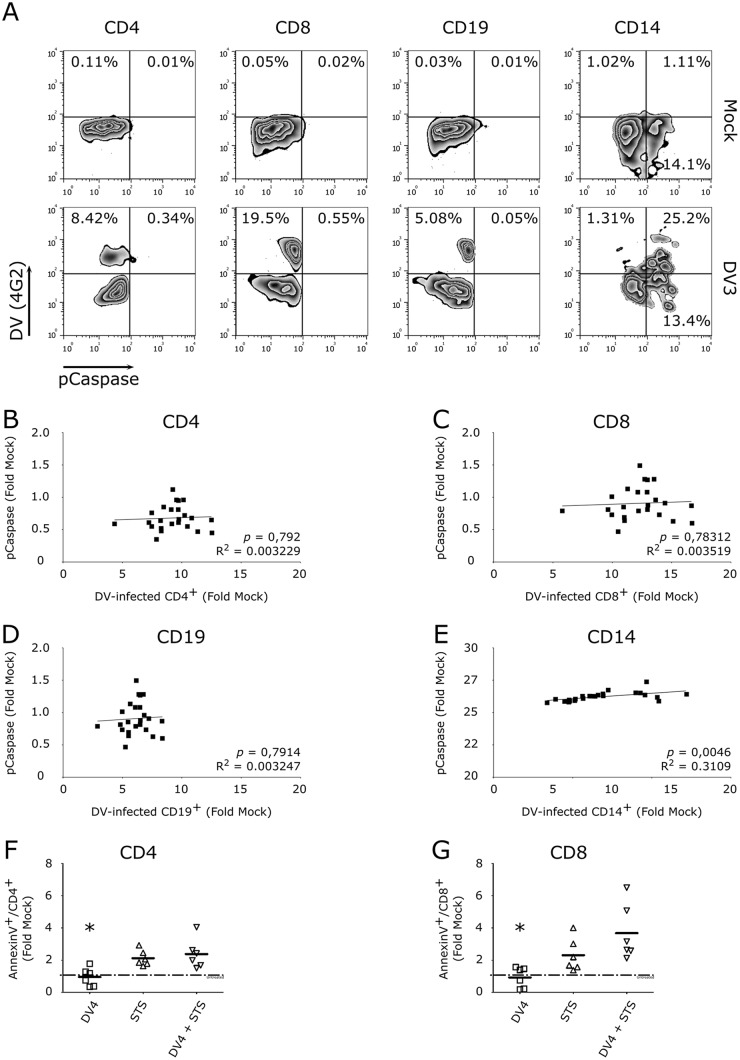
Dengue virus (DV) infection can cause either a self-limiting flu-like disease or a threatening hemorrhage that may evolve to shock and death. A variety of cell types, such as dendritic cells, monocytes, and B cells, can be infected by DV. However, despite the role of T lymphocytes in the control of DV replication, there remains a paucity of information on possible DV-T cell interactions during the disease course. In the present study, we have demonstrated that primary human naive CD4+ and CD8+ T cells are permissive for DV infection. Importantly, both T cell subtypes support viral replication and secrete viable virus particles. DV infection triggers the activation of both CD4+ and CD8+ T lymphocytes, but preactivation of T cells reduces the susceptibility of T cells to DV infection. Interestingly, the cytotoxicity-inducing protein granzyme A is highly secreted by human CD4+ but not CD8+ T cells after exposure to DV in vitro Additionally, using annexin V and polycaspase assays, we have demonstrated that T lymphocytes, in contrast to monocytes, are resistant to DV-induced apoptosis. Strikingly, both CD4+ and CD8+ T cells were found to be infected with DV in acutely infected dengue patients. Together, these results show that T cells are permissive for DV infection in vitro and in vivo, suggesting that this cell population may be a viral reservoir during the acute phase of the disease.IMPORTANCE Infection by dengue virus (DV) causes a flu-like disease that can evolve to severe hemorrhaging and death. T lymphocytes are important cells that regulate antibody secretion by B cells and trigger the death of infected cells. However, little is known about the direct interaction between DV and T lymphocytes. Here, we show that T lymphocytes from healthy donors are susceptible to infection by DV, leading to cell activation. Additionally, T cells seem to be resistant to DV-induced apoptosis, suggesting a potential role as a viral reservoir in humans. Finally, we show that both CD4+ and CD8+ T lymphocytes from acutely infected DV patients are infected by DV. Our results raise new questions about DV pathogenesis and vaccine development.

Keywords: T lymphocytes; dengue virus; replication.


Figures

FIG 1
FIG 1
Infection of CD4+ and CD8+ T lymphocytes with different MOIs of DV3. (A) Representative flow cytometry density plot data showing the results for mock infection and infection of CD4+ and CD8+ T lymphocytes (4G2+) with DV3 (strain 98) at MOIs of 1, 10, and 100, 5 days postinfection. (B and C) Bars represent the average frequencies of mock infection (circles) and DV3 infection (squares) of CD4+ (B) and CD8+ (C) T cells (six different healthy donors). *, P ≤ 0.05 compared to the results for mock-infected controls.
FIG 2
FIG 2
Human lymphocytes are susceptible to DV infection and replication. (A) Representative flow cytometry density plots of purified cells showing the frequencies of CD4+ and CD8+ T cells infected by DV. The number within each box refers to the frequency of cells within each gate. (B and C) Average frequencies of CD4+ and CD8+ T cell infection by the four DV serotypes. Mock infection (circles) and DV1 BR90 (squares), DV2 265 (triangles), DV3 98 (inverted triangles), and DV4 360 (diamonds) infection. Bars show the mean values for samples from six healthy donors. *, P ≤ 0.05 compared to the results for infection by four DV serotypes. (D and E) Confocal fluorescence microscopy of CD4+ and CD8+ T cells labeled for DNA (DAPI; blue), DV (anti-E protein MAb; red), and immunophenotyping markers (anti-CD4 or anti-CD8 MAb; green). Scale bar = 10 μm. (A, D, E) Data are representative of six independent experiments. (F and G) Flow cytometry data indicating the average frequencies of DV-infected CD4+ (F) and CD8+ (G) T lymphocytes (CD14+-depleted cells from six healthy donors) after virus treatment with different concentrations of heparin (2 to 20 μg). (H and I) Average frequencies, using a flow cytometry assay, of CD4+ (H) and CD8+ (I) T lymphocytes infected with DV1 to DV4 after cell treatment with different concentrations of heparinase III (0.5 to 5.0 IU) and infection with the four DV serotypes. Data represent the mean values ± standard errors of the means (SEM) for cells from six healthy donors. *, P ≤ 0.05 compared to the results for mock-infected controls. (J and M) DV progeny in cell culture supernatants from purified CD4+ (J) and CD8+ (M) T lymphocytes infected with the four DV serotypes were quantified using a focus-forming assay in C6/36 cells. (K and N) DV replication on CD4+ (K) and CD8+ (N) T lymphocytes (purified via cell sorting) was determined by real-time PCR assay. Quantification of DV nonstructural protein 3 (NS3) gene mRNA, normalized to the housekeeping gene 18S, for comparison of the levels in infected cells and mock-infected cells. (L and O) Qualitative determination of the levels of DV nonstructural protein 1 (NS1) in cell culture supernatants of purified CD4+ (L) and CD8+ (O) T lymphocytes infected by DV by using a capture ELISA from PanBio (values >11 indicate NS1 secretion). Mock infected (circles) and DV1 BR90 (squares), DV2 265 (triangles), DV3 98 (inverted triangles), and DV4 360 (diamonds) infected. Bars show the mean values for cells from six healthy donors. *, P ≤ 0.05 compared to the results for infection by four DV serotypes.
FIG 3
FIG 3
Detection of CD4+ and CD8+ T lymphocyte infection using anti-E and anti-NS3 MAbs. Representative flow cytometry density plot data showing CD4+ (A) and CD8+ (C) T lymphocyte infection with DV3 (strain 98) and mock infection after 5 days postinfection, using anti-GFP (isotype control), anti-E (4G2), and anti-NS3 (1722-1B) antibodies. (B and D) Bars represent the average frequencies of CD4+ (B) and CD8+ (D) T cell (samples from six healthy donors) infection with DV3 (squares) and mock infection (circles) after staining with anti-GFP (isotype control), anti-E (4G2), and anti-NS3 (1722-1B) antibodies. α, P ≤ 0.05 comparing mock infection to DV3 infection using the same antibody; β, P ≤ 0.05 comparing staining with 4G2 and 1722-1B to the results for the isotype control.
FIG 4
FIG 4
Differential susceptibilities of CD4+ and CD8+ T lymphocytes to DV infection. Bars represent the average frequencies of CD4+ and CD8+ T lymphocytes infected by DV1 (A), DV2 (B), DV3 (C), and DV4 (D) at an MOI of 10. After 5 days, cells were recovered and stained for phenotyping markers (CD3, CD4, and CD8) and for dengue virus E protein (4G2 antibody). Data are from 24 PBMC samples (representing 16 different healthy donors) infected with four DV serotypes. ***, P ≤ 0.001 comparing the levels of infection of CD8+ to that of CD4+ T lymphocytes.
FIG 5
FIG 5
Inactivated DV does not infect human T cells. (A) Representative flow cytometry density plot data showing human CD4+ and CD8+ T lymphocyte infection (MOI of 10) with DV3 98 and gamma-irradiated DV3 98 (iDV3) and mock infection. The number within each box refers to the frequency of cells within each gate. (B and C) Average percentages of CD4+ (B) and CD8+ (C) T cells infected with four DV serotypes and the respective gamma-irradiated strains in PBMC cultures after 5 days postinfection. Mock infection (circles) and infection with DV1 BR90 or inactivated DV1 BR90 (squares), DV2 265 or inactivated DV2 265 (triangles), DV3 98 or inactivated DV3 98 (inverted triangles), and DV4 360 or inactivated DV4 360 (diamond). Bars represent the mean values ± SEM for cells from six healthy donors. *, P ≤ 0.05 compared to the results for mock controls and for inactivated DV.
FIG 6
FIG 6
DV infection activates T lymphocytes. (A) Representative flow cytometry density plot data showing DV3 infection (4G2+) and cellular activation (CD69+) of CD4+ and CD8+ T lymphocytes. (B to I) Average frequencies of CD4+ (B) and CD8+ (F) T cell infection with DV3 and levels of expression of activation markers CD69+ (C and G), CD38+ (D and H), and HLA-DR+ (E and I) in CD4+ (B to E) and CD8+ (F to I) T lymphocytes. PBMC samples from six healthy donors were mock infected (circles) or infected with gamma-irradiated DV3 98 (iDV3; triangles) and DV3 98 (inverted triangles). α, P ≤ 0.05 comparing the results for mock and DV3 infection; β, P ≤ 0.05 comparing the results for iDV3 and DV3 infection.
FIG 7
FIG 7
Activated T lymphocytes are more resistant to DV infection. (A and B) Enriched T lymphocyte cultures (CD14+ depleted) were stimulated overnight with anti-CD3 and anti-CD28 MAbs and infected with the four DV serotypes. After 5 days, cells were stained for anti-DV MAb (4G2+) and cellular markers (CD3+/CD4+ and CD3+/CD8+). Data show levels of T cell infection after stimulation with anti-GFP MAb (isotype control; circles) and anti-CD3/anti-CD28 MAb (squares). *, P ≤ 0.05 compared to the results for nonactivated lymphocytes. (C to F) PBMCs were stimulated using anti-CD3/anti-CD28 MAbs, and activated (CD69+) and naive (CD69) T cells were purified by flow cytometry and infected with DV3 98 (MOI of 10) for 5 days. (C and E) Representative flow cytometry density plot data showing DV3 98 infection (4G2+) in purified CD69+ (activated) and CD69 (nonactivated or naive) T cells. (D and F) Average frequencies of CD4+ (D) and CD8+ (F) T cell infection with DV3 in activated (CD69+) and naive (CD69) T cells. Mock (circles), gamma-irradiated DV3 98 (iDV3) (inverted triangles), and DV3 98 (diamonds) infected. α, P ≤ 0.05 comparing the results for mock and DV3 infection; β, P ≤ 0.05 comparing the results for iDV3 and DV3 infection; γ, P ≤ 0.05 comparing the results for infection of CD69 and CD69+ cells.
FIG 8
FIG 8
DV infection of CD4+ T lymphocytes triggers the secretion of granzyme A. (A and B) Concentrations of granzyme A (A) and perforin (B) in PBMCs infected with four DV serotypes. Mock infected (circles) and DV1 BR90 (squares), DV2 265 (triangles), DV3 98 (inverted triangles), and DV4 360 (diamonds) infected. *, P ≤ 0.05 compared to the results for infection by the four DV serotypes. (C to F) Purified CD4+ (circles) and CD8+ T cells (squares) were infected with DV1 (C), DV2 (D), DV3 (E), and DV4 (F), and granzyme A was measured in the cell culture supernatants after 5 days. Bars show the mean values for cells from six healthy donors infected with strains of the four DV serotypes. *, P ≤ 0.05 compared to the results for infection by DV.
FIG 9
FIG 9
DV infection does not modulate lymphocyte apoptosis. (A) Representative flow cytometry density plot data for PBMCs infected with DV3 98 (4G2+) and polycaspase stained. (B to E) Pearson correlation analysis between the percentages of infected CD4+ T cells (B), CD8+ T cells (C), and B cells, i.e., CD19+ (D) or CD14+ (E) monocytes, and polycaspase staining. The data represent fold induction of infection and apoptosis related to the results for the mock-infected control. PBMCs from six healthy donors were infected with four DV serotypes. (F and G) PBMCs from healthy donors were infected with DV4 360 for 4 days and treated with staurosporine (STS) for an additional 24 h. Average frequencies of CD4+ and CD8+ T cell apoptosis after staurosporine treatment (200 nM) in DV-infected cells and uninfected controls. Bars show the mean values for PBMCs from six healthy donors infected with DV4 360. The dotted-and-dashed lines (untreated) indicate the level of apoptosis of mock-treated control lymphocytes. *, P ≤ 0.05 comparing the results for DV4 infection to the results for STS treatment or STS treatment plus DV4 infection by one-way ANOVA.
FIG 10
FIG 10
CD4+ and CD8+ T lymphocytes are naturally infected by DV in acute-phase patients. (A, C, E, and G) Representative flow cytometry density data showing CD4+ (A) and CD8+ (C) T lymphocyte, B cell (CD19+) (E), and monocyte (CD14+) (G) infection by DV1 in PBMCs from an acute-phase patient. Lymphocyte infection was observed by labeling the viral proteins with anti-flavivirus E protein MAb (4G2), anti-DV NS3 MAb (1722-1B), or an isotype control (anti-GFP MAb). The number within each box refers to the frequency of cells within each gate. Phenotype staining was performed using anti-CD3, anti-CD4, anti-CD8, anti-CD19, and anti-CD14 MAbs. Cell infection was shown using PBMCs from a patient negative for DV infection (PBMC#13) and a patient infected with DV1 (PBMC#3). (B, D, F, and H) Average frequencies of CD4+ (B) and CD8+ (D) T lymphocytes, B cells (F), and monocytes (H) infected by DV (anti-DV NS3 and anti-DV E MAbs) in PBMCs from seven negative (circles) and six DV-infected patients (squares). α, P ≤ 0.05 comparing the results for anti-DV MAb (4G2 or 1722-1B) staining in PBMCs from DV-infected and noninfected patients; β, P ≤ 0.05 comparing the results for staining with 4G2 or 1722-1B and the isotype control (anti-GFP MAb).

Similar articles

Cited by

References

    1. WHO. 2009. Dengue guidelines for diagnosis, treatment, prevention and control. WHO, Geneva, Switzerland. - PubMed
    1. Pang T, Cardosa MJ, Guzman MG. 2007. Of cascades and perfect storms: the immunopathogenesis of dengue haemorrhagic fever-dengue shock syndrome (DHF/DSS). Immunol Cell Biol 85:43–45. doi:10.1038/sj.icb.7100008. - DOI - PubMed
    1. Rothman AL, Medin CL, Friberg H, Currier JR. 2014. Immunopathogenesis versus protection in dengue virus infections. Curr Trop Med Rep 1:13–20. doi:10.1007/s40475-013-0009-0. - DOI - PMC - PubMed
    1. Green AM, Beatty PR, Hadjilaou A, Harris E. 2014. Innate immunity to dengue virus infection and subversion of antiviral responses. J Mol Biol 426:1148–1160. doi:10.1016/j.jmb.2013.11.023. - DOI - PMC - PubMed
    1. Kurane I, Ennis FA. 1987. Induction of interferon alpha from human lymphocytes by autologous, dengue virus-infected monocytes. J Exp Med 166:999–1010. doi:10.1084/jem.166.4.999. - DOI - PMC - PubMed

Publication types

MeSH terms