. 2018 Apr 27;92(10):e00014-18.
doi: 10.1128/JVI.00014-18. Print 2018 May 15.

Dynamics of Tissue-Specific CD8+ T Cell Responses during West Nile Virus Infection

Affiliations

Dynamics of Tissue-Specific CD8+ T Cell Responses during West Nile Virus Infection

Renan Aguilar-Valenzuela et al. J Virol. .

Abstract

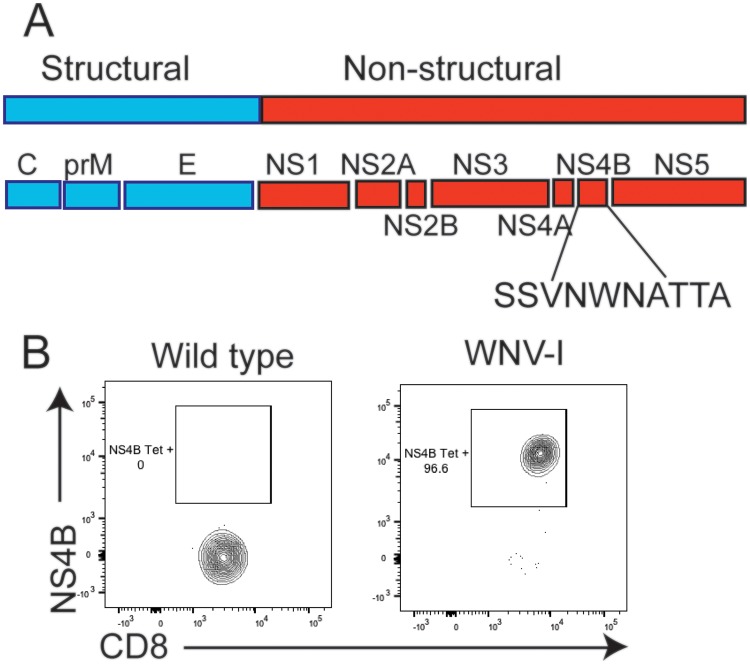
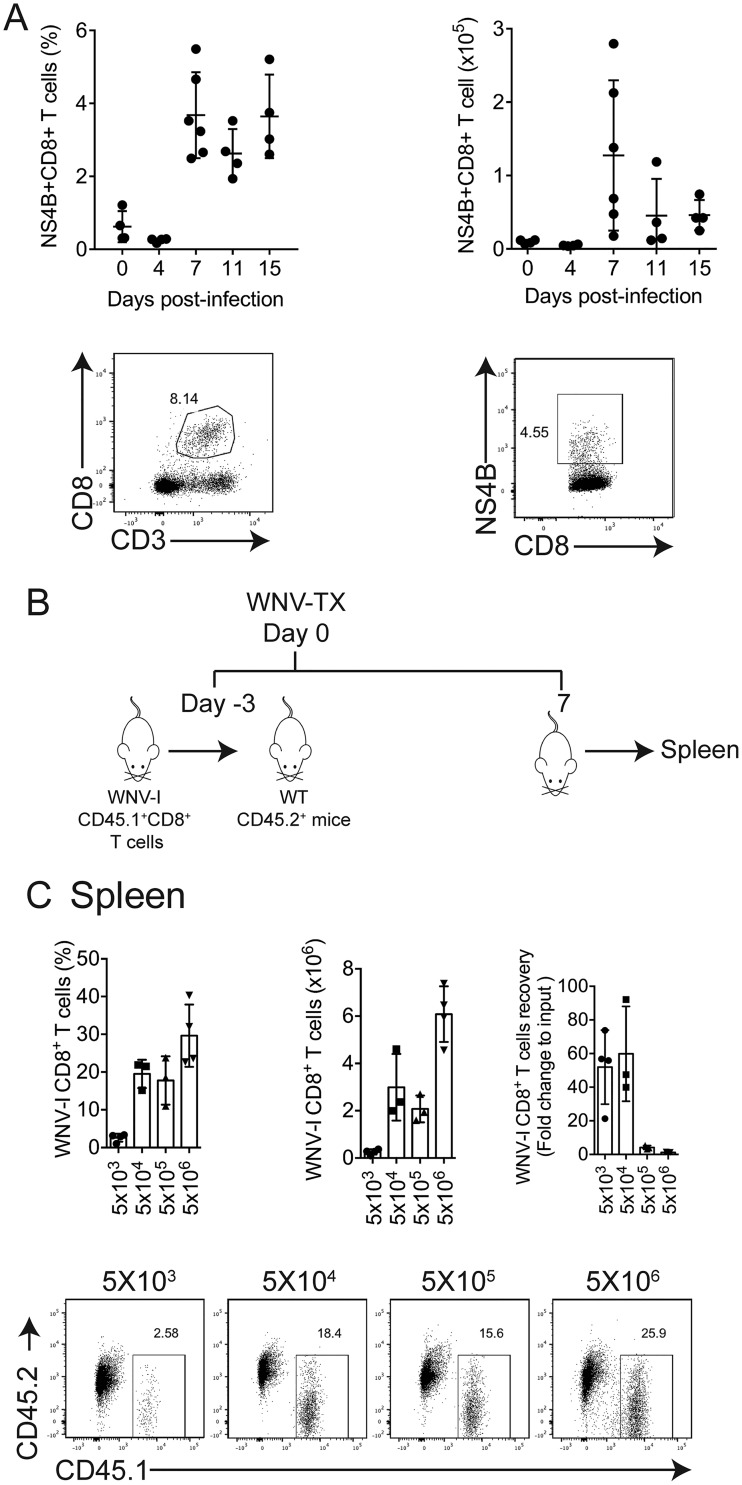
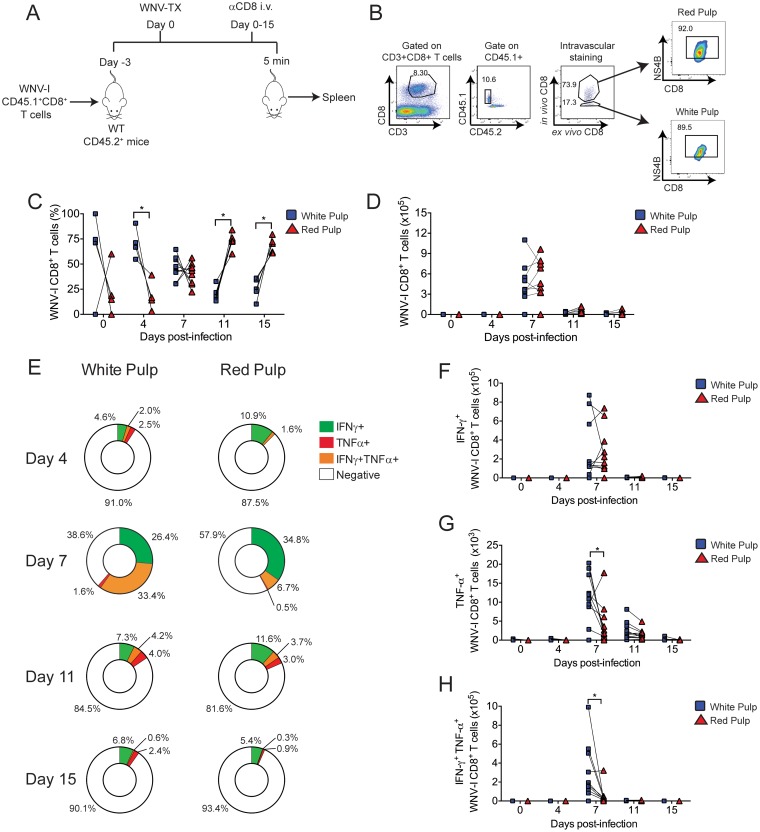
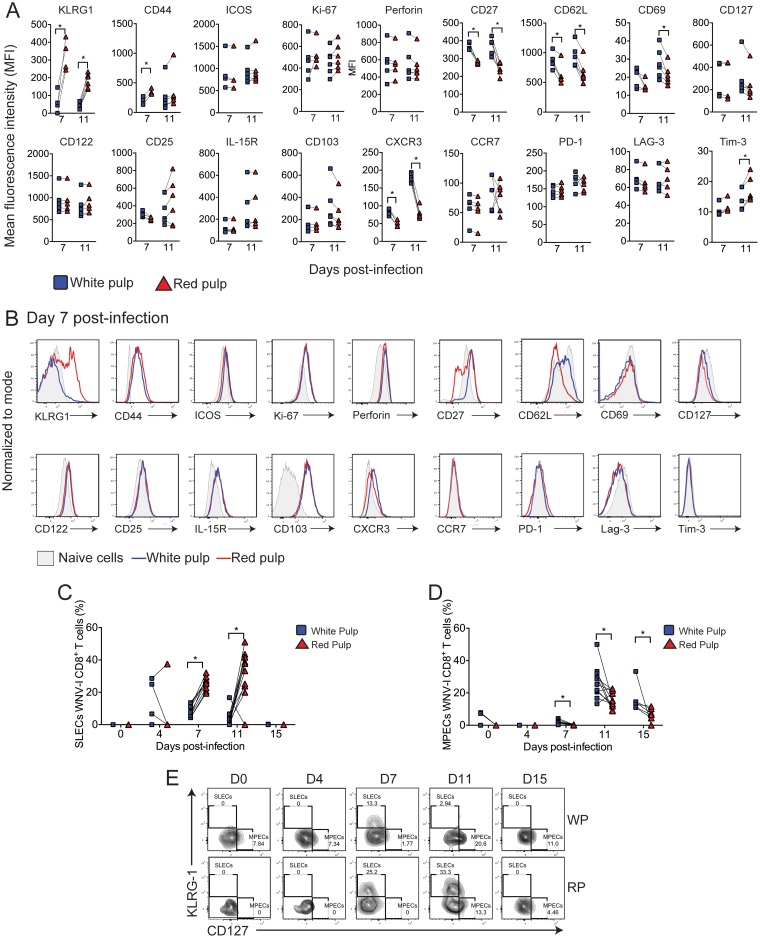
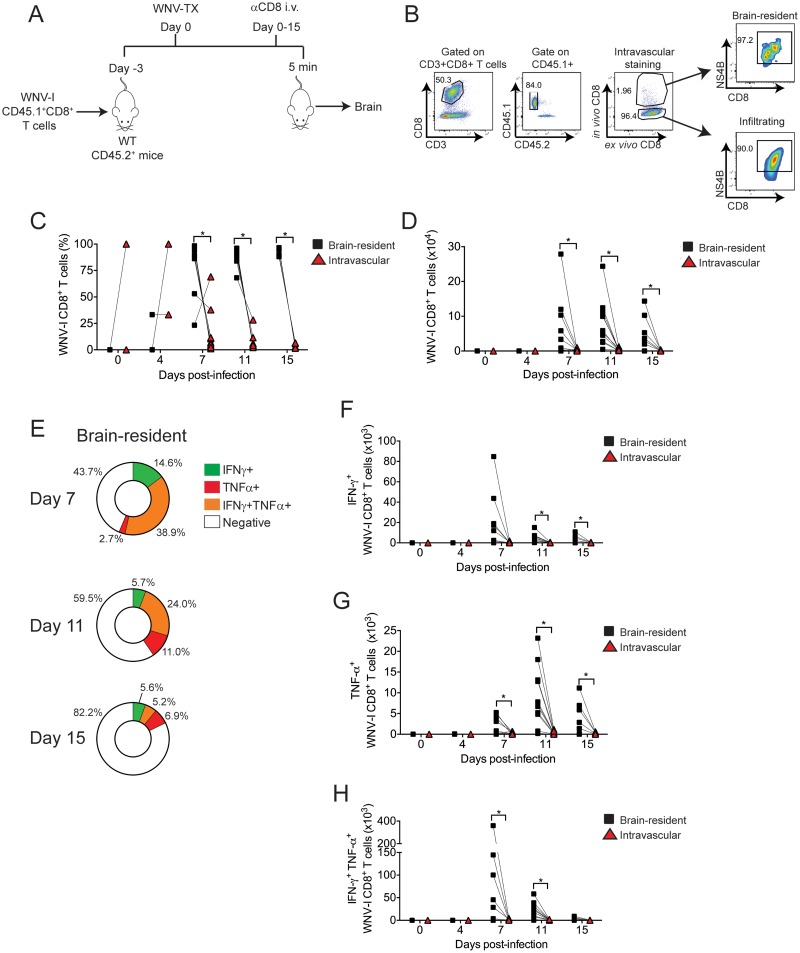
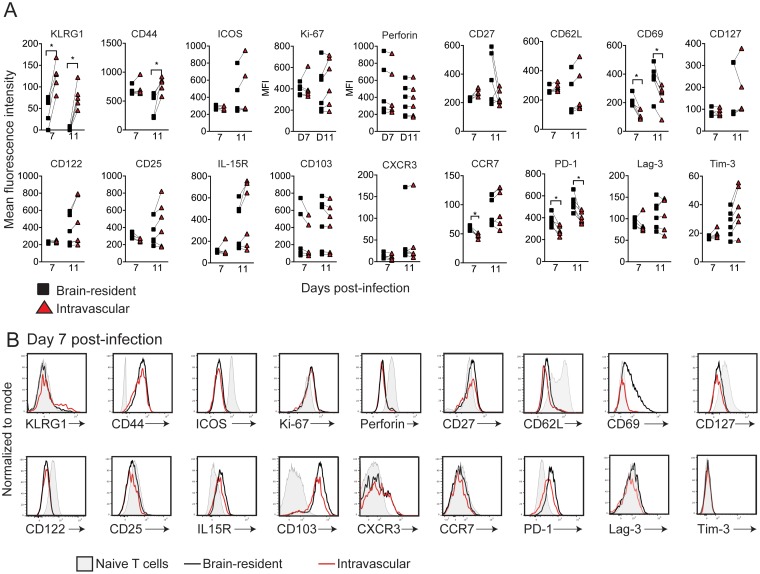
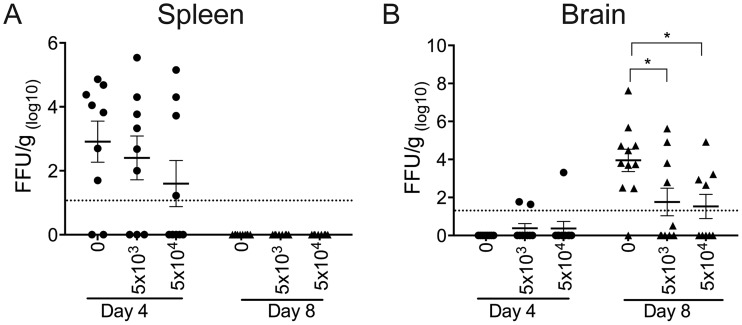
The mouse model of West Nile virus (WNV), which is a leading cause of mosquito-borne encephalitis worldwide, has provided fundamental insights into the host and viral factors that regulate viral pathogenesis and infection outcome. In particular, CD8+ T cells are critical for controlling WNV replication and promoting protection against infection. Here, we present the characterization of a T cell receptor (TCR)-transgenic mouse with specificity for the immunodominant epitope in the WNV NS4B protein (here referred to as transgenic WNV-I mice). Using an adoptive-transfer model, we found that WNV-I CD8+ T cells behave similarly to endogenous CD8+ T cell responses, with an expansion phase in the periphery beginning around day 7 postinfection (p.i.) followed by a contraction phase through day 15 p.i. Through the use of in vivo intravascular immune cell staining, we determined the kinetics, expansion, and differentiation into effector and memory subsets of WNV-I CD8+ T cells within the spleen and brain. We found that red-pulp WNV-I CD8+ T cells were more effector-like than white-pulp WNV-I CD8+ T cells, which displayed increased differentiation into memory precursor cells. Within the central nervous system (CNS), we found that WNV-I CD8+ T cells were polyfunctional (gamma interferon [IFN-γ] and tumor necrosis factor alpha [TNF-α]), displayed tissue-resident characteristics (CD69+ and CD103+), persisted in the brain through day 15 p.i., and reduced the viral burden within the brain. The use of these TCR-transgenic WNV-I mice provides a new resource to dissect the immunological mechanisms of CD8+ T cell-mediated protection during WNV infection.IMPORTANCE West Nile Virus (WNV) is the leading cause of mosquito-borne encephalitis worldwide. There are currently no approved therapeutics or vaccines for use in humans to treat or prevent WNV infection. CD8+ T cells are critical for controlling WNV replication and protecting against infection. Here, we present a comprehensive characterization of a novel TCR-transgenic mouse with specificity for the immunodominant epitope in the WNV NS4B protein. In this study, we determine the kinetics, proliferation, differentiation into effector and memory subsets, homing, and clearance of WNV in the CNS. Our findings provide a new resource to dissect the immunological mechanisms of CD8+ T cell-mediated protection during WNV infection.

Keywords: CD8+ T cells; West Nile virus; brain; neuroimmunology; spleen; viral pathogenesis.


Figures

FIG 1
FIG 1
Generation of WNV-I CD8+ T cells. (A) WNV genome showing structural proteins (blue) and nonstructural proteins (red). The peptide sequence for the immunodominant epitope in the NS4B protein is shown. (B) Flow cytometry staining of peripheral blood obtained from naive C57BL/6J (left) or WNV-I (right) mice using a WNV-specific tetramer (NS4B) and anti-CD8 antibody.
FIG 2
FIG 2
Titration of WNV-I-specific CD8+ T cells. (A) Expansion of endogenous WNV-specific CD8+ T cells during WNV-I infection. (B) Experimental design. Increasing amounts of WNV-I CD8+ T cells were transferred to congenically marked mice 3 days prior to infection. The mice were infected with WNV-TX (100 PFU) via the s.c. route. WNV-I CD8+ T cells in the spleen were evaluated on day 7 p.i. WT, wild type,. (C) (Top) (Left and middle) Frequency (left) and counts (middle) of WNV-I CD8+ T cells recovered from adoptive transfers on day 7 p.i. (Right) Fold change recovery calculated relative to the initial input of WNV-I CD8+ T cells. (Bottom) Representative flow cytometry plots for individual adoptive-transfer conditions. The data are representative of the results of two independent experiments (n = 3 or 4 mice per group). The error bars indicate standard deviations.
FIG 3
FIG 3
Distribution of WNV-I CD8+ T cells in the spleen during WNV infection. (A) Experimental design. WNV-I CD8+ T cells (5 × 10⁴) were transferred into congenically marked mice. Three days later, the recipients were infected with 100 PFU of WNV-TX s.c., and on the day of sacrifice, the mice received 10 μg of allophycocyanin-labeled anti-CD8 antibody for 5 min through the intravenous route. (B) Gating strategy to determine the anatomic location of WNV-I CD8+ T cells in the spleen. (C and D) Frequency (C) and cell counts (D) of WNV-I CD8+ T cells present in RP or WP compartments during WNV infection. (E) Frequencies of IFN-γ-single-positive, TNF-α-single-positive, and IFN-γ- TNF-α-double-positive cells in the spleen. (F to H) Cell counts of IFN-γ- and TNF-α-single- and double-positive WNV-I CD8+ T cells in the spleen. The data are representative of the results of two independent experiments (n = 4 to 9 mice per group). *, P < 0.05; paired t test.
FIG 4
FIG 4
Effector and memory CD8+ T cell differentiation during WNV infection. WNV-I CD8+ T cells (5 × 10⁴) were transferred into congenically marked mice. Three days later, the recipients were infected with 100 PFU of WNV-TX s.c., and on the day of sacrifice, the mice received 10 μg of allophycocyanin-labeled anti-CD8 antibody for 5 min through the intravenous route. (A and B) Mean fluorescence intensity (MFI) (A) and representative histograms (B) on day 7 p.i. (C) Frequencies of WNV-I CD8+ T SLECs in the WP and RP. (D) Frequencies of WNV-I CD8+ T MPEC phenotypes in the WP and RP. (E) Representative flow cytometry plots of WNV-I CD8+ T SLECs and MPECs during WNV infection. The data are representative of the results of two independent experiments (n = 4 or 5 mice per group). *, P < 0.05; paired t test.
FIG 5
FIG 5
WNV-I CD8+ T cells are polyfunctional in the brain parenchyma. (A) WNV-I CD8+ T cells (5 × 10⁴) were transferred into congenically marked mice. Three days later, the recipients were infected with 100 PFU of WNV-TX s.c., and on the day of sacrifice, the mice received 10 μg of allophycocyanin-labeled anti-CD8 antibody for 5 min through the i.v. route. (B) Gating strategy to determine the anatomic location of WNV-I CD8+ T cells in the brain. (C and D) Frequency (C) and cell counts (D) of brain-resident and intravascular WNV-I CD8+ T cells during the course of WNV infection. (E) Percentages of IFN-γ-single-positive, TNF-α-single-positive, and IFN-γ- TNF-α-double-positive cells in the brain. (F to H) Cell counts of IFN-γ- and TNF-α-single- and double-positive WNV-I CD8+ T cells recovered from the brain. The data are representative of the results of two independent experiments with at least 4 mice per time point. *, P < 0.05; paired t test.
FIG 6
FIG 6
WNV-I CD8+ T cells are tissue-resident T cells in the CNS. WNV-I CD8+ T cells (5 × 10⁴) were transferred into congenically marked mice. Three days later, the recipients were infected with 100 PFU of WNV-TX s.c., and on the day of sacrifice, the mice received 10 μg of allophycocyanin-labeled anti-CD8 antibody for 5 min through the i.v. route. (A and B) MFI (A) and representative histograms (B) on day 7 p.i. The data are representative of the results of two independent experiments with at least 5 mice per condition. *, P < 0.05; paired t test.
FIG 7
FIG 7
WNV-I CD8+ T cells reduce the viral burden in C57BL/6J mice. WNV-I CD8+ T cells (5 × 10³ or 5 × 10⁴) were transferred into C57BL/6J mice, and the mice were infected with WNV-TX via the s.c. route 3 days posttransfer. Tissues were harvested on days 4 and 8 p.i., and the viral burdens within the spleen (A) and brain (B) were determined by focus-forming assay. The data are represented as focus-forming units (FFU) per gram of tissue and are combined (n = 9 to 11 mice in total) from the results of two independent experiments with at least 5 mice per experimental condition. *, P < 0.05; one-way ANOVA.

Similar articles

Cited by

References

    1. Grubaugh ND, Ebel GD. 2016. Dynamics of West Nile virus evolution in mosquito vectors. Curr Opin Virol 21:132–138. doi:10.1016/j.coviro.2016.09.007. - DOI - PMC - PubMed
    1. David S, Abraham AM. 2016. Epidemiological and clinical aspects on West Nile virus, a globally emerging pathogen. Infect Dis 48:571–586. doi:10.3109/23744235.2016.1164890. - DOI - PubMed
    1. Mostashari F, Bunning ML, Kitsutani PT, Singer DA, Nash D, Cooper MJ, Katz N, Liljebjelke KA, Biggerstaff BJ, Fine AD, Layton MC, Mullin SM, Johnson AJ, Martin DA, Hayes EB, Campbell GL. 2001. Epidemic West Nile encephalitis, New York, 1999: results of a household-based seroepidemiological survey. Lancet 358:261–264. doi:10.1016/S0140-6736(01)05480-0. - DOI - PubMed
    1. Petersen LR, Marfin AA. 2002. West Nile virus: a primer for the clinician. Ann Intern Med 137:173–179. doi:10.7326/0003-4819-137-3-200208060-00009. - DOI - PubMed
    1. Murray K, Baraniuk S, Resnick M, Arafat R, Kilborn C, Cain K, Shallenberger R, York TL, Martinez D, Hellums JS, Hellums D, Malkoff M, Elgawley N, McNeely W, Khuwaja SA, Tesh RB. 2006. Risk factors for encephalitis and death from West Nile virus infection. Epidemiol Infect 134:1325–1332. doi:10.1017/S0950268806006339. - DOI - PMC - PubMed

Publication types

MeSH terms