. 2018 May 14;92(11):e00363-18.
doi: 10.1128/JVI.00363-18. Print 2018 Jun 1.

Distinct Immunogenicity and Efficacy of Poxvirus-Based Vaccine Candidates against Ebola Virus Expressing GP and VP40 Proteins

Affiliations

Distinct Immunogenicity and Efficacy of Poxvirus-Based Vaccine Candidates against Ebola Virus Expressing GP and VP40 Proteins

Adrián Lázaro-Frías et al. J Virol. .

Abstract

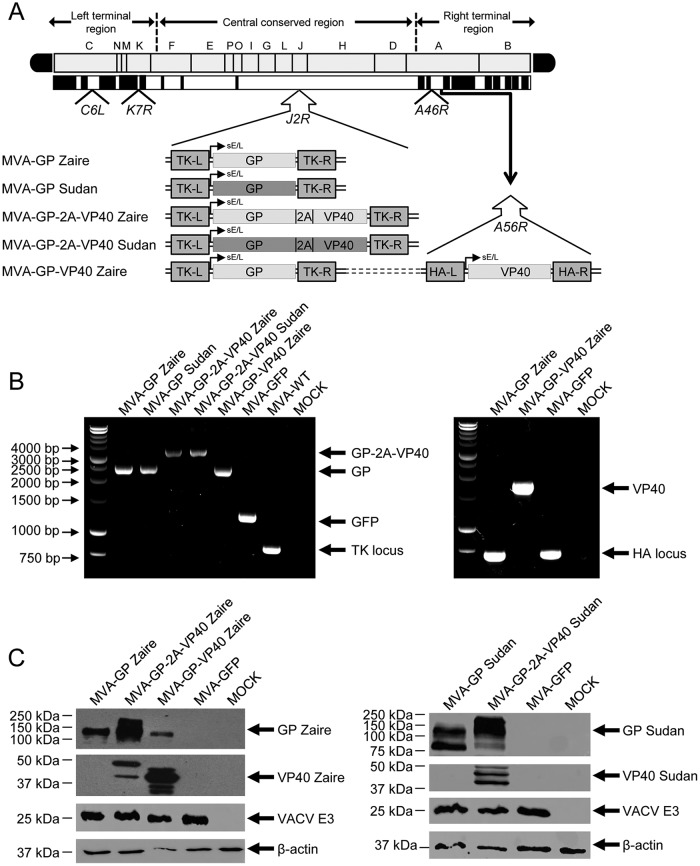
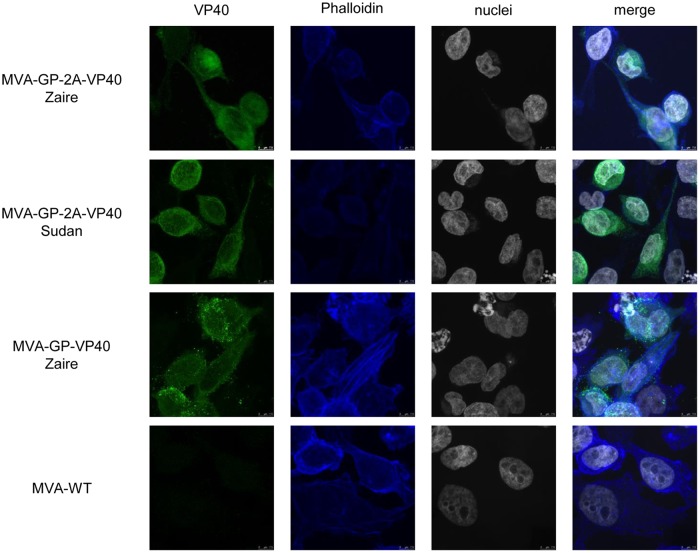
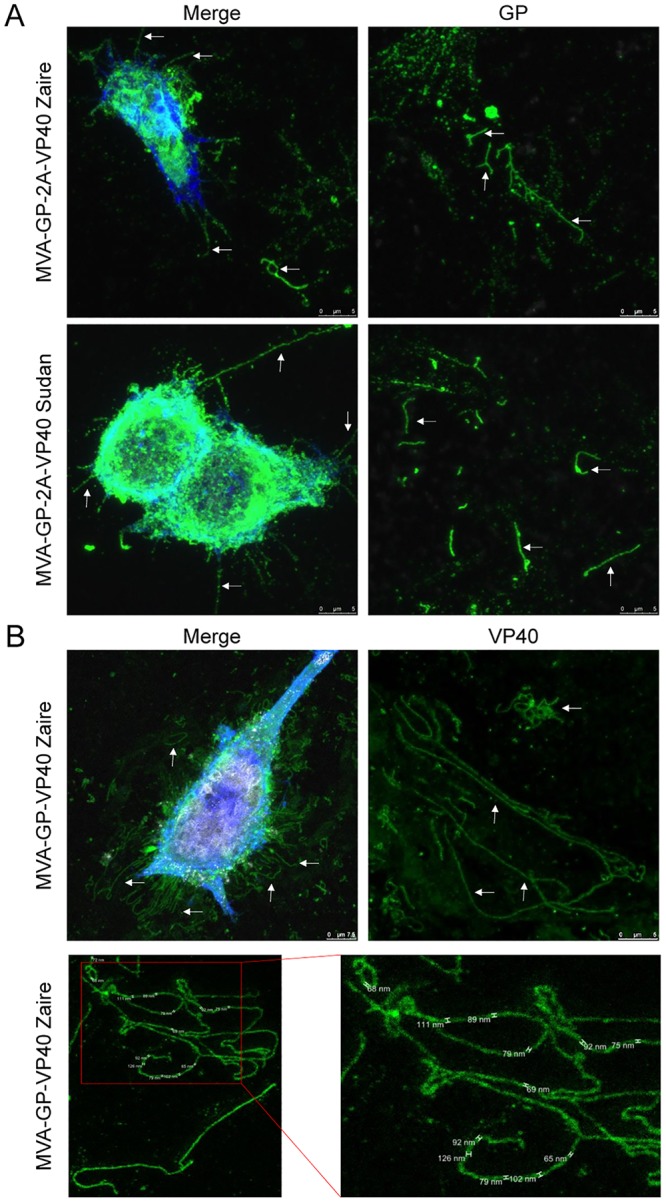
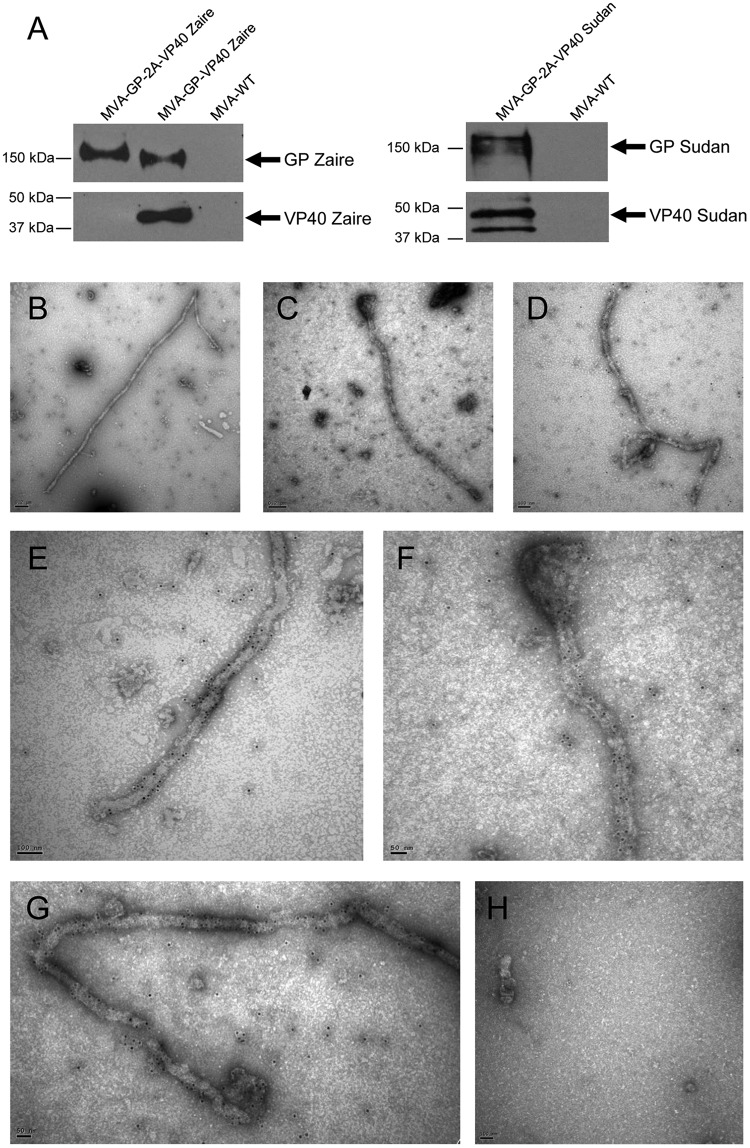
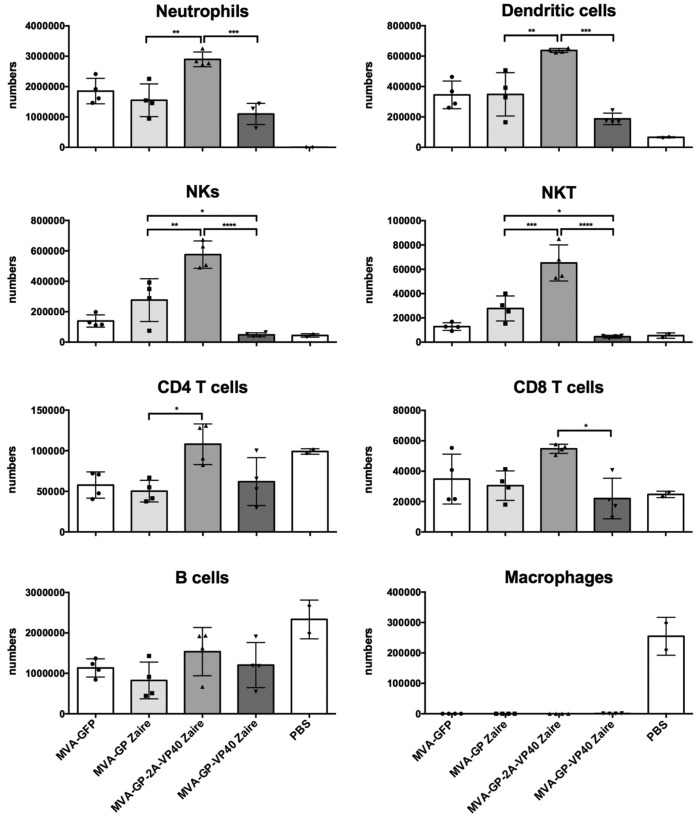
Zaire and Sudan ebolavirus species cause a severe disease in humans and nonhuman primates (NHPs) characterized by a high mortality rate. There are no licensed therapies or vaccines against Ebola virus disease (EVD), and the recent 2013 to 2016 outbreak in West Africa highlighted the need for EVD-specific medical countermeasures. Here, we generated and characterized head-to-head the immunogenicity and efficacy of five vaccine candidates against Zaire ebolavirus (EBOV) and Sudan ebolavirus (SUDV) based on the highly attenuated poxvirus vector modified vaccinia virus Ankara (MVA) expressing either the virus glycoprotein (GP) or GP together with the virus protein 40 (VP40) forming virus-like particles (VLPs). In a human monocytic cell line, the different MVA vectors (termed MVA-EBOVs and MVA-SUDVs) triggered robust innate immune responses, with production of beta interferon (IFN-β), proinflammatory cytokines, and chemokines. Additionally, several innate immune cells, such as dendritic cells, neutrophils, and natural killer cells, were differentially recruited in the peritoneal cavity of mice inoculated with MVA-EBOVs. After immunization of mice with a homologous prime/boost protocol (MVA/MVA), total IgG antibodies against GP or VP40 from Zaire and Sudan ebolavirus were differentially induced by these vectors, which were mainly of the IgG1 and IgG3 isotypes. Remarkably, an MVA-EBOV construct coexpressing GP and VP40 protected chimeric mice challenged with EBOV to a greater extent than a vector expressing GP alone. These results support the consideration of MVA-EBOVs and MVA-SUDVs expressing GP and VP40 and producing VLPs as best-in-class potential vaccine candidates against EBOV and SUDV.IMPORTANCE EBOV and SUDV cause a severe hemorrhagic fever affecting humans and NHPs. Since their discovery in 1976, they have caused several sporadic epidemics, with the recent outbreak in West Africa from 2013 to 2016 being the largest and most severe, with more than 11,000 deaths being reported. Although some vaccines are in advanced clinical phases, less expensive, safer, and more effective licensed vaccines are desirable. We generated and characterized head-to-head the immunogenicity and efficacy of five novel vaccines against EBOV and SUDV based on the poxvirus MVA expressing GP or GP and VP40. The expression of GP and VP40 leads to the formation of VLPs. These MVA-EBOV and MVA-SUDV recombinants triggered robust innate and humoral immune responses in mice. Furthermore, MVA-EBOV recombinants expressing GP and VP40 induced high protection against EBOV in a mouse challenge model. Thus, MVA expressing GP and VP40 and producing VLPs is a promising vaccine candidate against EBOV and SUDV.

Keywords: Ebola; GP; MVA; VP40; immunogenicity; mice; poxvirus; protection.


Figures

FIG 1
FIG 1
Generation and in vitro characterization of recombinant MVA-EBOV/SUDVs. (A) Scheme of the genome map of recombinant MVA-EBOV/SUDVs expressing GP and VP40 from Zaire and Sudan ebolavirus species. The different regions are indicated by capital letters. The right and left terminal regions are shown. Below the map, the deleted or fragmented VACV genes are depicted as black boxes. The GP Zaire, GP Sudan, GP-2A-VP40 Zaire, and GP-2A-VP40 Sudan genes driven by the sE/L virus promoter and inserted within the VACV TK viral locus (J2R) are indicated. The VP40 Zaire gene driven by the sE/L virus promoter and inserted within the VACV HA viral locus (A56R) is also indicated. The deleted VACV C6L, K7R, and A46R genes are also indicated. TK-L, TK left; TK-R, TK right. (B) PCR analysis of VACV TK and HA loci. Viral DNA was extracted from DF-1 cells mock infected or infected at 5 PFU/cell with MVA-EBOV/SUDVs, parental MVA-GFP, or MVA-WT. Primers spanning the TK locus-flanking regions were used for PCR analysis of the GP and GP-2A-VP40 Zaire and Sudan genes inserted within the TK locus, and primers spanning the HA locus-flanking regions were used for PCR analysis of the VP40 Zaire gene. Amplified DNA products are indicated by arrows on the right. A molecular size marker (1-kb ladder) with the corresponding sizes (base pairs) is indicated on the left. (C) Expression of GP and VP40 Zaire or Sudan proteins. DF-1 cells were mock infected or infected at 5 PFU/cell with MVA-EBOV/SUDVs and parental MVA-GFP. At 24 hpi, cells were lysed in Laemmli buffer, fractionated by 10% SDS-PAGE, and analyzed by Western blotting using mouse polyclonal antibodies against GP-Zaire, GP-Sudan, and VP40 Sudan, and a rabbit polyclonal antibody against VP40 Zaire. Rabbit antibodies against the VACV E3 protein and β-actin were used as a loading control for the quantity of virus antigen and of host cell protein, respectively. Arrows on the right indicate the GP and VP40 proteins, together with VACV E3 and β-actin. The sizes of standards (in kilodaltons; Precision Plus protein standards; Bio-Rad Laboratories) are indicated on the left.
FIG 2
FIG 2
GP and VP40 protein expression and viral growth kinetics of MVA-EBOV/SUDVs. (A and B) Expression kinetics of GP and VP40 proteins of Zaire and Sudan ebolaviruses present in cellular pellets (A) and supernatants (B) from cells infected with MVA-EBOV/SUDVs. DF-1 cells were mock infected or infected at 5 PFU/cell with MVA-EBOV/SUDVs, parental MVA-GFP, and MVA-WT, and at 3, 7, and 24 hpi, cellular pellets (A) and cell supernatants (B) were collected (the supernatants had previously been precipitated with 10% TCA), lysed in Laemmli buffer, fractionated by 10% SDS-PAGE, and analyzed by Western blotting using mouse polyclonal antibodies against GP-Zaire, GP-Sudan, and VP40 Sudan and a rabbit polyclonal antibody against VP40 Zaire. Rabbit antibody against β-actin was used as a loading control for the quantity of cells. Arrows on the right indicate the GP and VP40 proteins and β-actin. The sizes of standards (in kilodaltons) are indicated on the left. (C) Flow cytometry analysis of GP expression levels in cells infected with MVA-EBOV/SUDVs. HeLa cells were mock infected or infected at 5 PFU/cell with MVA-EBOV/SUDVs and MVA-WT, and at 24 hpi, cells were collected and analyzed by flow cytometry using mouse polyclonal antibodies against GP Zaire and Sudan proteins, followed by an anti-mouse FITC-conjugated antibody. The cell surface expression of GP is represented in the histogram plots. (D) Viral growth kinetics of MVA-EBOV/SUDVs. Monolayers of DF-1 cells were infected at 0.01 PFU/cell with parental MVA-GFP and the different MVA-EBOV/SUDVs. At different times postinfection (0, 24, 48, and 72 h), cells were collected and virus titers in cell lysates were quantified by a plaque immunostaining assay with anti-VACV antibodies. The means of the results from two independent experiments are shown.
FIG 3
FIG 3
Genetic stability of MVA-EBOV/SUDVs and analysis of apoptosis. (A) Stability of MVA-EBOV/SUDVs. Passage 2 (P2) stocks of MVA-EBOV/SUDVs were continuously grown at a low MOI until passage 5 in DF-1 cells. Then, DF-1 cells were mock infected or infected with MVA-EBOV/SUDVs from the different passages or with MVA-WT. At 24 hpi, cells were lysed in Laemmli buffer, fractionated by 10% SDS-PAGE, and analyzed by Western blotting using mouse polyclonal antibody against GP-Zaire, GP-Sudan, and VP40 Sudan and a rabbit polyclonal antibody against VP40 Zaire. Rabbit anti-VACV early E3 protein antibody was used as a VACV loading control. Arrows on the right indicate the positions of the GP and VP40 proteins and the VACV E3 protein. The sizes of the standards (in kilodaltons) are indicated on the left. (B) Apoptosis in MVA-EBOV/SUDV-infected cells. HeLa cells were mock infected or infected at 5 PFU/cell with MVA-EBOV/SUDVs, parental MVA-GFP, and MVA-WT. At 18 hpi, cells were lysed in Laemmli buffer, fractionated by 10% SDS-PAGE, and analyzed by Western blotting using a mouse anti-human cleaved PARP antibody. Rabbit antibody against β-actin was used as a loading control for the quantity of cells. Arrows on the right, with their corresponding sizes (in kilodaltons), indicate the positions of the full-length PARP, cleaved PARP, and β-actin. The sizes of standards (in kilodaltons) are indicated on the left.
FIG 4
FIG 4
Immunofluorescence analysis of GP proteins produced in MVA-EBOV/SUDV-infected cells. Subconfluent HeLa cells cultured on glass coverslips were mock infected or infected at 0.5 PFU/cell with MVA-EBOV/SUDVs or MVA-WT. At 18 hpi, cells were fixed with 3% PFA, quenched in the presence of NH4Cl, permeabilized, blocked with saponin-FCS, and labeled with antibodies against the GP Zaire and GP Sudan proteins. Then, cells were treated with secondary antibodies conjugated with the fluorochrome Alexa Fluor 488 (green), the probe phalloidin (to stain F-actin, shown in blue), and DAPI (to mark DNA, shown in gray). Coverslips were mounted on glass slides, conserved in ProLong Gold antifade reagent, and visualized by confocal microscopy. Detection of GP proteins is shown in the first column, detection of F-actin is shown in the second column, detection of nuclei is shown in the third column, and merged images are shown in the last column. Bars, 7.5 μm.
FIG 5
FIG 5
Immunofluorescence analysis of VP40 proteins produced in MVA-EBOV/SUDV-infected cells. Subconfluent HeLa cells cultured on glass coverslips were mock infected or infected at 0.5 PFU/cell with MVA-EBOV/SUDVs or MVA-WT. At 18 hpi, cells were fixed with 3% PFA, quenched in the presence of NH4Cl, permeabilized, blocked with saponin-FCS, and labeled with antibodies against VP40 Zaire or VP40 Sudan proteins. Then, cells were treated with secondary antibodies conjugated with the fluorochrome Alexa Fluor 488 (green), the probe phalloidin (to stain F-actin, shown in blue), and DAPI (to mark DNA, shown in gray). Coverslips were mounted on glass slides, conserved in ProLong Gold antifade reagent, and visualized by confocal microscopy. Detection of VP40 proteins is shown in the first column, detection of F-actin is shown in the second column, detection of nuclei is shown in the third column, and merged images are shown in the last column. Bars, 7.5 μm.
FIG 6
FIG 6
Filamentous structures of Zaire and Sudan VLPs produced in MVA-EBOV/SUDV-infected cells. Subconfluent HeLa cells cultured on glass coverslips were mock infected or infected at 50 PFU/cell with MVA-GP-2A-VP40 Zaire (A), MVA-GP-2A-VP40 Sudan (A), and MVA-GP-VP40 Zaire (B), fixed at 18 hpi with 3% PFA, quenched in the presence of NH4Cl, permeabilized, blocked with saponin-FCS, and labeled with antibodies against the GP Zaire and GP Sudan proteins (A) or against the VP40 Zaire protein (B). Then, cells were treated with secondary antibodies conjugated with the fluorochrome Alexa Fluor 488 (green), the probe phalloidin (to stain F-actin, shown in blue), and DAPI (to mark DNA, shown in gray). Coverslips were mounted on glass slides, conserved in ProLong Gold antifade reagent, and visualized by confocal microscopy. Detection of GP or VP40 proteins (in green) around the cellular membrane is shown in the merge pictures of the first column, and extracellular detection of GP or VP40 proteins is shown in the second column. Zaire and Sudan VLPs are indicated with white arrows. Bars, 5 μm. In panel B (bottom), a superresolution image taken using stimulated emission depletion (STED) microscopy is shown. The diameters of the filamentous VLPs are indicated.
FIG 7
FIG 7
Identification by electron microscopy of Zaire and Sudan VLPs in purified supernatants of MVA-EBOV/SUDV-infected cells. (A) Expression of GP and VP40 proteins in purified supernatants of MVA-EBOV/SUDV-infected cells. HeLa cells were infected at 10 PFU/cell with MVA-GP-2A-VP40 Zaire, MVA-GP-2A-VP40 Sudan, MVA-GP-VP40 Zaire, or MVA-WT. At 24 hpi, supernatants were collected and purified by ultracentrifugation through a 20% sucrose cushion, and pellets were resuspended in Laemmli buffer, fractionated by 10% SDS-PAGE, and analyzed by Western blotting using antibodies against the GP and VP40 proteins. Arrows on the right indicate the positions of the GP and VP40 proteins. The sizes of standards (in kilodaltons) are indicated on the left. (B to H) Detection by electron microscopy of EBOV VLPs in purified supernatants of MVA-GP-VP40 Zaire-infected cells. HeLa cells were infected at 10 PFU/cell with MVA-GP-VP40 Zaire (B to G) or MVA-WT (H). At 24 hpi, supernatants were collected, purified by ultracentrifugation through a 20% sucrose cushion, stabilized with PFA, dialyzed, adsorbed to nickel grids, and treated with a rabbit antibody against GP Zaire. Then, the grids were treated with secondary antibodies conjugated with gold beads and stained with 2% uranyl acetate, and the VLPs were visualized by transmission electron microscope. Bars, 0.2 μm (B and C), 100 nm (D, E, and H), and 50 nm (F and G).
FIG 8
FIG 8
Innate immune responses triggered by MVA-EBOV/SUDVs in human macrophages. Human THP-1 macrophages were mock infected or infected with MVA-WT, parental MVA-GFP, and MVA-EBOV/SUDVs at 5 PFU/cell. At 6 hpi, RNA was extracted and the mRNA levels of IFN-β, TNF-α, MIP-1α, MDA-5, IFIT1, IFIT2, IL-6, RANTES, and HPRT were analyzed by quantitative reverse transcription-PCR. Results are expressed as the ratio of the level of the gene of interest to the HPRT mRNA level. A.U., arbitrary units. Data are means ± standard deviations for duplicate samples from one experiment and are representative of two independent experiments. P values indicate significantly higher responses between different groups (*, P < 0.05; **, P < 0.005; ***, P < 0.001; ****, P < 0.0001).
FIG 9
FIG 9
Recruitment of immune cells in the peritoneal cavity of mice inoculated with MVA-EBOVs expressing GP and VP40. Groups of BALB/c mice (n = 4) were inoculated i.p. with 107 PFU of parental MVA-GFP, MVA-GP Zaire, MVA-GP-2A-VP40 Zaire, MVA-GP-VP40 Zaire, or PBS. At 12 h postinoculation, peritoneal exudate cells were collected and the presence of different immune cells was analyzed by flow cytometry. The absolute numbers of neutrophils, macrophages, NK cells, NK T cells, dendritic cells, B cells, CD4 T cells, and CD8 T cells are shown. Graphs show the mean ± SEM, with each point representing an individual mouse. P values indicate significantly higher responses between different groups (*, P < 0.05; **, P < 0.005; ***, P < 0.001; ****, P < 0.0001).
FIG 10
FIG 10
Humoral immune response against GP Zaire and GP Sudan induced by MVA-EBOV/SUDVs. Groups of BALB/c mice (n = 5) were immunized intramuscularly with two doses of MVA-GP Zaire, MVA-GP Sudan, MVA-GP Zaire + Sudan, MVA-GP-2A-VP40 Zaire, MVA-GP-2A-VP40 Sudan, MVA-GP-2A-VP40 Zaire + Sudan, MVA-GP-VP40 Zaire, or MVA-WT at weeks 0 and 4. Three weeks after the last immunization serum samples were collected and the titers of total IgG antibody against GP Zaire and GP Sudan proteins (A) or IgG1, IgG2a, and IgG3 isotype antibodies against GP Zaire and GP Sudan proteins (B) in serum samples obtained from each individual mouse (A) or in pooled sera from each immunization group (B) were analyzed by ELISA. Data are from one experiment and are representative of two independent experiments. Antibody titers were calculated as the serum dilution that gave an absorbance at least 3 times higher than that for a naive serum sample. In panel A, the graphs show the mean ± SEM, with each point representing an individual mouse. The detection limit was 40. In panel B, bars represent the mean ± SEM for duplicate samples from pooled sera. P values indicate significantly higher responses between different groups (*, P < 0.05; **, P < 0.005; ***, P < 0.001; ****, P < 0.0001).
FIG 11
FIG 11
Humoral immune response against VP40 Zaire and VP40 Sudan induced by MVA-EBOV/SUDVs. Groups of BALB/c mice (n = 5) were immunized intramuscularly with two doses of MVA-EBOV/SUDVs, following the protocol described in Materials and Methods. The titers of total IgG antibody against VP40 Zaire and VP40 Sudan proteins are indicated. Data are from one experiment and are representative of two independent experiments. Antibody titers were calculated as the serum dilution that gave an absorbance at least 3 times higher than that for a naive serum sample. Graphs show the mean ± SEM, with each point representing an individual mouse. The detection limit was 40. P values indicate significantly higher responses between different groups (***, P < 0.001; ****, P < 0.0001).
FIG 12
FIG 12
Efficacy of MVA-EBOVs expressing GP and VP40 proteins in a mouse challenge model. Groups of bone marrow chimeric WT → IFNAR−/− C57BL/6 mice (n = 5) were immunized i.p. with one dose of MVA-GP Zaire, MVA-GP-2A-VP40 Zaire, MVA-GP-VP40 Zaire, or MVA-WT and challenged i.p. 4 weeks later with a lethal dose of EBOV (1,000 PFU), following the protocol described in Materials and Methods. After challenge, mice were monitored daily for signs of disease and body weight for 11 days, and those mice with a weight loss higher than 20% of the initial weight were euthanized. The percent survival is represented. P values indicate significantly higher responses when the group infected with MVA-GP-VP40 Zaire was compared with the other groups (*, P = 0.0055).

Similar articles

Cited by

References

    1. Feldmann H, Geisbert TW. 2011. Ebola haemorrhagic fever. Lancet 377:849–862. doi:10.1016/S0140-6736(10)60667-8. - DOI - PMC - PubMed
    1. Bukreyev AA, Chandran K, Dolnik O, Dye JM, Ebihara H, Leroy EM, Muhlberger E, Netesov SV, Patterson JL, Paweska JT, Saphire EO, Smither SJ, Takada A, Towner JS, Volchkov VE, Warren TK, Kuhn JH. 2014. Discussions and decisions of the 2012-2014 International Committee on Taxonomy of Viruses (ICTV) Filoviridae Study Group, January 2012-June 2013. Arch Virol 159:821–830. doi:10.1007/s00705-013-1846-9. - DOI - PMC - PubMed
    1. Ye L, Yang C. 2015. Development of vaccines for prevention of Ebola virus infection. Microbes Infect 17:98–108. doi:10.1016/j.micinf.2014.12.004. - DOI - PubMed
    1. Ohimain EI. 2016. Recent advances in the development of vaccines for Ebola virus disease. Virus Res 211:174–185. doi:10.1016/j.virusres.2015.10.021. - DOI - PubMed
    1. Leroy EM, Gonzalez JP, Baize S. 2011. Ebola and Marburg haemorrhagic fever viruses: major scientific advances, but a relatively minor public health threat for Africa. Clin Microbiol Infect 17:964–976. doi:10.1111/j.1469-0691.2011.03535.x. - DOI - PubMed

Publication types

MeSH terms

LinkOut - more resources