. 2018 May 7;217(5):1633-1641.
doi: 10.1083/jcb.201706058. Epub 2018 Mar 7.

CLAMP/Spef1 regulates planar cell polarity signaling and asymmetric microtubule accumulation in the Xenopus ciliated epithelia

Affiliations

CLAMP/Spef1 regulates planar cell polarity signaling and asymmetric microtubule accumulation in the Xenopus ciliated epithelia

Sun K Kim et al. J Cell Biol. .

Abstract

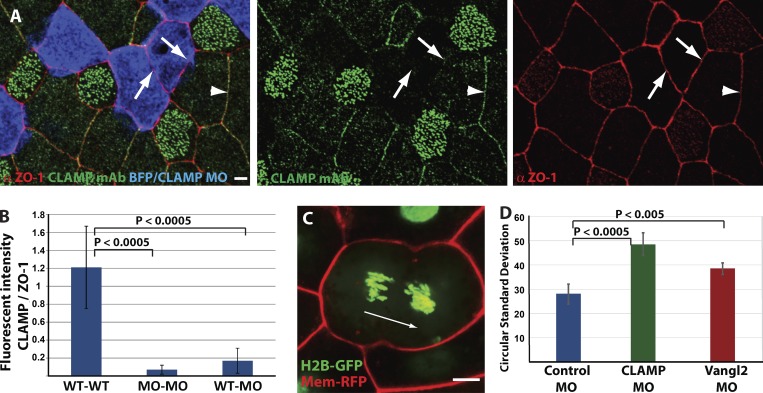
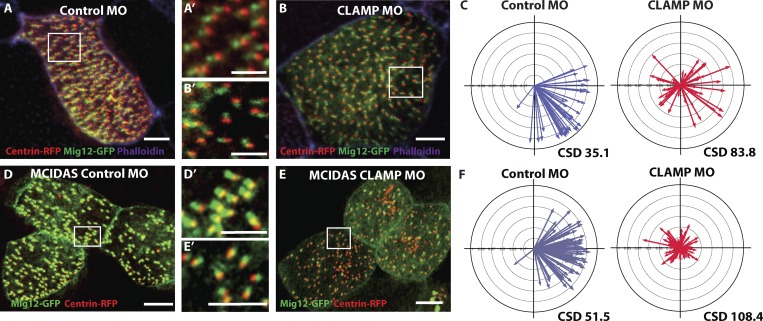
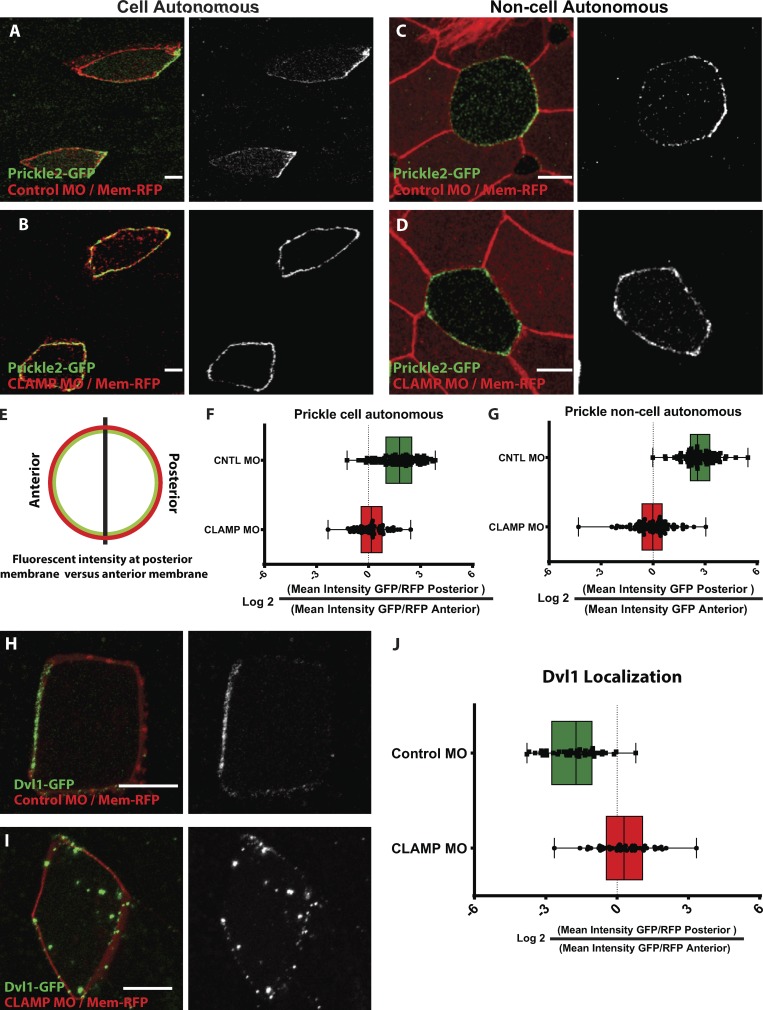
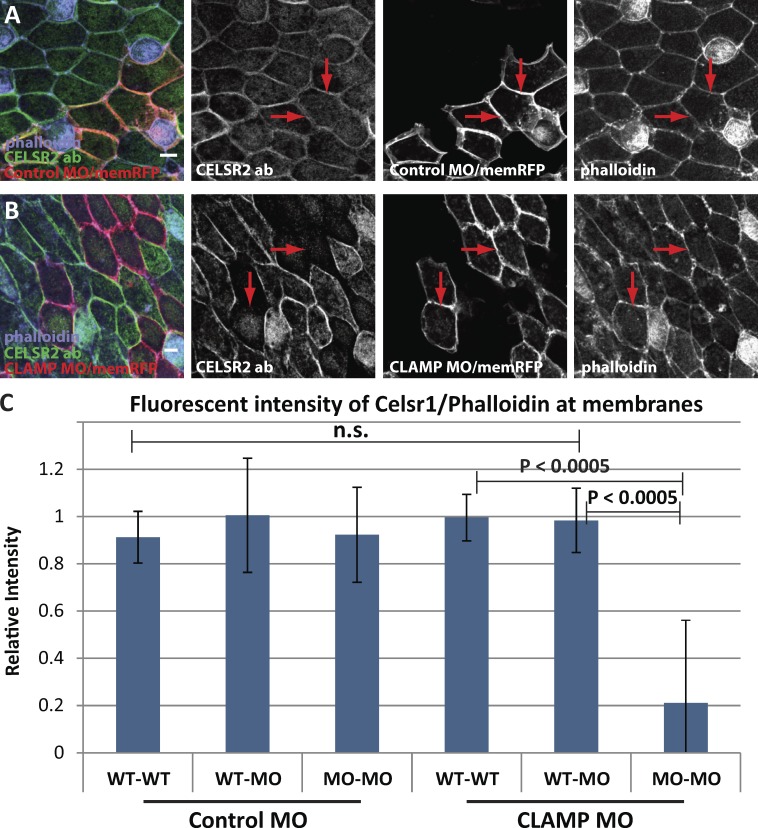
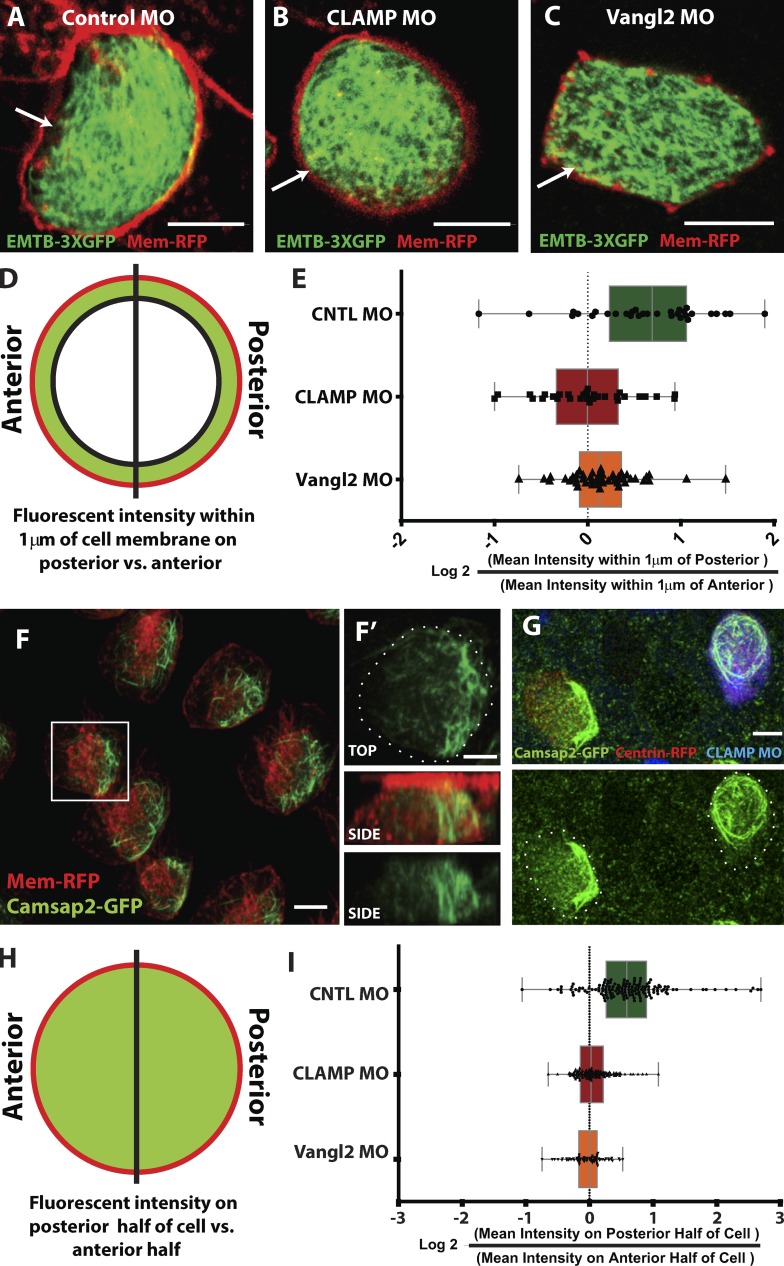
Most epithelial cells polarize along the axis of the tissue, a feature known as planar cell polarity (PCP). The initiation of PCP requires cell-cell signaling via the noncanonical Wnt/PCP pathway. Additionally, changes in the cytoskeleton both facilitate and reflect this polarity. We have identified CLAMP/Spef1 as a novel regulator of PCP signaling. In addition to decorating microtubules (MTs) and the ciliary rootlet, a pool of CLAMP localizes at the apical cell cortex. Depletion of CLAMP leads to the loss of PCP protein asymmetry, defects in cilia polarity, and defects in the angle of cell division. Additionally, depletion of CLAMP leads to a loss of the atypical cadherin-like molecule Celrs2, suggesting that CLAMP facilitates the stabilization of junctional interactions responsible for proper PCP protein localization. Depletion of CLAMP also affects the polarized organization of MTs. We hypothesize that CLAMP facilitates the establishment of cell polarity and promotes the asymmetric accumulation of MTs downstream of the establishment of proper PCP.


Figures

Figure 1.
Figure 1.
CLAMP depletion has a non–cell-autonomous effect on CLAMP membrane localization and polarized cell division. (A) Ab staining of CLAMP mAb (green) and ZO-1 (red) reveal a strong association of CLAMP to the cell cortex. In mosaic tissues where CLAMP MO is marked with blue fluorescent protein (BFP, blue), CLAMP mAb staining is lost within and at the borders of CLAMP morphants and WT cells (blue; arrows) relative to WT–WT boundaries (arrowhead). (B) Quantification of fluorescent intensity of CLAMP mAb relative to ZO-1 Ab at the WT–WT boundary (n = 43), MO–MO (n = 42) and WT–MO (n = 82) cells in CLAMP morphant mosaic tissues. (C and D) Quantitative analysis (D) of the angle of cell division (representative image, C) measuring the CSD relative to the A-P axis in control MO (n > 500 cells from seven embryos), CLAMP MO (n > 300 cells from seven embryos) and Vangl2 MO cells (n > 700 cells from six embryos). In both B and D, error bars represent the SD, and p-values represent the t test (two-tailed, type 2). In all images, posterior is to the right. Bars, 5 µm.
Figure 2.
Figure 2.
CLAMP affects cilia and MCC polarity. (A and B) Cilia polarity as assessed by the position of the rootlet marked with Mig12-GFP (green) relative to basal body marked with centrin4-RFP (red) in control MO (A) and CLAMP MO 5 ng (B) cells. Insets (A′ and B′) show the orientation of individual cilia. In all pictures and in all the quantification throughout the paper, anterior is to the left and posterior is to the right. (C) Quantification of morphant MCC polarity (n = 46 cells for each condition) as scored by the mean cilia direction within each cell (arrow direction) and the variation around that mean (arrow length such that long arrow represents low variance). (D–F) Similar analysis to A–C done on ectopic MCCs induced by the expression of MCIDAS using mosaic tissue injected with 10 ng of MO (n = 61 cells for control MO and 82 for CLAMP MO). Posterior is to the right. Bars: 5 µm; (insets) 2.5 µm.
Figure 3.
Figure 3.
CLAMP controls PCP protein asymmetry. (A–G) GFP-Pk2 (green) asymmetrically accumulates on the posterior side of cells (A and C) which we quantify (n > 50 cells for each condition) by measuring the fluorescent intensity on the posterior side versus the anterior side (E–G) of control (CNTL) cells (relative to mem-RFP, red, in F). This asymmetry is lost in CLAMP morphant tissues marked with mem-RFP (red) both cell-autonomously (A, B, and F) and non–cell-autonomously (C, D, and G). (H–J) Dvl1-GFP (green) asymmetrically accumulates on the anterior side of cells (H and J), which we quantify by measuring the fluorescent intensity on the posterior side versus the anterior side (J) of the cell relative to mem-RFP (red) in control MO (n = 82 cells) and CLAMP MO (n = 36 cells). Graphs are whisker plots where the error bars represent the range; the line in the box represents the median and the box represents the upper and lower quartile. Posterior is to the right. Bars, 5 µm.
Figure 4.
Figure 4.
CLAMP depletion affects Ceslr2 membrane localization. (A and B) Ceslr2 Ab staining (green/white) in mosaic tissues injected with mem-RFP together with control MO (A) or CLAMP MO (B) (red/white) with cell membranes marked with phalloidin (purple/white). (C) Quantification of Ceslr2 fluorescent intensity relative to phalloidin at cell contacts between WT–WT (n = 8), WT–MO (n = 7), and MO–MO (n = 10) cells. Error bars represent the SD, and p-values represent the t test (two-tailed, type 2). Bars, 10 µm.
Figure 5.
Figure 5.
CLAMP depletion affects microtubule asymmetry. (A–C) Imaging of microtubules using the EMTB-3xGFP (green) relative to the cell cortex marked with mem-RFP (red) reveals a gap between the microtubules and the cortex at the anterior side of the cell but not the posterior side that is lost in both CLAMP (B) and Vangl2 (C) morphant cells. (D and E) This phenotype was quantified by measuring the mean fluorescent intensity of EMTB-3xGFP within 1 µm of the cell cortex on the posterior side relative to the anterior side (D) in control (n = 33 cells), CLAMP (n = 30 cells), and Vangl2 (n = 48 cells) morphant cells at the level of the basal bodies (E). (F–I) Confocal stacks (∼8 µm deep) of CAMSAP2-GFP (green, F and F′ top and F′ side) reveal a posterior (to the right) bias in MCCs (red; RFP driven by the α-tubulin promoter) that projects across the entire posterior side of the cell (F′ top and side). Mosaic tissue showing a loss of CAMSAP2 (green) asymmetry in CLAMP morphant MCC marked with dextran (blue) compared with a WT MCC (green only; G). Quantification of the CAMSAP2 phenotype measuring the mean fluorescent intensity of CAMSAP2 within the posterior half of the cell relative to the anterior half (H) in control (n = 143 cells), CLAMP (n = 136 cells), and Vangl2 (n = 77 cells) morphant cells (I). Graphs are whisker plots where the error bars represent the range; the line in the box represents the median and the box represents the upper and lower quartile. In all images, posterior is to the right. Bars: 5 µm; (inset) 2.5 µm.

Similar articles

Cited by

References

    1. Boutin C., Labedan P., Dimidschstein J., Richard F., Cremer H., André P., Yang Y., Montcouquiol M., Goffinet A.M., and Tissir F.. 2014. A dual role for planar cell polarity genes in ciliated cells. Proc. Natl. Acad. Sci. USA. 111:E3129–E3138. 10.1073/pnas.1404988111 - DOI - PMC - PubMed
    1. Bush A., and Hogg C.. 2012. Primary ciliary dyskinesia: recent advances in epidemiology, diagnosis, management and relationship with the expanding spectrum of ciliopathy. Expert Rev. Respir. Med. 6:663–682. 10.1586/ers.12.60 - DOI - PubMed
    1. Butler M.T., and Wallingford J.B.. 2015. Control of vertebrate core planar cell polarity protein localization and dynamics by Prickle 2. Development. 142:3429–3439. 10.1242/dev.121384 - DOI - PMC - PubMed
    1. Butler M.T., and Wallingford J.B.. 2017. Planar cell polarity in development and disease. Nat. Rev. Mol. Cell Biol. 18:375–388. 10.1038/nrm.2017.11 - DOI - PMC - PubMed
    1. Cha S.W., Tadjuidje E., Wylie C., and Heasman J.. 2011. The roles of maternal Vangl2 and aPKC in Xenopus oocyte and embryo patterning. Development. 138:3989–4000. 10.1242/dev.068866 - DOI - PMC - PubMed

Publication types

Substances

LinkOut - more resources