. 2018 May 7;217(5):1589-1599.
doi: 10.1083/jcb.201709171. Epub 2018 Mar 7.

Cell size-dependent regulation of Wee1 localization by Cdr2 cortical nodes

Affiliations

Cell size-dependent regulation of Wee1 localization by Cdr2 cortical nodes

Corey A H Allard et al. J Cell Biol. .

Abstract

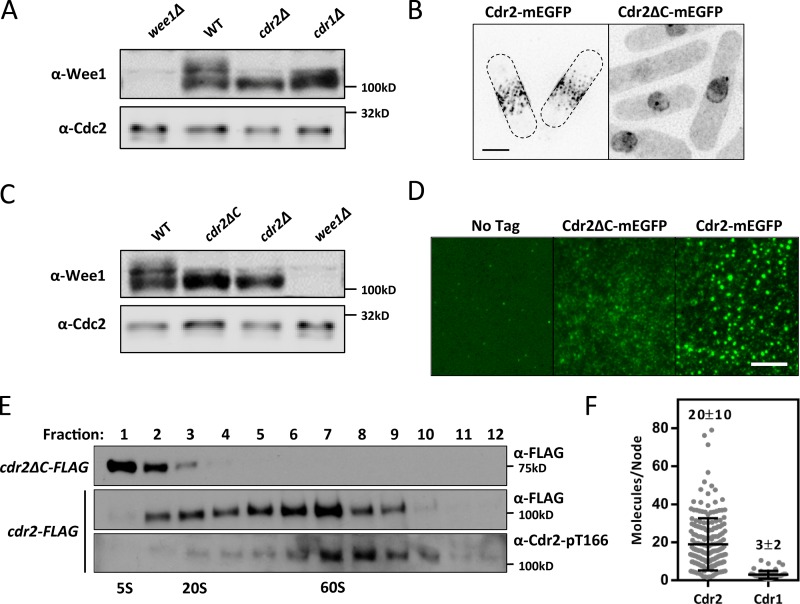
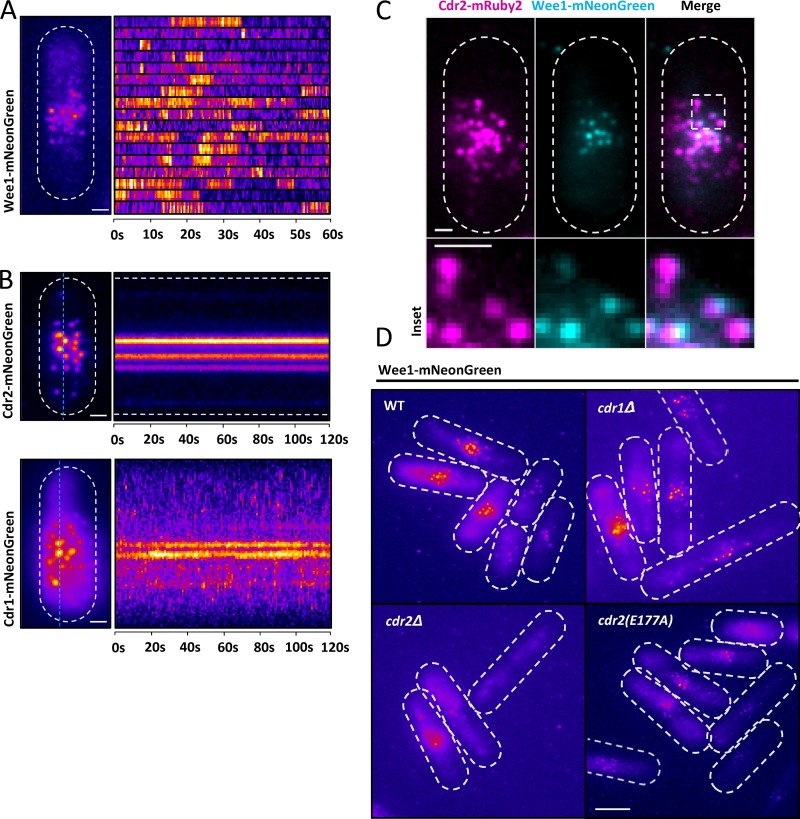
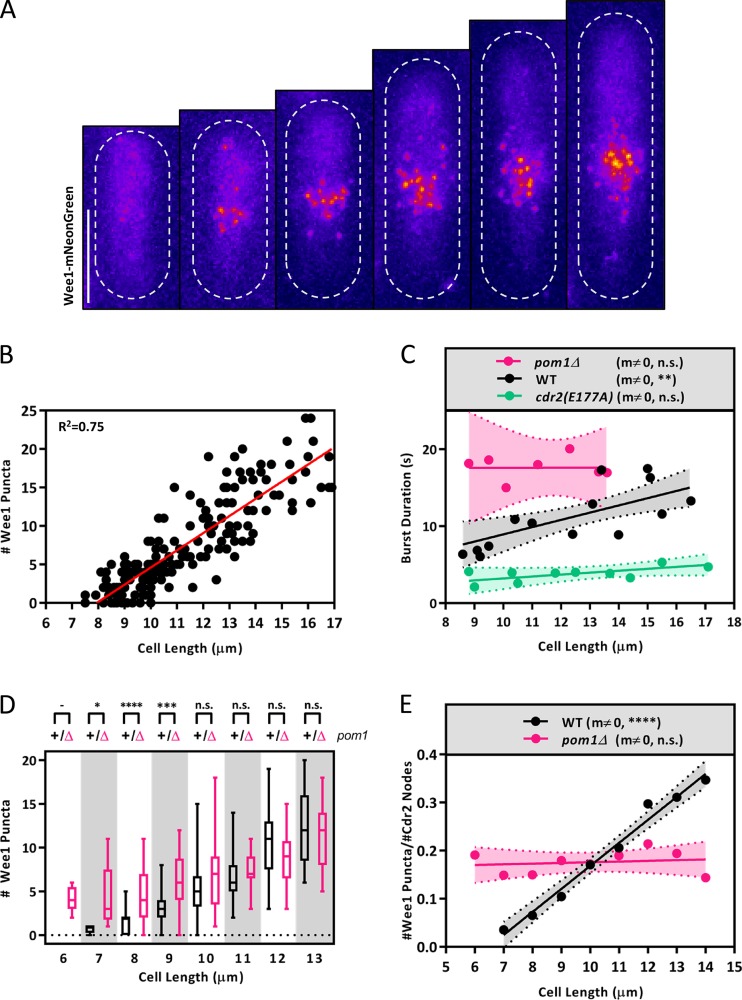
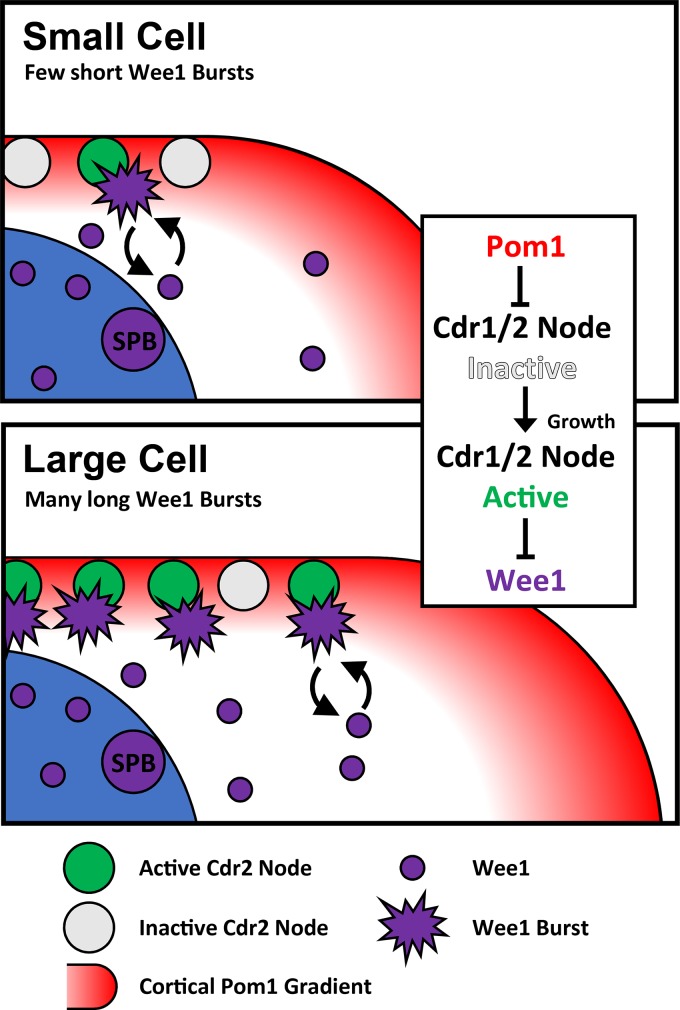
Cell size control requires mechanisms that link cell growth with Cdk1 activity. In fission yeast, the protein kinase Cdr2 forms cortical nodes that include the Cdk1 inhibitor Wee1 along with the Wee1-inhibitory kinase Cdr1. We investigated how nodes inhibit Wee1 during cell growth. Biochemical fractionation revealed that Cdr2 nodes were megadalton structures enriched for activated Cdr2, which increases in level during interphase growth. In live-cell total internal reflection fluorescence microscopy videos, Cdr2 and Cdr1 remained constant at nodes over time, but Wee1 localized to nodes in short bursts. Recruitment of Wee1 to nodes required Cdr2 kinase activity and the noncatalytic N terminus of Wee1. Bursts of Wee1 localization to nodes increased 20-fold as cells doubled in size throughout G2. Size-dependent signaling was caused in part by the Cdr2 inhibitor Pom1, which suppressed Wee1 node bursts in small cells. Thus, increasing Cdr2 activity during cell growth promotes Wee1 localization to nodes, where inhibitory phosphorylation of Wee1 by Cdr1 and Cdr2 kinases promotes mitotic entry.


Figures

Figure 1.
Figure 1.
Nodes are stable scaffolds that facilitate inhibition of Wee1. (A) Wee1 phosphorylation is disrupted in cdr1Δ and cdr2Δ cells. Whole-cell extracts were separated by SDS-PAGE, and endogenous Wee1 was detected by Western blotting. (B) Localization of Cdr2-mEGFP and Cdr2ΔC-mEGFP in cells. Maximum-intensity projections from z series are shown. (C) Wee1 phosphorylation is disrupted in cdr2ΔC cells. Whole-cell extracts were analyzed as in A. Data in A and C are taken from the same Western blot, and the wee1Δ lane is the same in both. (D) Visualization of node-like puncta by TIRF microscopy in whole-cell extracts from the indicated strains. Bars, 5 µm. (E) Detergent extracts from cdr2-FLAG or cdr2ΔC-FLAG cells were subjected to velocity sucrose gradient sedimentation, and fractions were probed against the FLAG tag or against Cdr2(pT166). Fraction 1 corresponds with the top of the gradient and contains smaller complexes; fraction 12 corresponds with bottom of the gradient. S values were determined using size standards run on identical gradients. (F) Quantification of the number of Cdr2 and Cdr1 molecules per node (means ± SD; n > 65 each) based on superresolution live-cell fluorescence microscopy.
Figure 2.
Figure 2.
Wee1 localization to nodes requires Cdr2 kinase activity and the Wee1 N terminus. (A) Schematic of Wee1 and Cdr2 functional domains. Values represent amino acid positions. (B) The Wee1 N terminus interacts with WT Cdr2 but not with kinase-dead Cdr2(E177A) in the yeast two-hybrid assay. Transformants were selected on a double-dropout (DDO) plate, and interactions were tested on a quadruple-dropout plate containing aureobasidin, X-gal, and 3-AT (QDO/A/X/3AT) plate. Positive interactions are indicated by growth of blue colonies on selective plates. (C) Localization of the indicated Wee1 constructs overexpressed from the P81nmt1 promoter. Middle–focal plane widefield images with inverted contrast are shown, and insets show enlarged views of dashed boxes. Bars, 5 µm. (D) Length of dividing septated cells of the indicated genotypes (means ± SD; n > 50 cells). ****, P < 0.0001; n.s., P > 0.05.
Figure 3.
Figure 3.
Wee1 puncta bind transiently to stable Cdr2 nodes. (A) Localization of Wee1-mNeonGreen by TIRF microscopy. Left: Maximum-intensity projection of a 60-s time series imaged at 1-s intervals. Right: Single-node 3 × 3–pixel kymographs of each Wee1 burst that appeared during the 60-s time lapse. See Video 1. (B) Cdr2 and Cdr1 are stationary during 2-min TIRF microscopy time-lapse acquisitions. Left: Maximum-intensity projections of time-lapse acquisitions with 1-s intervals. Right: Kymographs of the time lapse along the cyan dashed line. See Videos 2 and 3. (C) Wee1 bursts colocalize with Cdr2 nodes. Images are dual-channel simultaneously acquired TIRF microscopy images. (D) Localization of Wee1 by TIRF microscopy in the indicated strains. Images are maximum-intensity projections of 60-s time lapses imaged at 1-s intervals. Bars: (A–C) 1 µm; (D) 5 µm.
Figure 4.
Figure 4.
Wee1 accumulation at nodes is size dependent and buffered by Pom1. (A) Representative images of Wee1 node localization in cells of increasing size imaged by TIRF microscopy. Bar, 5 µm. (B) Quantification of the number of Wee1 puncta as a function of cell size. Values were obtained from TIRF images with 1-s exposure. Data fit a linear regression model. (C) Wee1 burst duration scales with cell size in WT but not cdr2(E177A) or pom1Δ cells. The duration of individual Wee1-mNeonGreen bursts was measured using time-lapse TIRF microscopy for cells of the indicated genotype. Dots correspond with mean burst duration plotted as a function of cell size. Lines are linear regressions fit to these data. Dotted lines indicate the 95% confidence interval of the linear regression accounting for SD and sample size of the mean for each data point. The resulting slope is significantly nonzero (m ≠ 0) for WT (P = 0.002; R2 = 0.02) but not for pom1Δ (P = 0.01; R2 = 0.01) or cdr2(E177A) (P = 0.9; R2 = 3.3e−7). (D) Pom1 suppresses Wee1 bursts in small cells. The number of Wee1 puncta was quantified as in B for WT and pom1Δ cells, and the data were binned according to cell size. Boxes indicate means and SD, and whiskers indicate minimum and maximum values. The number of Wee1 bursts is significantly different between WT and pom1Δ in the three smallest bins (7 µm: *, P = 0.01; 8 µm: ****, P < 0.0001; 9 µm: ***, P = 0.0003; 10–13 µm: P > 0.5). The 6-µm bin contains only pom1Δ cells (nbin(WT/pom1Δ)) = 6 µm (0/5), 7 µm (4/10), 8 µm (28/23), 9 µm (34/24), 10 µm (32/25), 11 µm (17/21), 12 µm (21/15), and 13 µm (21/21). (E) Relative accumulation of Wee1 puncta and Cdr2 nodes in WT and pom1Δ cells as a function of cell size. Linear regressions and 95% confidence intervals are shown. The slope of the linear regression is significantly nonzero for WT (P < 0.0001; R2 = 0.98) but not for pom1Δ (P = 0.7; R2 = 0.26).
Figure 5.
Figure 5.
A working model for size-dependent control of Wee1 by bursts of node localization. See text for discussion.

Similar articles

Cited by

References

    1. Akamatsu M., Berro J., Pu K.-M., Tebbs I.R., and Pollard T.D.. 2014. Cytokinetic nodes in fission yeast arise from two distinct types of nodes that merge during interphase. J. Cell Biol. 204:977–988. 10.1083/jcb.201307174 - DOI - PMC - PubMed
    1. Akamatsu M., Lin Y., Bewersdorf J., and Pollard T.D.. 2017. Analysis of interphase node proteins in fission yeast by quantitative and super resolution fluorescence microscopy. Mol. Biol. Cell. 28:3203–3214. 10.1091/mbc.E16-07-0522 - DOI - PMC - PubMed
    1. Aligue R., Wu L., and Russell P.. 1997. Regulation of Schizosaccharomyces pombe Wee1 tyrosine kinase. J. Biol. Chem. 272:13320–13325. 10.1074/jbc.272.20.13320 - DOI - PubMed
    1. Bähler J., Wu J.Q., Longtine M.S., Shah N.G., McKenzie A. III, Steever A.B., Wach A., Philippsen P., and Pringle J.R.. 1998. Heterologous modules for efficient and versatile PCR-based gene targeting in Schizosaccharomyces pombe. Yeast. 14:943–951. 10.1002/(SICI)1097-0061(199807)14:10<943::AID-YEA292>3.0.CO;2-Y - DOI - PubMed
    1. Bhatia P., Hachet O., Hersch M., Rincon S.A., Berthelot-Grosjean M., Dalessi S., Basterra L., Bergmann S., Paoletti A., and Martin S.G.. 2014. Distinct levels in Pom1 gradients limit Cdr2 activity and localization to time and position division. Cell Cycle. 13:538–552. 10.4161/cc.27411 - DOI - PubMed

Publication types

MeSH terms