

Obesity and its association with sociodemographic factors, health behaviours and health status among Aboriginal and non-Aboriginal adults in New South Wales, Australia
- PMID: 29514925
- PMCID: PMC5969392
- DOI: 10.1136/jech-2017-210064
Obesity and its association with sociodemographic factors, health behaviours and health status among Aboriginal and non-Aboriginal adults in New South Wales, Australia
Abstract
Background: High body mass index (BMI) is the second leading contributor to Australia's burden of disease and is particularly prevalent among Aboriginal peoples. This paper aims to provide insight into factors relating to obesity among Aboriginal adults and Aboriginal-non-Aboriginal differences.
Methods: Cross-sectional analysis of data from the 45 and Up Study, comparing obesity (BMI ≥30 kg/m2) prevalence and risk factors among 1515 Aboriginal and 213 301 non-Aboriginal adults in New South Wales. Age-sex-adjusted prevalence ratios (PRs) for obesity by sociodemographic factors, health behaviours and health status were estimated (multivariable log-binomial regression) for Aboriginal and non-Aboriginal participants separately. We quantified the extent to which key factors (physical activity, screen time, education, remoteness, area-level disadvantage) accounted for any excess Aboriginal obesity prevalence.
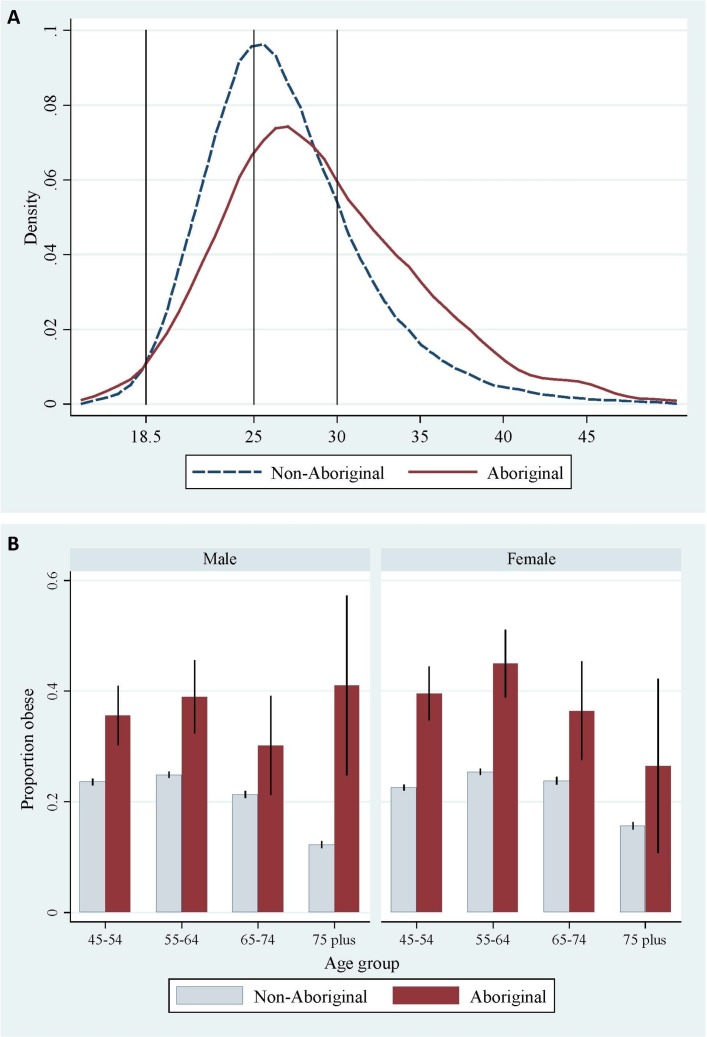
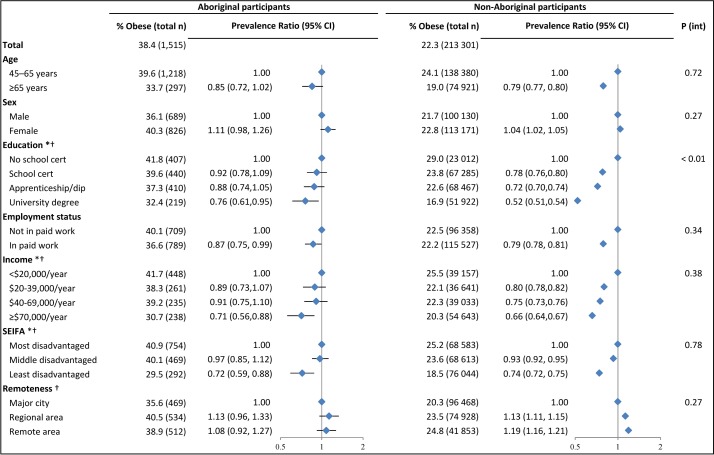
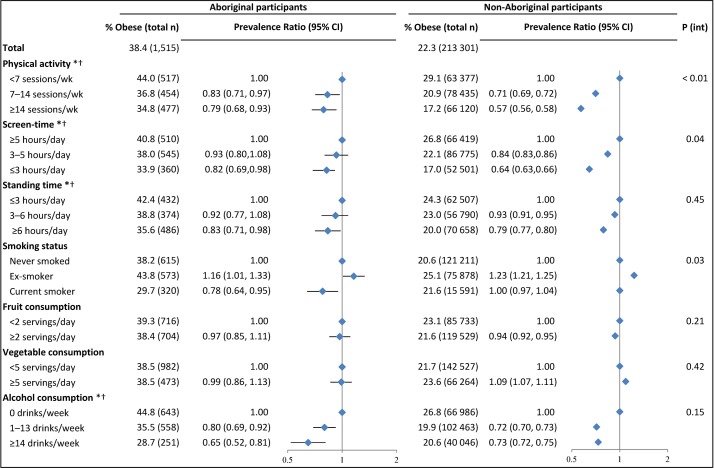
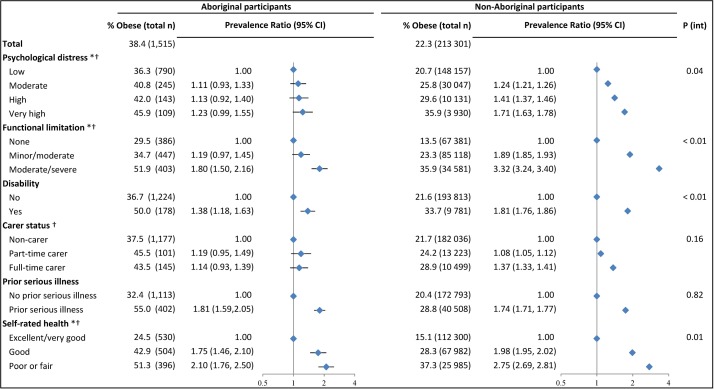
Results: Obesity prevalence was 39% among Aboriginal and 22% among non-Aboriginal participants (PR=1.65, 95% CI 1.55 to 1.76). Risk factors for obesity were generally similar for Aboriginal and non-Aboriginal participants and included individual-level and area-level disadvantage, physical inactivity, and poor physical and mental health, with steeper gradients observed among non-Aboriginal participants for some factors (Pinteraction <0.05). Many risk factors were more common among Aboriginal versus non-Aboriginal participants; key factors accounted for >40% of the excess Aboriginal obesity prevalence.
Conclusion: A substantial proportion of the excess obesity prevalence among Aboriginal versus non-Aboriginal participants was explained by physical activity, screen time, education, remoteness and area-level disadvantage. Socioeconomic and health behaviour factors are potential targets for promoting healthy BMI, but these must be considered within the context of upstream social and cultural factors. Adults with health needs and disability require particular attention.
Keywords: epidemiology; health Inequalities; obesity.
© Article author(s) (or their employer(s) unless otherwise stated in the text of the article) 2018. All rights reserved. No commercial use is permitted unless otherwise expressly granted.
Conflict of interest statement
Competing interests: EB and BL are supported by the National Health and Medical Research Council of Australia (reference: 1042717, 1069477). KT is supported by the Lowitja Institute (reference: 1344).
Figures
Similar articles
-
The overall health and risk factor profile of Australian Aboriginal and Torres Strait Islander participants from the 45 and up study.BMC Public Health. 2013 Jul 17;13:661. doi: 10.1186/1471-2458-13-661. BMC Public Health. 2013. PMID: 23866062 Free PMC article.
-
Temporal trends in weight and current weight-related behaviour of Australian Aboriginal school-aged children.Med J Aust. 2014 Jun 16;200(11):667-71. doi: 10.5694/mja13.10614. Med J Aust. 2014. PMID: 24938350
-
Physical Functional Limitations among Aboriginal and Non-Aboriginal Older Adults: Associations with Socio-Demographic Factors and Health.PLoS One. 2015 Sep 30;10(9):e0139364. doi: 10.1371/journal.pone.0139364. eCollection 2015. PLoS One. 2015. PMID: 26422239 Free PMC article.
-
Impact of racism and discrimination on physical and mental health among Aboriginal and Torres Strait islander peoples living in Australia: a systematic scoping review.BMC Public Health. 2021 Jul 3;21(1):1302. doi: 10.1186/s12889-021-11363-x. BMC Public Health. 2021. PMID: 34217243 Free PMC article.
-
Do dose administration aids support medication adherence for Aboriginal and Torres Strait Islander peoples? An exploration of patients' perspectives, experiences and use on the North Coast of New South Wales.Rural Remote Health. 2022 Dec;22(4):7142. doi: 10.22605/RRH7142. Epub 2022 Dec 1. Rural Remote Health. 2022. PMID: 36455186 Review.
Cited by
-
Exploring the multifaceted factors influencing overweight and obesity: a scoping review.Front Public Health. 2025 Apr 9;13:1540756. doi: 10.3389/fpubh.2025.1540756. eCollection 2025. Front Public Health. 2025. PMID: 40270730 Free PMC article.
-
Socioeconomic status, remoteness and tracking of nutritional status from childhood to adulthood in an Australian Aboriginal Birth Cohort: the ABC study.BMJ Open. 2020 Jan 27;10(1):e033631. doi: 10.1136/bmjopen-2019-033631. BMJ Open. 2020. PMID: 31992605 Free PMC article.
-
Culturally safe interventions in primary care for the management of chronic diseases of urban Indigenous People: a scoping review.Fam Med Community Health. 2022 May;10(Suppl 1):e001606. doi: 10.1136/fmch-2022-001606. Fam Med Community Health. 2022. PMID: 35523458 Free PMC article.
-
Association between indigenous status and Body Mass Index (BMI) in Australian adults: Does sleep duration affect the relationship?PLoS One. 2022 Feb 16;17(2):e0263233. doi: 10.1371/journal.pone.0263233. eCollection 2022. PLoS One. 2022. PMID: 35171935 Free PMC article.
-
Prevalence and Sociodemographic Factors Associated with Overweight and Obesity among Adults in Poland: A 2019/2020 Nationwide Cross-Sectional Survey.Int J Environ Res Public Health. 2022 Jan 28;19(3):1502. doi: 10.3390/ijerph19031502. Int J Environ Res Public Health. 2022. PMID: 35162521 Free PMC article.
References
-
- Australian Institute of Health and Welfare. AIHW Australian Burden of Disease Study: impact and causes of illness and death in Australia 2011. Australian Burden of Disease Study series no. 3. : Canberra, 2016.
-
- Australian Bureau of Statistics. 4727.0.55.006 - Australian Aboriginal and torres strait islander health survey: updated results, 2012-13. 2014. http://www.abs.gov.au/AUSSTATS/abs@.nsf/mf/4727.0.55.006 (accessed 19 Apr 2016).
-
- Australian Institute of Health and Welfare. AIHW Australian Burden of Disease Study: impact and causes of illness and death in Aboriginal and Torres Strait Islander people 2011. Australian Burden of Disease Study series No. 6. : Canberra, 2016. - PubMed
-
- Australian Bureau of Statistics. 4364.0.55.001 - Australian health survey: updated results, 2011–12. 2012. http://www.abs.gov.au/ausstats/abs@.nsf/mf/4364.0.55.003 (accessed 19 Apr 2016).
Publication types
MeSH terms
LinkOut - more resources
Full Text Sources
Other Literature Sources
Medical
Research Materials