. 2018 May 1;29(9):1021-1030.
doi: 10.1091/mbc.E17-08-0514. Epub 2018 Mar 22.

A VCP inhibitor substrate trapping approach (VISTA) enables proteomic profiling of endogenous ERAD substrates

Affiliations

A VCP inhibitor substrate trapping approach (VISTA) enables proteomic profiling of endogenous ERAD substrates

Edmond Y Huang et al. Mol Biol Cell. .

Abstract

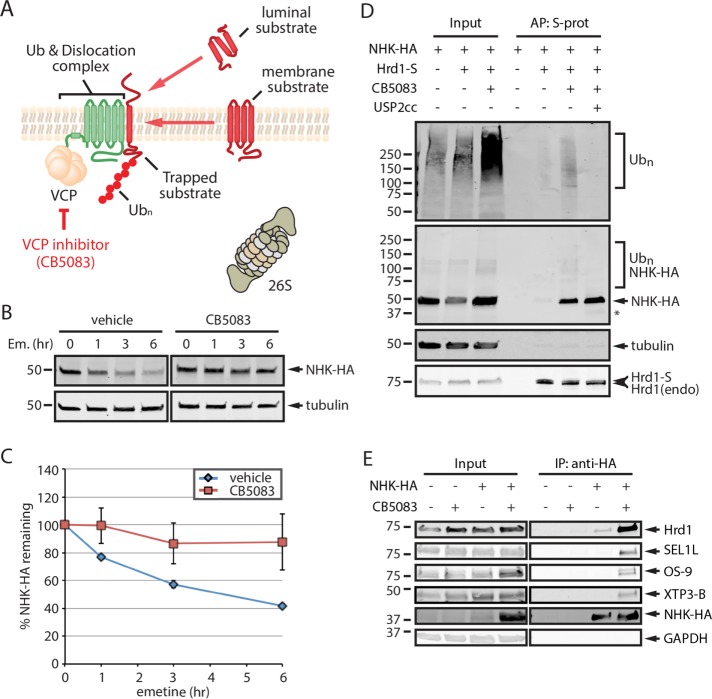
Endoplasmic reticulum (ER)-associated degradation (ERAD) mediates the proteasomal clearance of proteins from the early secretory pathway. In this process, ubiquitinated substrates are extracted from membrane-embedded dislocation complexes by the AAA ATPase VCP and targeted to the cytosolic 26S proteasome. In addition to its well-established role in the degradation of misfolded proteins, ERAD also regulates the abundance of key proteins such as enzymes involved in cholesterol synthesis. However, due to the lack of generalizable methods, our understanding of the scope of proteins targeted by ERAD remains limited. To overcome this obstacle, we developed a VCP inhibitor substrate trapping approach (VISTA) to identify endogenous ERAD substrates. VISTA exploits the small-molecule VCP inhibitor CB5083 to trap ERAD substrates in a membrane-associated, ubiquitinated form. This strategy, coupled with quantitative ubiquitin proteomics, identified previously validated (e.g., ApoB100, Insig2, and DHCR7) and novel (e.g., SCD1 and RNF5) ERAD substrates in cultured human hepatocellular carcinoma cells. Moreover, our results indicate that RNF5 autoubiquitination on multiple lysine residues targets it for ubiquitin and VCP--dependent clearance. Thus, VISTA provides a generalizable discovery method that expands the available toolbox of strategies to elucidate the ERAD substrate landscape.


Figures

FIGURE 1:
FIGURE 1:
VCP inhibition traps the ERAD substrate NHK in complex with the E3 ligase Hrd1. (A) Schematic of VISTA. Pharmacological inhibition of VCP with CB5083 prevents the dislocation of ubiquitinated ERAD substrates. (B) HEK293 cells expressing NHK-HA were incubated with 75 µM emetine and either vehicle or 5 µM CB5083 for the indicated time points. SDS lysates were analyzed by immunoblotting for the indicated targets. (C) The relative levels of NHK-HA (panel B) were quantified and presented as a percentage of the levels at time 0 h ± SEM (n = 3). (D) HEK293 cells stably expressing Hrd1-S were transiently transfected with NHK-HA, treated with vehicle or 5 µM CB5083, subject to affinity purification with S-protein (S-prot) agarose, and SDS lysates analyzed by immunoblotting; n = 3. (E) HEK293 cells stably expressing NHK-HA were treated with vehicle or 5 µM CB5083, subject to affinity purification with anti-HA–conjugated agarose, and SDS lysates analyzed by immunoblotting. Asterisk indicates a USP2cc-reactive band. AP, affinity purification; IP, immunoprecipitation; S-prot, S-protein; Ubn, ubiquitinated; endo, endogenous; Em., emetine.
FIGURE 2:
FIGURE 2:
Global analysis of trapped, ubiquitinated proteins identifies validated and candidate ERAD substrates in cultured liver cells. (A) Schematic of ERAD-VISTA experimental workflow. (B) HepG2 cells treated with vehicle or 5 µM CB5083 were fractionated by differential centrifugation and equal volumes analyzed by immunoblotting; n = 3. (C) Venn diagram comparing unique diGly-modified peptides identified from the four independent experiments. (D) Bar graph indicating the number of unique diGly sites identified for all proteins (blue) and for proteins with a SILAC ratio > 2 (red). (E) Pie chart illustrating the relative abundance of diGly-modified ubiquitin peptides, based on total spectral counts. (F) Log2 SILAC peptide ratios for individual diGly-modified peptides from ubiquitin. (G–I) Protein domain structure and the identified diGly-modified lysine residues for three validated endogenous ERAD substrates (ApoB100, DHCR7, and Insig2). TM: transmembrane domain. (J–L) Log2 SILAC peptide ratios for individual diGly-modified peptides from ApoB100 (J), DHCR7 (K), and Insig2 (L). Colors indicate the experiment from which the diGly peptide was identified, as in panel F. Mem., membrane; Ubn, ubiquitinated; Exp., experiment; TSC, total spectral counts. Asterisk indicates that the diGly peptide was not detected in that experiment. See also Supplemental Table S1.
FIGURE 3:
FIGURE 3:
Gene ontology analysis of candidate ERAD substrates. (A, B) DAVID and REVIGO were used to identify enriched GO terms, cellular component (A) or biological function (B), within the candidate ERAD substrate list. Cytoscape networks were generated by REVIGO. Circle size indicates the frequency of the GO term in the GO annotation database, edge thickness is proportional to the degree of GO term similarity, and color indicates the p value (red being more significant). See also Supplemental Table S2.
FIGURE 4:
FIGURE 4:
Endogenous SCD1 and RNF5 are degraded via a VCP- and ubiquitin-dependent proteasomal pathway. (A) Diagram of SCD1 protein structure, with detected diGly-modified lysine residue indicated. (B) Log2 SILAC peptide ratios for individual diGly-modified peptides from SCD1. (C) HepG2 cells expressing SCD1-S were treated with vehicle or 5 µM CB5083, subject to affinity purification with S-protein (S-prot) agarose, and SDS lysates analyzed by immunoblotting; n = 3. (D, E) HepG2 cells were treated with 75 µM emetine and 5 µM CB5083, 10 µM MG132, or 10 µM MLN7243 to disrupt various components of ERAD. SCD1 protein stability was assessed via immunoblotting (D) and relative levels quantified (E). Graphical data are expressed as mean ± SEM (n = 3–6 per group). (F) Diagram of RNF5 protein structure, with detected diGly-modified lysine residues indicated. (G) Log2 SILAC peptide ratios for individual diGly-modified peptides from RNF5. (H) HepG2 cells expressing S-RNF5 were treated with vehicle or 5 µM CB5083, subject to affinity purification with S-protein (agarose, and SDS lysates analyzed by immunoblotting) (n = 3). (I, J) HepG2 cells were treated with 75 µM emetine and 5 µM CB5083, 10 µM MG132, or 10 µM MLN7243 to disrupt various components of ERAD. RNF5 protein stability was assessed via immunoblotting (I) and relative levels quantified (J). Graphical data are expressed as mean ± SEM (n = 3–6 per group). TM: transmembrane domain. S-prot, S-protein; Exp., experiment; Em., emetine. Asterisk indicates that the diGly peptide was not detected in that experiment. See also Supplemental Table S1.
FIGURE 5:
FIGURE 5:
RNF5 autoubiquitination targets it for ERAD. (A) HepG2 cells transfected with S-RNF5(WT) and S-RNF5(C42A) were treated as indicated and lysates analyzed by immunoblotting. (B) Densitometric quantification of S-RNF5 (panel A). Data are expressed as mean ± SEM (n = 4 per group). (C) HepG2 cells transfected with S-RNF5(WT) and S-RNF5(C42A) were treated for 6 h with vehicle or 5 µM CB5083. S-tagged proteins were affinity purified, incubated in the presence and absence of USP2cc, and analyzed by immunoblotting. (D) Densitometric quantification of S-RNF5 (panel C). (E) HepG2 cells expressing S-RNF5(WT) or S-RNF5(C42A) were treated for 6 h with vehicle or 5 µM CB5083. S-tagged proteins were affinity purified, incubated in the presence or absence of USP2cc, and analyzed by immunoblotting. (F) HepG2 cells expressing S-RNF5(WT) or S-RNF5(4K-R) were treated for 6 h with vehicle or 5 µM CB5083. S-tagged proteins were affinity purified, incubated in the presence or absence of USP2cc, and analyzed by immunoblotting. (G) Densitometric quantification of S-RNF5 affinity purified from CB5083 treated HepG2 cells (panel F). Btz: bortezomib; Ubn, ubiquitinated; S-prot, S-protein. AU: arbitrary units. Asterisk indicates a USP2cc-reactive band.

References

    1. Anderson DJ, Le Moigne R, Djakovic S, Kumar B, Rice J, Wong S, Wang J, Yao B, Valle E, Kiss von Soly S, et al (2015). Targeting the AAA ATPase p97 as an approach to treat cancer through disruption of protein homeostasis. Cancer Cell , 653–665. - PMC - PubMed
    1. Bagola K, Mehnert M, Jarosch E, Sommer T. (2011). Protein dislocation from the ER. Biochim Biophys Acta , 925–936. - PubMed
    1. Bersuker K, Peterson CWH, To M, Sahl SJ, Savikhin V, Grossman EA, Nomura DK, Olzmann JA. (2018). A proximity labeling strategy provides insights into the composition and dynamics of lipid droplet proteomes. Dev Cell , 97–112.e7. - PMC - PubMed
    1. Blythe EE, Olson KC, Chau V, Deshaies RJ. (2017). Ubiquitin- and ATP-dependent unfoldase activity of P97/VCP•NPLOC4•UFD1L is enhanced by a mutation that causes multisystem proteinopathy. Proc Natl Acad Sci USA , E4380–E4388. - PMC - PubMed
    1. Bodnar NO, Rapoport TA. (2017). Molecular mechanism of substrate processing by the cdc48 atpase complex. Cell , 722–735. - PMC - PubMed

Publication types

MeSH terms