. 2018 Mar 8;3(5):e97011.
doi: 10.1172/jci.insight.97011.

Peripheral tissues reprogram CD8+ T cells for pathogenicity during graft-versus-host disease

Affiliations

Peripheral tissues reprogram CD8+ T cells for pathogenicity during graft-versus-host disease

Pedro Santos E Sousa et al. JCI Insight. .

Abstract

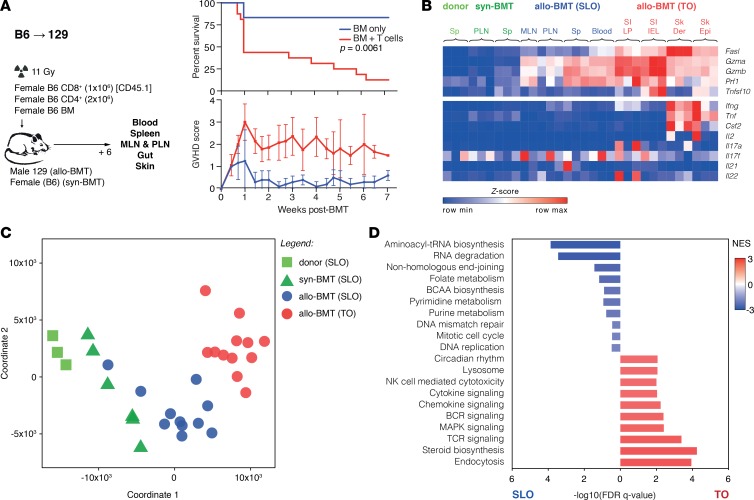
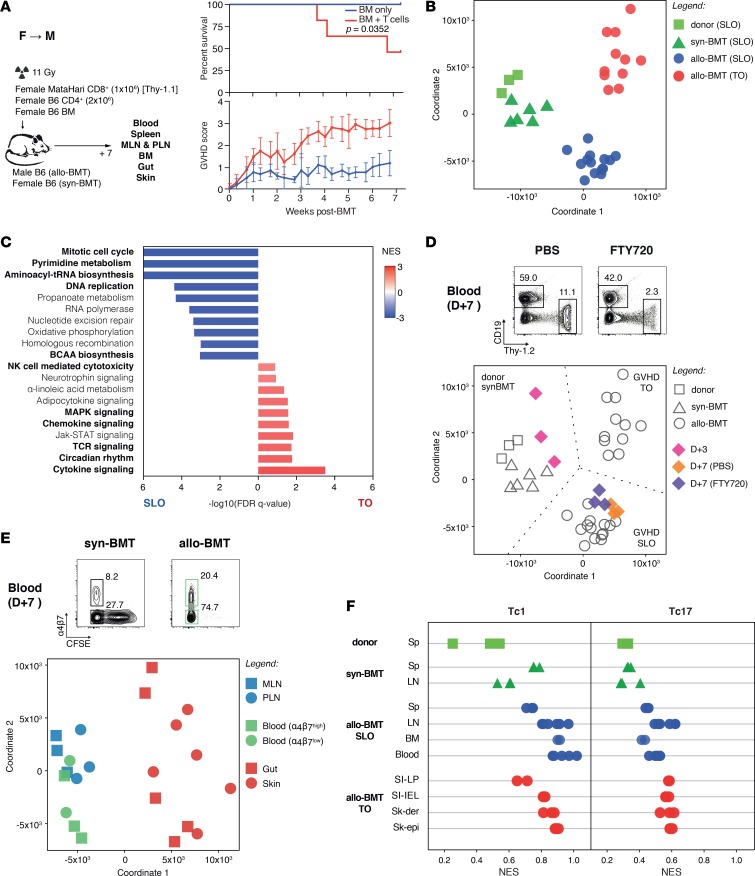
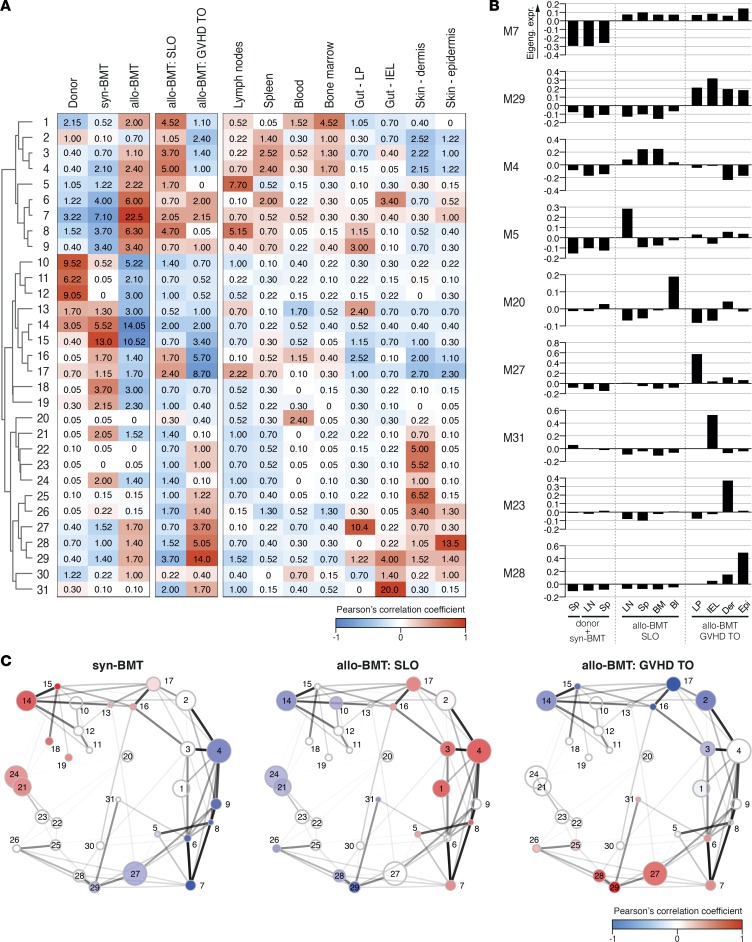
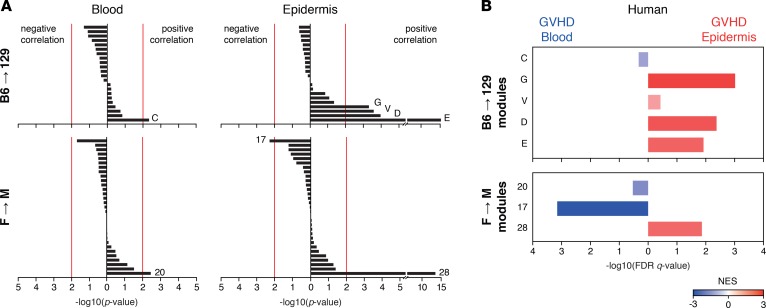
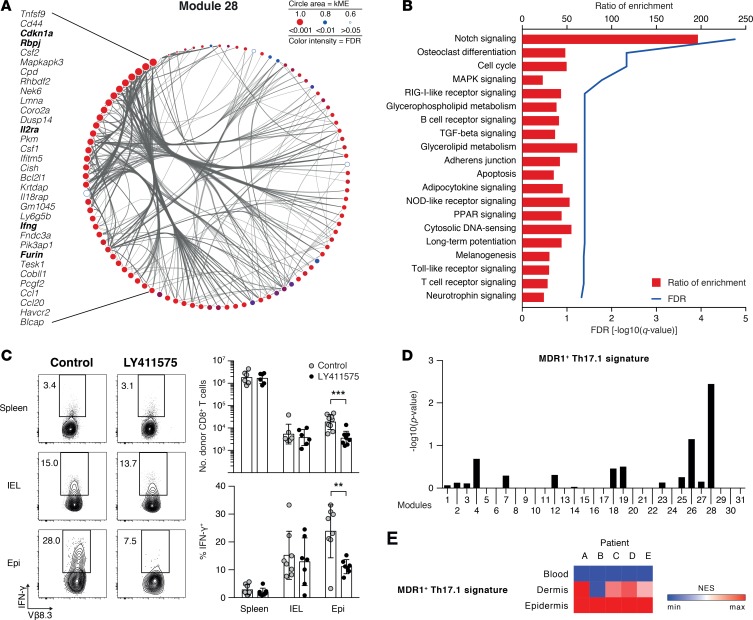
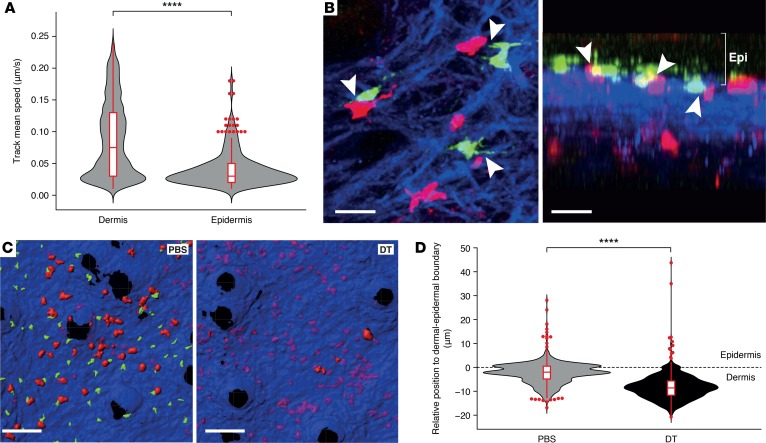
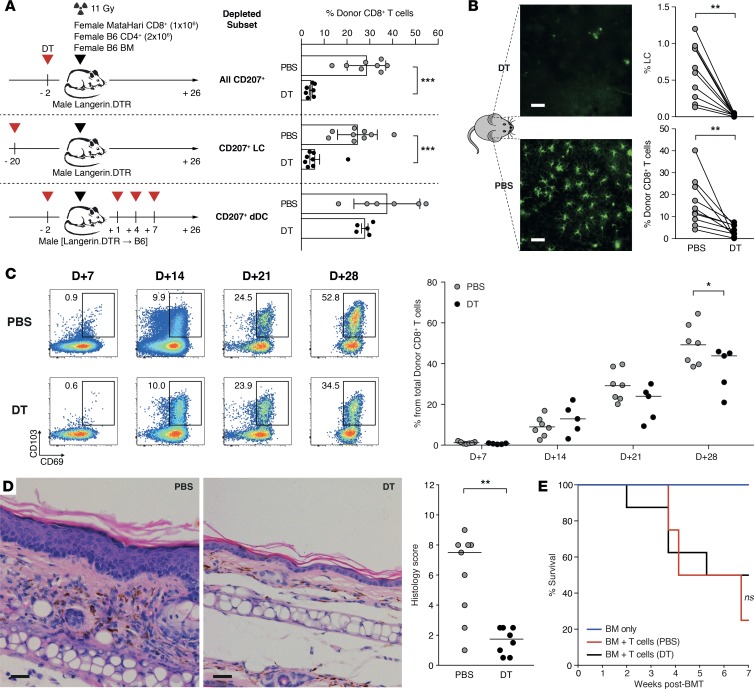
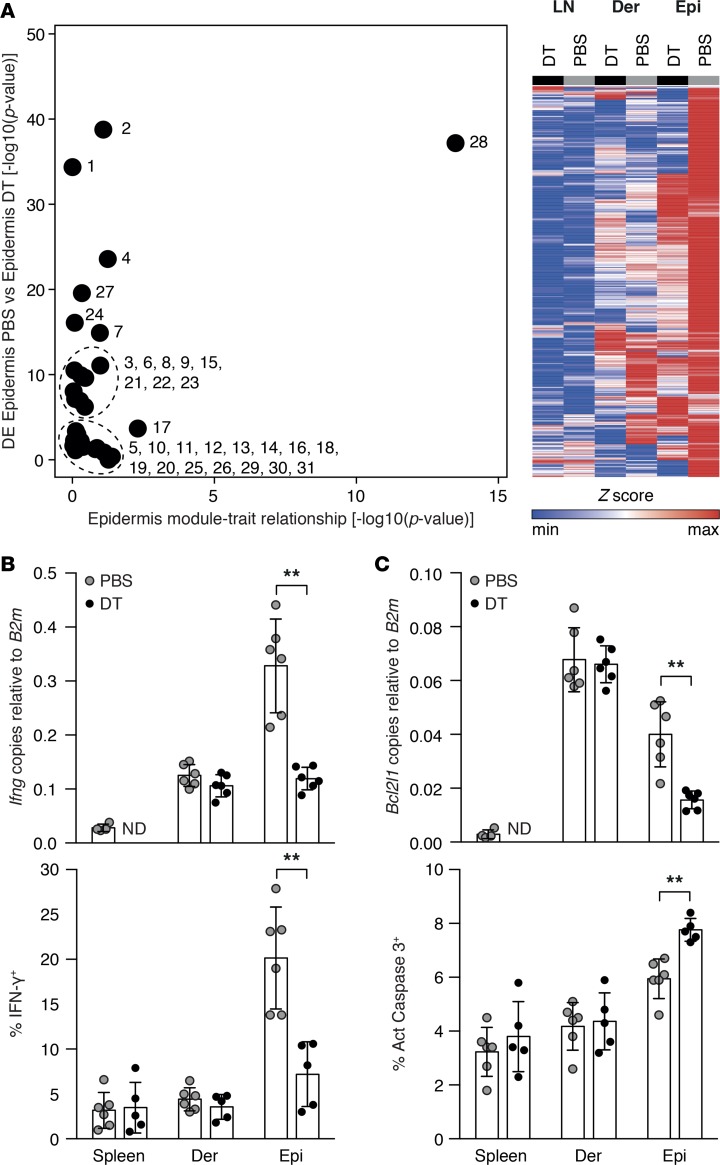
Graft-versus-host disease (GVHD) is a life-threatening complication of allogeneic stem cell transplantation induced by the influx of donor-derived effector T cells (TE) into peripheral tissues. Current treatment strategies rely on targeting systemic T cells; however, the precise location and nature of instructions that program TE to become pathogenic and trigger injury are unknown. We therefore used weighted gene coexpression network analysis to construct an unbiased spatial map of TE differentiation during the evolution of GVHD and identified wide variation in effector programs in mice and humans according to location. Idiosyncrasy of effector programming in affected organs did not result from variation in T cell receptor repertoire or the selection of optimally activated TE. Instead, TE were reprogrammed by tissue-autonomous mechanisms in target organs for site-specific proinflammatory functions that were highly divergent from those primed in lymph nodes. In the skin, we combined the correlation-based network with a module-based differential expression analysis and showed that Langerhans cells provided in situ instructions for a Notch-dependent T cell gene cluster critical for triggering local injury. Thus, the principal determinant of TE pathogenicity in GVHD is the final destination, highlighting the need for target organ-specific approaches to block immunopathology while avoiding global immune suppression.

Keywords: Immunology; Molecular pathology; Stem cell transplantation; T cell development; Transplantation.


Conflict of interest statement

Conflict of interest: The authors have declared that no conflict of interest exists.

Figures

Figure 1
Figure 1. TE gene expression profiles are functionally and spatially divergent.
(A) Left: Experimental setup of the B6→129 BMT model. Right, top graph: Kaplan-Meier survival curve (log-rank Mantel-Cox test). Right, bottom graph: clinical GVHD score over time (mean ± SD). BM only (n = 6), BM + T cells (n = 16). (B) Heatmap showing SLO- and GVHD target organ–derived TE expression of cytotoxic and cytokine genes known to be important in TE differentiation. (C) MDS plot showing the proximity of the transcriptional profiles of donor-derived CD8+ T cells isolated from different organs. (D) Graph showing the FDR q value (bars) and NES (color code) calculated by GSEA, comparing the top 10 enriched KEGG pathways in allo-BMT SLO (blue) and GVHD TO (red) groups. BCAA, branched-chain amino acid; BM, bone marrow; BMT, BM transplantation; Der, dermis; Epi, epidermis; FDR, false discovery rate; GSEA, gene set enrichment analysis; GVHD, graft-versus-host disease; IEL, intraepithelial lymphocyte; LP, lamina propria; MDS, multidimensional scaling; MLN, mesenteric lymph node; NES, normalized enrichment score; PLN, peripheral lymph node; SI, small intestine; SLO, secondary lymphoid organ; Sk, skin; TE, effector T cell; TO, target organ.
Figure 2
Figure 2. TE effector program diversity in SLO and peripheral tissues is tissue autonomous and TCR repertoire independent.
(A) Left: Experimental setup of the F→M BMT model. Right, top graph: Kaplan-Meier survival curve (log-rank Mantel-Cox test). Right, bottom graph: clinical GVHD score over time (mean ± SD). BM only (n = 6), BM + T cells (n = 11). (B) MDS plot showing the proximity of transcriptional profiles of donor-derived CD8+ T cells isolated from different organs. (C) Graph showing the FDR q value (bars) and NES (color code) calculated by GSEA, comparing the top 10 enriched KEGG pathways in allo-BMT SLO (blue) and GVHD TO (red) groups. Pathways in common with the B6→129 BMT model are highlighted in bold. (D) F→M BMT + T cell recipients were treated with daily intraperitoneal FTY720 or PBS from day 3 onwards (n = 3, each group). Top: Representative plots of whole-blood staining for Thy-1.2 and CD19 at day 7 after transplant in FTY720- and PBS-treated BMT recipients. Bottom: MDS plot showing the proximity of transcriptional profiles of naive input T cells and donor-derived CD8+ T cells from the LNs at day 3, and at day 7 with or without FTY720-mediated prevention of TE egress to the periphery. (E) Top: sorting strategy of peripheral blood T cells (right panel; green gates). Bottom: MDS plot showing similarity of the transcriptional profiles of donor-derived CD8+ T cells isolated from the GVHD target organs (gut and skin) and from their respective draining LNs, and GVHD target organ–tropic peripheral blood subsets. (F) Representation of Tc1 and Tc17 gene signature expression in each sample, evaluated by single-sample GSEA. BCAA, branched-chain amino acid; BM, bone marrow; BMT, BM transplantation; Der, dermis; D+, number of days after BMT; Epi, epidermis; FDR, false discovery rate; GSEA, gene set enrichment analysis; GVHD, graft-versus-host disease; IEL, intraepithelial lymphocyte; LN, lymph node; LP, lamina propria; MDS, multidimensional scaling; MLN, mesenteric LN; NES, normalized enrichment score; PLN, peripheral LN; SI, small intestine; SLO, secondary lymphoid organ; Sk, skin; TE, effector T cell; TO, target organ.
Figure 3
Figure 3. Donor TE transcription conforms to a spatially diverse modular architecture.
(A) Correlation matrix depicting the association between individual gene modules defined by weighted gene coexpression network analysis–defined modules and the experimental groups (donor, syn-BMT, allo-BMT), GVHD subgroups (SLO, TO), and GVHD individual organs. Cell color and cell number indicate Pearson’s correlation coefficient and corresponding –log10(P value), respectively. (B) Bar graphs showing the mean eigengene expression in each of the tissues, for pan-allo-BMT (M7), pan-GVHD TO (M29), SLO-selective (M4), and tissue-specific modules (M5, M20, M23, M27, M28, M31). (C) Eigengene network constructed with Cytoscape, in which the nodes (circles) represent the gene modules (circle area proportional to the number of genes in the module) and the edges (lines) represent the correlation between each pair of modules (line thickness proportional to Pearson’s correlation coefficient; line transparency proportional to P value). The nodes are spatially arranged according to the adjacency between gene modules and the color of the nodes reflects the correlation between the modules and the group of tissues represented. Bl, blood; BM, bone marrow; BMT, BM transplantation; Der, dermis; Epi, epidermis; GVHD, graft-versus-host disease; IEL, intraepithelial lymphocyte; LN, lymph node; LP, lamina propria; SLO, secondary lymphoid organ; Sp, spleen; TO, target organ.
Figure 4
Figure 4. Blood- and skin-correlated T cell modules are also identifiable in human patients.
(A) Bar graph showing the B6→129 and F→M WGCNA-defined modules ordered according to their correlation with the blood or the epidermis. Red line indicates P = 0.01. (B) Graph showing the FDR q value (bars) and NES (color code) calculated by GSEA, comparing the enrichment for the blood- and skin-correlated B6→129 and F→M WGCNA-defined modules in the blood (blue) and epidermis (red) samples of human patients at the onset of acute skin GVHD. FDR, false discovery rate; GSEA, gene set enrichment analysis; GVHD, graft-versus-host disease; NES, normalized enrichment score; SLO, secondary lymphoid organs; TO, target organs; WGCNA, weighted gene coexpression network analysis.
Figure 5
Figure 5. Notch signaling is a locale-specific regulator of TE functions within the epidermis.
(A) Cytoscape-generated visualization of the network connections among the 100 most connected genes in M28. Nodes represent the genes (circle area proportional to the intramodular connectivity, kME) and the color reflects the FDR q value of its correlation with the module; edges represent the topological overlap between genes (line thickness proportional to adjacency). Notch pathway–related genes and Notch downstream targets are highlighted. (B) Graph showing the ratio of enrichment (bars) and FDR q values (line) for pathways predicted by WebGestalt to regulate M28. (C) Effect of in vivo Notch signaling blockade upon alloreactive TE tissue infiltration and effector function. F→M BMT recipients were treated on days 5 and 6 with LY411575 or vehicle i.p. On day 7, IFN-γ synthesis by MataHari T cells in the spleen, IEL, and epidermis (left: representative flow cytometric plots; bottom right: summary data) and corresponding numbers of MataHari T cells isolated from each site (top right: summary data) were determined. Data derived from 3 independent experiments: LY411575 n = 7, vehicle n = 8 (all graphs showing mean ± SD). **P ≤ 0.01, ***P ≤ 0.001 by ANOVA with Holm-Sidak correction for multiple comparisons. (D) Graph showing module association with resistance to immunosuppressive therapies assessed by determining the overrepresentation of gene signature specific for a human MDR1+ Th1/Th17 subset that is resistant to glucocorticoids. Hypergeometric test. (E) Heatmap showing the relative enrichment for the MDR1+ Th1/Th17 gene signature in blood, dermis, and epidermis samples from GVHD patients as determined by single-sample GSEA. BMT, bone marrow transplantation; Epi, epidermis; FDR, false discovery rate; GSEA, gene set enrichment analysis; GVHD, graft-versus-host disease; IEL, intraepithelial lymphocyte; kME, intramodular connectivity; NES, normalized enrichment score; SLO, secondary lymphoid organ; TE, effector T cell; TO, target organ.
Figure 6
Figure 6. LCs are required for TE migration into the epidermis.
(A) Track mean speed of MataHari CD8+ T cells in dermis and epidermis of male BMT recipients on day 8. Data derived from 3 mice in 3 independent experiments. ****P ≤ 0.0001 by 2-tailed Mann-Whitney test. (B) Representative images of donor T cell skin infiltration pattern in early acute GVHD, showing signal overlap for donor-derived MataHari CD8+ T cells (red), host-derived LCs (green), and second harmonic signal (blue) (left: maximum Z-stack projection; right: y-z orthogonal view). Scale bars: 20 μm. Donor CD8+ T cells accumulated in the epidermis (Epi) where they established close contacts (arrow heads) with host LCs. (C) Representative images and (D) summary data showing position of MataHari T cells (red) in relation to the epidermis-dermis boundary (blue) in the presence or absence of LCs. Data derived from 4 mice in 2 independent experiments. ****P ≤ 0.0001 by 2-tailed Mann-Whitney test. BMT, bone marrow transplantation; DT, diphtheria toxin; Epi, epidermis; GVHD, graft-versus-host disease; LC, Langerhans cell; TE, effector T cell.
Figure 7
Figure 7. TE pathogenicity in skin is triggered by migration to the epidermis and interaction with LCs in situ.
(A) Graphs showing mean ± SD epidermal accumulation of MataHari T cells following F→M BMT according to the presence or absence of CD207+ cells in the host (n = 5–9/group). Timing of DT or PBS treatment determined depletion or otherwise of different subsets of host CD207+ populations from the skin (all CD207+ n = 7–8/group, LC only n = 8–9/group, or CD207+ dDC only n = 5–6/group) in male Langerin.DTR or established (male Langerin.DTR→B6 male) bone marrow chimeras used as BMT recipients. ***P ≤ 0.001 by 2-tailed Mann-Whitney U test. (B) Left: Representative images of immunofluorescence staining of epidermal sheets showing unilateral LC (green) depletion achieved through intradermal injection of DT (left ear, top image) or PBS (right ear, bottom image). Scale bars: 50 μm. Right: Graphs show summary data for mean ± SD of LC numbers (top) and epidermal TE numbers (bottom) in each ear at day 7 (n = 10). **P ≤ 0.01 by 2-tailed Wilcoxon’s matched-pairs signed-rank test. (C) Evolution of the TRM phenotype of epidermis-located MataHari T cells in the presence (PBS) or absence (DT) of LCs (left: representative FACS plots of CD69 and CD103 expression over time; right: summary data). *P ≤ 0.05 by 2-tailed Wilcoxon’s rank-sum test. (D) Left: Representative images of H&E staining of skin samples from male Langerin.DTR allo-BMT recipients treated with PBS or DT. Right: Summary data of the histopathologic severity score (lines represent median). **P ≤ 0.01 by Mann-Whitney U test. (E) Survival of F→M BMT recipients according to the presence or absence of LCs (BMT + T cells ± DT, n = 8/group) or BMT no–T cell controls (n = 3). Log-rank Mantel-Cox test. BM, bone marrow; BMT, BM transplantation; dDC, dermal dendritic cell; DT, diphtheria toxin; D+, number of days after BMT; Epi, epidermis; H&E, hematoxylin and eosin; LC, Langerhans cell; TE, effector T cell; TRM, resident memory T cell.
Figure 8
Figure 8. LCs are required to induce the pathogenic gene cluster M28.
(A) Left: Graph of weighted gene coexpression network analysis-defined modules showing P values for correlation to epidermis (x axis) and differential expression according to presence or absence of LCs (y axis). Right: Heatmap showing the relative expression of M28 genes in the LNs, dermis, and epidermis in the presence (PBS) and absence of LCs (DT). (B) Assessment of effector function (left: Ifng gene and IFN-γ protein expression) and (C) survival/apoptosis (right: Bcl2l1 expression and caspase 3 activity) of skin-infiltrating donor CD8+ T cells in the presence (PBS) and absence of LCs (DT), (n = 5–6/group, all graphs showing mean ± SD). **P ≤ 0.01 by Mann-Whitney U test. DE, differential expression; Der, Dermis; DT, diphtheria toxin; Epi, epidermis; LC, Langerhans cell; LN, lymph node; ND, not detected.

References

    1. Choi SW, Reddy P. Current and emerging strategies for the prevention of graft-versus-host disease. Nat Rev Clin Oncol. 2014;11(9):536–547. doi: 10.1038/nrclinonc.2014.102. - DOI - PMC - PubMed
    1. Markey KA, MacDonald KP, Hill GR. The biology of graft-versus-host disease: experimental systems instructing clinical practice. Blood. 2014;124(3):354–362. doi: 10.1182/blood-2014-02-514745. - DOI - PMC - PubMed
    1. Zeiser R, Blazar BR. Preclinical models of acute and chronic graft-versus-host disease: how predictive are they for a successful clinical translation? Blood. 2016;127(25):3117–3126. doi: 10.1182/blood-2016-02-699082. - DOI - PMC - PubMed
    1. Xhaard A, et al. Steroid-refractory acute GVHD: lack of long-term improved survival using new generation anticytokine treatment. Biol Blood Marrow Transplant. 2012;18(3):406–413. doi: 10.1016/j.bbmt.2011.06.012. - DOI - PubMed
    1. Hartwell MJ, et al. An early-biomarker algorithm predicts lethal graft-versus-host disease and survival. JCI Insight. 2017;2(3):e89798. - PMC - PubMed

Publication types

MeSH terms