. 2018 Mar 7;8(1):4108.
doi: 10.1038/s41598-018-22339-0.

Celecoxib alleviates nonalcoholic fatty liver disease by restoring autophagic flux

Affiliations

Celecoxib alleviates nonalcoholic fatty liver disease by restoring autophagic flux

Cong Liu et al. Sci Rep. .

Abstract

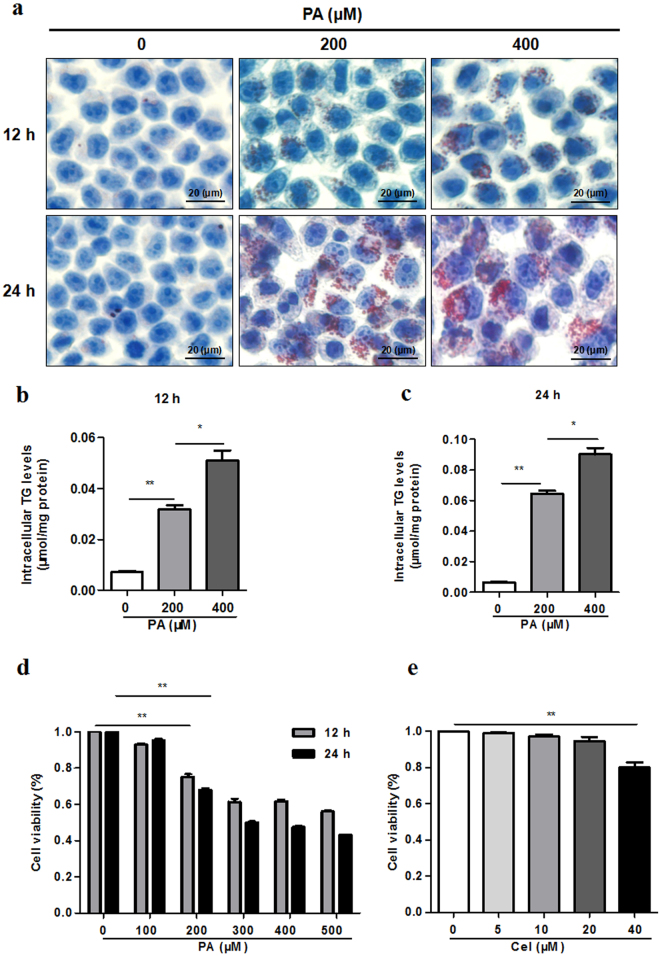
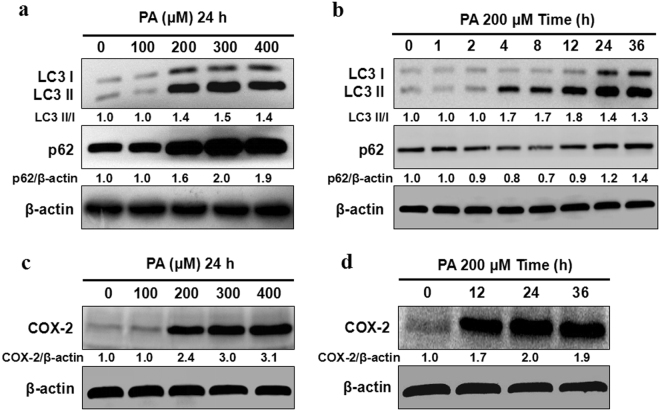
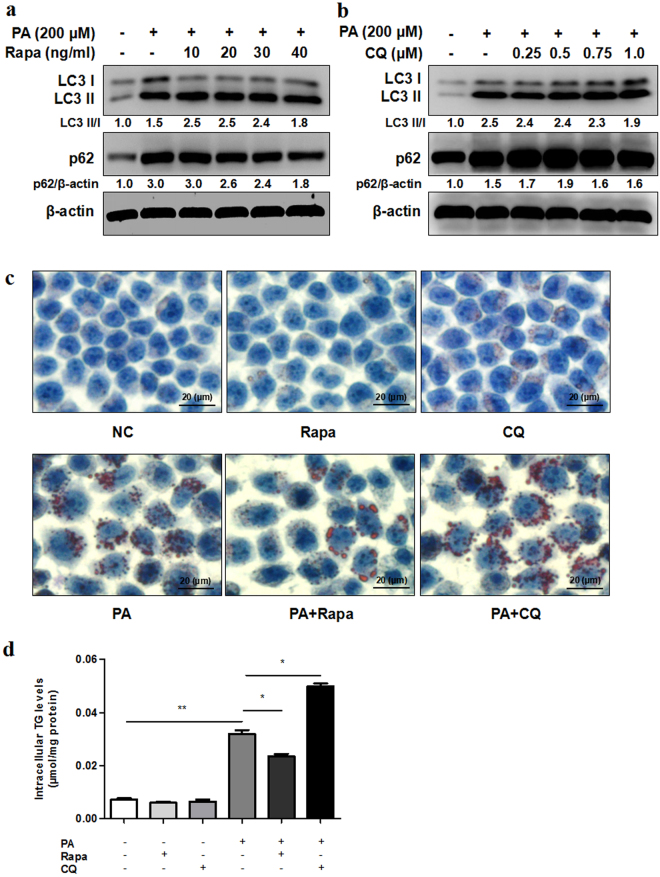
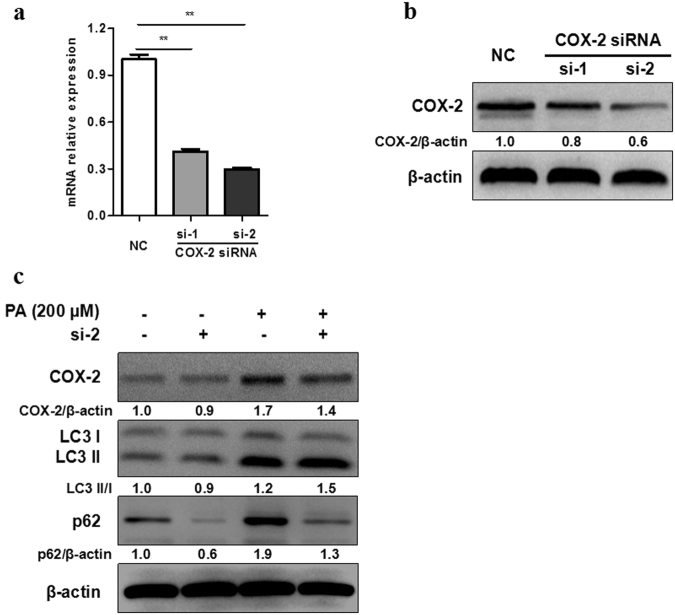
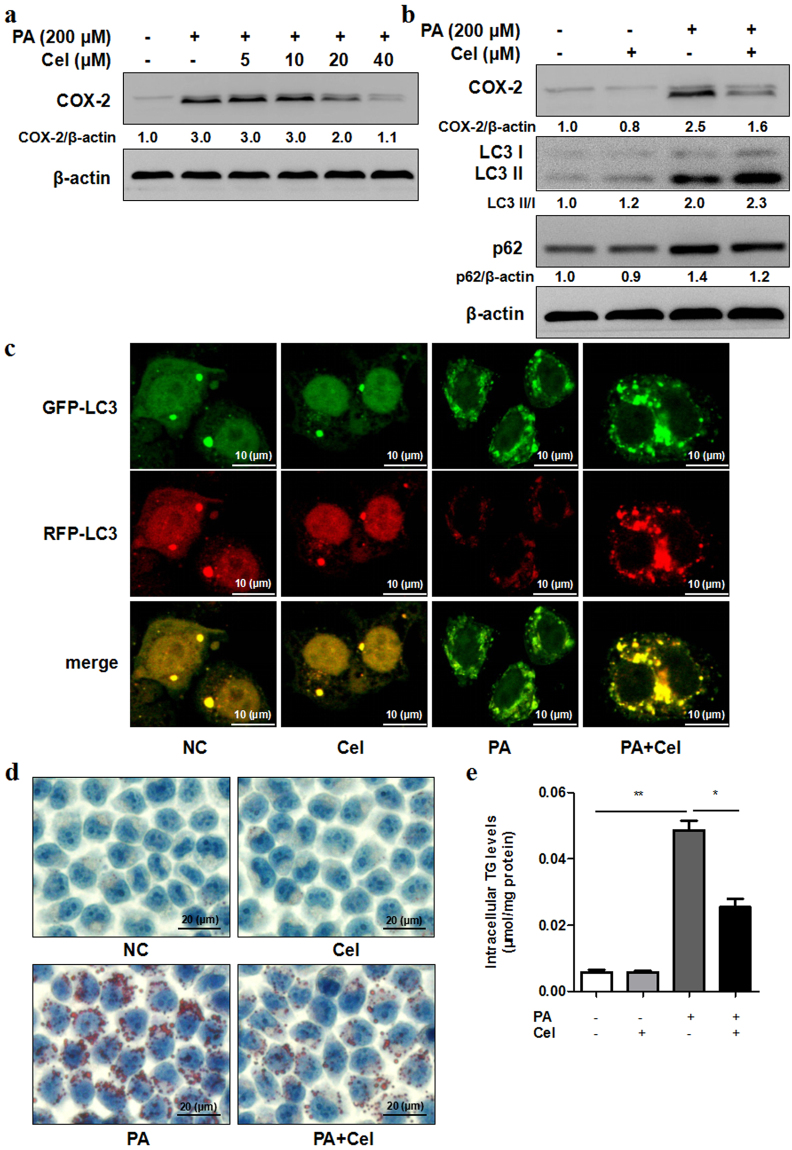
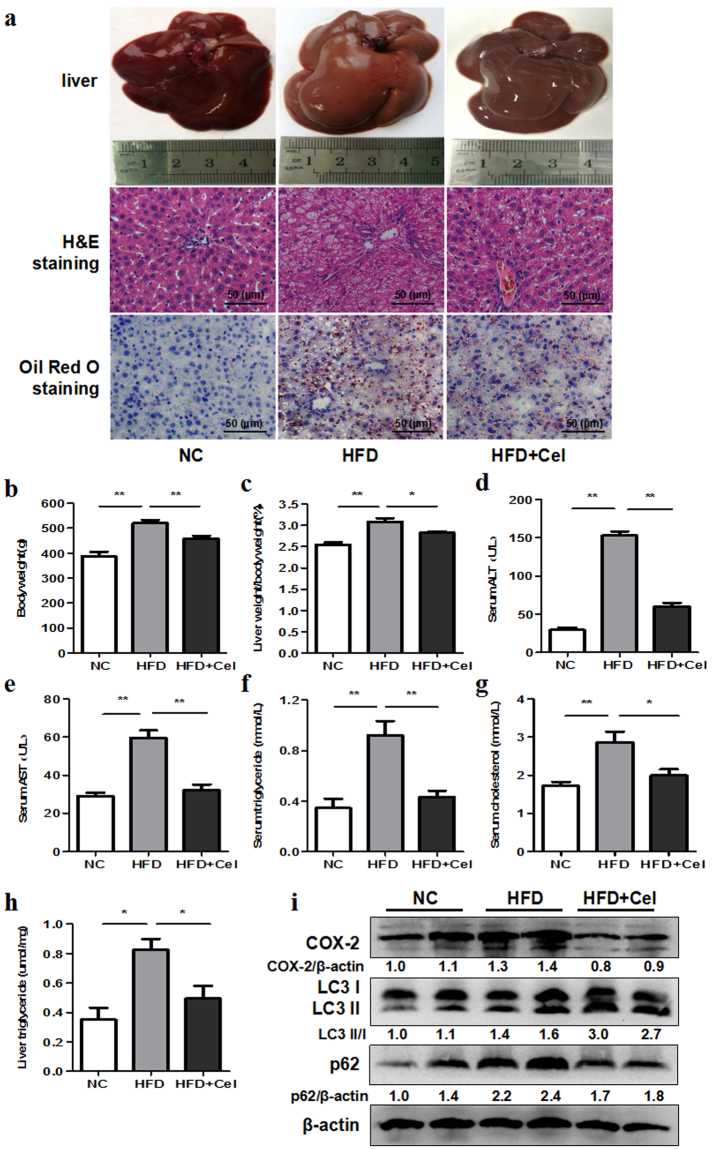
Nonalcoholic fatty liver disease (NAFLD) is a kind of liver lipid synthesis and degradation imbalance related with metabolic syndrome. Celecoxib shows the function of ameliorating NAFLD, but the underlying mechanisms remain unknown. Here, we discuss the possible mechanisms of celecoxib alleviating NAFLD by restoring autophagic flux. Lipids were accumulated in L02 cells treated with palmitate as well as SD rats fed with high-fat diet. Western blot showed that LC3 II/I was higher and p62 was lower on the early stage of steatosis while on the late stage both of them were higher, indicating that autophagic flux was activated on the early stage of steatosis, but blocked on the late stage. Rapamycin alleviated steatosis with activating autophagic flux while chloroquine aggravated steatosis with inhibiting autophagic flux. COX-2 siRNA and celecoxib were used to inhibit COX-2. Western blot and RFP-GFP-LC3 double fluorescence system indicated that celecoxib could ameliorate steatosis and restore autophagic flux in L02 cells treated with palmitate as well as SD rats fed with high-fat diet. In conclusion, celecoxib partially restores autophagic flux via downregulation of COX-2 and alleviates steatosis in vitro and in vivo.


Conflict of interest statement

The authors declare no competing interests.

Figures

Figure 1
Figure 1
PA induces lipid accumulation in hepatocytes. (a–c) L02 hepatic cells exposed to different concentrations (200 μM, 400 μM) of PA for different time (12 h, 24 h). Lipid droplets accumulation and TG levels were determined by Oil Red O staining (400X) and TG assay respectively (*P < 0.05, **P < 0.01). (d) L02 cells exposed to different concentrations (100–500 μM) of PA for different time (12 h, 24 h). CCK-8 assay was used to detect cell viability (*P < 0.05, **P < 0.01). (e) L02 cells were treated with celecoxib at different concentrations (5–40 μM) for 24 h. CCK-8 assay was used to detect cell viability (*P < 0.05, **P < 0.01).
Figure 2
Figure 2
Effects of PA on autophagic flux and COX-2. (a) L02 cells exposed to different concentrations (100–400 μM) of PA for 24 h. PA induced upregulation of LC3 II/I and p62 protein levels as indicated by western blot. (b) L02 cells were treated with PA (200 μM) for different time (0–36 h). PA induced upregulation of LC3 II/I and downregulation of p62 protein levels at 4 h, 8 h while upregulation of LC3 II/I and p62 protein levels at 24 h, 36 h indicating that autophagic flux was activated on the early stage but blocked at the late hour. (c,d) L02 cells were treated with PA of different concentrations (100–400 μM) for different time (12–36 h). PA induced upregulation of COX-2 protein levels. The value under the band is the ratio of the blot and normalized to control.
Figure 3
Figure 3
Autophagy plays an important role in steatosis. (a,b) L02 cells exposed to PA (200 μM) with different concentrations of rapamycin (Rapa) or chloroquine (CQ) for 24 h. PA induced higher protein expression of LC3 II/I and p62 compared with control as indicated by western blot. Rapamycin combined with PA treatment induced higher LC3 II/I protein levels and lower p62 protein levels compared with PA treatment. Chloroquine combined with PA treatment induced higher p62 protein levels compared with PA treatment. The value under the band is the ratio of the blot and normalized to control. (c,d) L02 cells exposed to PA (200 μM) with rapamycin (20 ng/ml) or chloroquine (0.5 μM) for 24 h. Intracellular lipid droplets accumulation and TG levels were determined by Oil Red O staining (400X) or TG assay respectively (*P < 0.05, **P < 0.01). L02 steatosis was decreased with rapamycin treatment while increased with chloroquine treatment.
Figure 4
Figure 4
Downregulation of COX-2 induces autophagic flux in vitro. (a,b) COX-2 was knocked down with COX-2 siRNA transfection (si-1 or si-2) in L02 cells, then RT-PCR and western blot were performed for confirmation. (c) After treated with PA (200 μM) for 24 h, western blot of COX-2 siRNA transfected cells showed higher protein expression of LC3 II/I and lower protein expression of p62 than negative control (NC). The value under the band is the ratio of the blot and normalized to control.
Figure 5
Figure 5
Celecoxib alleviates steatosis by restoring autophagic flux in vitro. (a) L02 cells exposed to PA (200 μM) with different concentrations of celecoxib (Cel, 5–40 μM) for 24 h. Celecoxib decreased protein expression of COX-2 compared with control as indicated by western blot. (b) L02 cells were treated with PA (200 μM) and celecoxib (20 μM) for 24 h. Celecoxib combined with PA treatment induced higher protein expression of LC3 II/I and lower protein expression of p62 compared to PA treatment. The value under the band is the ratio of the blot and normalized to control. (c) RFP-GFP-LC3 double fluorescence lentivirus tranfected L02 cells were treated with PA (200 μM) and celecoxib (20 μM) for 24 h. Representative confocal images of GFP-LC3 puncta (green, autophagosomes) and RFP-LC3 puncta (red, autolysosomes), as well as overlay images were shown (1000X). (d,e) L02 cells exposed to PA (200 μM) with celecoxib (20 μM) for 24 h. Intracellular lipid droplets accumulation and TG levels were determined by Oil Red O staining (400X) or TG assay respectively (*P < 0.05, **P < 0.01).
Figure 6
Figure 6
Celecoxib ameliorates NAFLD by restoring autophagic flux in vivo. SD rats were fed with normal chow diet (NC, n = 10) or high fat diet (HFD, n = 20) for 8 weeks. At the end of week 4, HFD groups were then randomly intragastricly administrated with celecoxib (HFD + Cel, 20 mg/kg/day, n = 10) or normal saline (n = 10) for another 4 weeks, while the NC groups were intragastricly administrated with normal saline. (a) Liver histology was determined by H&E and Oil Red O staining (200X). (bh) Body weight, liver weight/body weight, serum levels of ALT, AST, TG, TC, and intrahepatic TG level in HFD + Cel groups were lower than HFD groups (*P < 0.05, **P < 0.01). (i) HFD induced upregulation of LC3 II/I, p62 and COX-2 levels compared with negative control as indicated by western blot. HFD + Cel groups liver showed higher protein expression of LC3 II/I and lower protein expression of p62 and COX-2 compared with HFD groups. The value under the band is the ratio of the blot and normalized to control.

References

    1. Loomba R, Sanyal AJ. The global NAFLD epidemic. Nat. Rev. Gastroenterol. Hepatol. 2013;10:686–690. doi: 10.1038/nrgastro.2013.171. - DOI - PubMed
    1. Amarapurkar DN, et al. How common is non-alcoholic fatty liver disease in the Asia-Pacific region and are there local differences? J. Gastroenterol. Hepatol. 2007;22:788–793. doi: 10.1111/j.1440-1746.2007.05042.x. - DOI - PubMed
    1. Cohen JC, Horton JD, Hobbs HH. Human fatty liver disease: old questions and new insights. Science. 2011;332:1519–1523. doi: 10.1126/science.1204265. - DOI - PMC - PubMed
    1. Liu W, Baker RD, Bhatia T, Zhu L, Baker SS. Pathogenesis of nonalcoholic steatohepatitis. Cell Mol. Life Sci. 2016;73:1969–1987. doi: 10.1007/s00018-016-2161-x. - DOI - PMC - PubMed
    1. Chen J, et al. Celecoxib attenuates liver steatosis and inflammation in non-alcoholic steatohepatitis induced by high-fat diet in rats. Mol. Med. Rep. 2011;4:811–816. doi: 10.3892/mmr.2011.426. - DOI - PubMed

Publication types