Randomized Controlled Trial
. 2018 Mar 7;8(1):4139.
doi: 10.1038/s41598-018-22408-4.

Inter-niche and inter-individual variation in gut microbial community assessment using stool, rectal swab, and mucosal samples

Affiliations
Randomized Controlled Trial

Inter-niche and inter-individual variation in gut microbial community assessment using stool, rectal swab, and mucosal samples

Roshonda B Jones et al. Sci Rep. .

Abstract

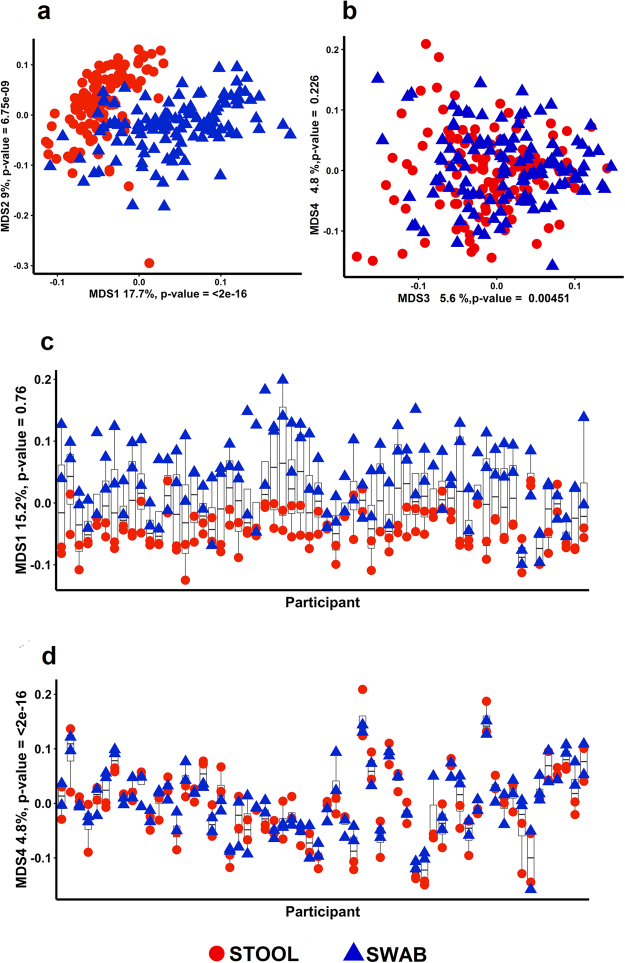
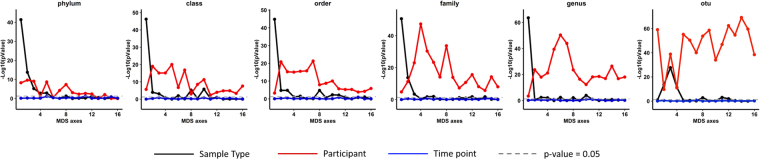
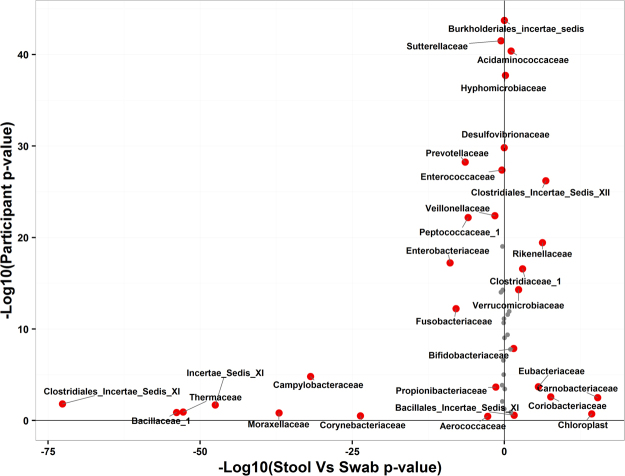
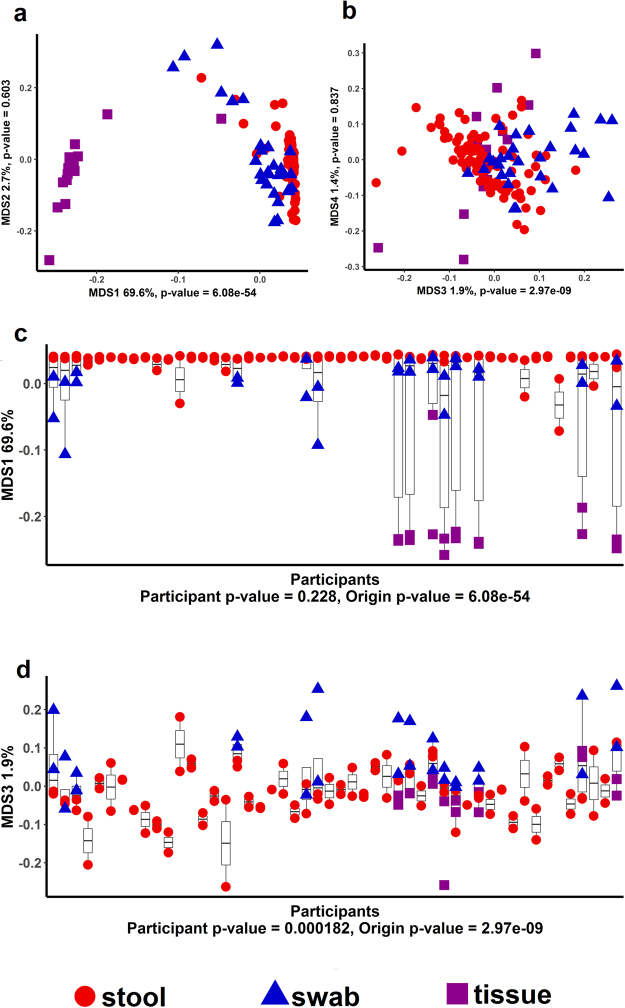
The purpose of this study is to evaluate similarities and differences in gut bacterial measurements and stability in the microbial communities of three different types of samples that could be used to assess different niches of the gut microbiome: rectal swab, stool, and normal rectal mucosa samples. In swab-stool comparisons, there were substantial taxa differences with some taxa varying largely by sample type (e.g. Thermaceae), inter-individual subject variation (e.g. Desulfovibrionaceae), or by both sample type and participant (e.g. Enterobacteriaceae). Comparing all three sample types with whole-genome metagenome shotgun sequencing, swab samples were much closer to stool samples than mucosa samples although all KEGG functional Level 1 and Level 2 pathways were significantly different across all sample types (e.g. transcription and environmental adaptation). However, the individual signature of participants was also observed and was largely stable between two time points. Thus, we found that while the distribution of some taxa was associated with these different sampling techniques, other taxa largely reflected individual differences in the microbial community that were insensitive to sampling technique. There is substantial variability in the assessment of the gut microbial community according to the type of sample.


Conflict of interest statement

The authors declare no competing interests.

Figures

Figure 1
Figure 1
Multidimensional scaling (MDS) of closed-reference OTUs classified at the family level using 16S rRNA gene sequence reads. There are four samples (two each of stool and swab) from each of the 60 participants in our study colored by sample origin (red is stool and blue is swab). Repeated samples collected from individuals were collected with an average separation of 3 months. The distinct separation of colors shows that there is separation by sample type in MDS axis 1 and MDS axis 2 (a,c) but not in MDS axes 3 and 4 (b). However, MDS axis 4 shows strong clustering by participant (d).
Figure 2
Figure 2
The first 15 MDS axes were regressed against sample type (swab or stool), participant ID and time point. The −log10 (p-value) for the null hypothesis that sample type, participant ID and time point have no impact on the MDS axes are all shown. While there are significant differences in the first MDS axis in stool vs swab samples, the MDS axes thereafter are significantly different between the participants. Taxonomic calls were based on QIIME closed-referenced OTU picking against GreenGenes database.
Figure 3
Figure 3
For each taxa at the family level present in at least 25% of samples, p-values for a null hypothesis of no difference by stool vs. swab vs. by participant. Red symbols are taxa that have a p-value that is significant at a 10% false discovery rate. Taxa higher in swab than stool have a negative x coordinate and taxa higher in stool than swab have a positive x-coordinate. Data was generated using closed-reference OTUs classified at the family level using 16S rRNA gene sequence reads.
Figure 4
Figure 4
Plot of first two coordinates (a) and MDS3 vs MDS 4 (b) of an MDS ordination of the KEGG gene family abundance table for WGS sequence reads from swab samples (blue triangles), stool samples (red circles) and tissue samples (purple squares). The distinct separation of colors shows that there is separation by sample type in the first and third MDS axes. MDS axes plotted by participant ID show strong separation by sample type for MDS 1 (c) and by participant and sample type for MDS 3 (d).

References

    1. Manichanh C, et al. Reduced diversity of faecal microbiota in Crohn’s disease revealed by a metagenomic approach. Gut. 2006;55:205–211. doi: 10.1136/gut.2005.073817. - DOI - PMC - PubMed
    1. Willing BP, et al. A pyrosequencing study in twins shows that gastrointestinal microbial profiles vary with inflammatory bowel disease phenotypes. Gastroenterology. 2010;139:1844–1854.e1. doi: 10.1053/j.gastro.2010.08.049. - DOI - PubMed
    1. Boleij A, Tjalsma H. Gut bacteria in health and disease: a survey on the interface between intestinal microbiology and colorectal cancer. Biol Rev Camb Philos Soc. 2012;87:701–730. doi: 10.1111/j.1469-185X.2012.00218.x. - DOI - PubMed
    1. Karlsson FH, et al. Symptomatic atherosclerosis is associated with an altered gut metagenome. Nat Commun. 2012;3:1245. doi: 10.1038/ncomms2266. - DOI - PMC - PubMed
    1. Paun A, Danska JS. Modulation of type 1 and type 2 diabetes risk by the intestinal microbiome. Pediatr Diabetes. 2016;17:469–477. doi: 10.1111/pedi.12424. - DOI - PubMed

Publication types

LinkOut - more resources