. 2018 Mar 7;8(1):4136.
doi: 10.1038/s41598-018-22580-7.

Brettanomyces bruxellensis population survey reveals a diploid-triploid complex structured according to substrate of isolation and geographical distribution

Affiliations

Brettanomyces bruxellensis population survey reveals a diploid-triploid complex structured according to substrate of isolation and geographical distribution

Marta Avramova et al. Sci Rep. .

Abstract

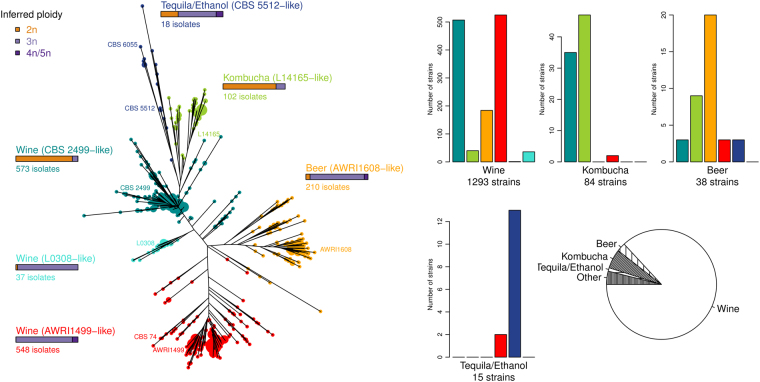
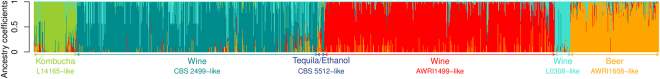
Brettanomyces bruxellensis is a unicellular fungus of increasing industrial and scientific interest over the past 15 years. Previous studies revealed high genotypic diversity amongst B. bruxellensis strains as well as strain-dependent phenotypic characteristics. Genomic assemblies revealed that some strains harbour triploid genomes and based upon prior genotyping it was inferred that a triploid population was widely dispersed across Australian wine regions. We performed an intraspecific diversity genotypic survey of 1488 B. bruxellensis isolates from 29 countries, 5 continents and 9 different fermentation niches. Using microsatellite analysis in combination with different statistical approaches, we demonstrate that the studied population is structured according to ploidy level, substrate of isolation and geographical origin of the strains, underlying the relative importance of each factor. We found that geographical origin has a different contribution to the population structure according to the substrate of origin, suggesting an anthropic influence on the spatial biodiversity of this microorganism of industrial interest. The observed clustering was correlated to variable stress response, as strains from different groups displayed variation in tolerance to the wine preservative sulfur dioxide (SO2). The potential contribution of the triploid state for adaptation to industrial fermentations and dissemination of the species B. bruxellensis is discussed.


Conflict of interest statement

The authors declare no competing interests.

Figures

Figure 1
Figure 1
B. bruxellensis population clusters identification by combining different tools and parameters. (A) Dendrogram using Bruvo’s distance and NJ clustering. The figure was produced using the poppr package in R. (B) Dendrogram using Bruvo’s distance and UPGMA clustering. The figure was produced using poppr. Isolates are shown in the same colours as in A. (C) Multidimensional scaling performed with Bruvo’s distance matrix on the same dataset and using the cmdscale function on R. For isolates with incomplete genotyping, the missing data was inferred from the closest neighbour using Bruvo’s distance. Isolates are shown with the same colours as in A. (D) Node reliability using the partition method. Only the nodes with reliability >90% are shown on the NJ tree. (E) Cluster identification using successive K-means. The find.cluster function from the adegenet package in R was applied, using within-groups sum of squares (WSS) statistics and the default criterion diffNgroup. This tool identifies an optimal number of 3 clusters, represented on the NJ tree using different arbitrary colours. (F) Inferred ploidy. The maximum number of alleles per locus was computed. Isolates with up to 2 alleles/locus were considered as diploid (2n). Isolates with up to 3 alleles/locus were considered as triploid (3n), and the number of loci showing up to 3 alleles was recorded (1–2 loci, or more than 2 loci showing up to three alleles). Finally, isolates with up to 4 or 5 alleles/locus were noted as 4n/5n. The inferred ploidy is represented on the NJ tree.
Figure 2
Figure 2
Dendrogram of 1488 isolates of B. bruxellensis using 12 microsatellite markers. The dendrogram was drawn via the poppr package, using Bruvo’s distance and NJ clustering. Five clusters were considered and are represented by different colours. Isolates displaying identical genotypes are represented by a unique tip whose size is proportional to the number of isolates. Inferred ploidy was made as described in Fig. 1F. The histograms represent the distribution of isolates depending on the substrate and the five considered clusters. The pie chart illustrates the proportion of the strains originating from different types of sources.
Figure 3
Figure 3
Ancestral populations of 1488 B. bruxellensis strains STRUCTURE plots for K = 5 (the number of ancestral population with lowest entropy, see Supplementary Fig. S1). Each bar represents an isolate and the colour of the bar represents the estimated ancestry proportion of each of the K clusters. The same colour code is kept as in Figs 1 and 2.
Figure 4
Figure 4
Population differentiation represented by fixation index (FST) of B. bruxellensis genetic groups between each other. The range of FST is from 0 to 1, 1 meaning that the two populations do not share any genetic diversity.
Figure 5
Figure 5
Growth parameters of B. bruxellensis strains at different concentrations of SO2. 39 strains belonging to the 6 genetic groups defined previously were tested in small scale fermentations and growth (OD600) was measured in media containing different concentrations of sulfur dioxide (0, 0.2, 0.4, and 0.6 mg.L−1 mSO2) and in biological triplicates. Three parameters were considered: lag phase (h): end of lag phase considered when OD above initial OD*5%; maximal growth rate (r) = number of cellular divisions per hour; maximal OD; S and T stand for sensitive and tolerant (Kruskal-Wallis test, α = 5%). Genetic groups are represented in the same colours as on Fig. 2.

References

    1. Renouf V, Lonvaud-Funel A. Development of an enrichment medium to detect Dekkera/Brettanomyces bruxellensis, a spoilage wine yeast, on the surface of grape berries. Microbiol. Res. 2007;162:154–167. doi: 10.1016/j.micres.2006.02.006. - DOI - PubMed
    1. Renouf, V. Evidence for differences between B. bruxellensis strains originating from an enological environment. Int. J. Wine Res. 95 10.2147/IJWR.S4612 (2009).
    1. Chatonnet P, Dubourdieu D, Boidron JN. The Influence of Brettanomyces/Dekkera sp. Yeasts and Lactic Acid Bacteria on the Ethylphenol Content of Red Wines. Am. J. Enol. Vitic. 1995;46:463–468.
    1. Chatonnet P, Dubourdieu D, Boidron JN. Incidence des conditions de fermentation et d’élevage des vins blancs secs en barriques sur leur composition en substances cédées par le bois de chêne. Sci. Aliments. 1992;12:665–685.
    1. Heresztyn T. Metabolism of volatile phenolic compounds from hydroxycinnamic acids byBrettanomyces yeast. Arch. Microbiol. 1986;146:96–98. doi: 10.1007/BF00690165. - DOI

Publication types

LinkOut - more resources