. 2018 Feb 21:11:20.
doi: 10.3389/fnmol.2018.00020. eCollection 2018.

Junctional E-cadherin/p120-catenin Is Correlated with the Absence of Supporting Cells to Hair Cells Conversion in Postnatal Mice Cochleae

Affiliations

Junctional E-cadherin/p120-catenin Is Correlated with the Absence of Supporting Cells to Hair Cells Conversion in Postnatal Mice Cochleae

Wen-Wei Luo et al. Front Mol Neurosci. .

Abstract

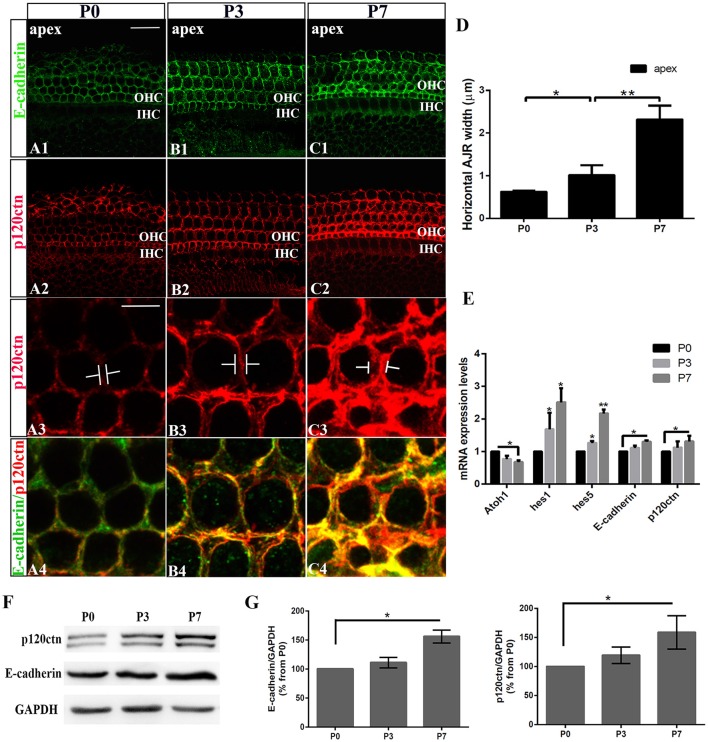
Notch inhibition is known to generate supernumerary hair cells (HCs) at the expense of supporting cells (SCs) in the mammalian inner ear. However, inhibition of Notch activity becomes progressively less effective at inducing SC-to-HC conversion in the postnatal cochlea and balance organs as the animal ages. It has been suggested that the SC-to-HC conversion capacity is inversely correlated with E-cadherin accumulation in postnatal mammalian utricles. However, whether E-cadherin localization is linked to the SC-to-HC conversion capacity in the mammalian inner ear is poorly understood. In the present study, we treated cochleae from postnatal day 0 (P0) with the Notch signaling inhibitor DAPT and observed apparent SC-to-HC conversion along with E-cadherin/p120ctn disruption in the sensory region. In addition, the SC-to-HC conversion capacity and E-cadherin/p120ctn disorganization were robust in the apex but decreased toward the base. We further demonstrated that the ability to regenerate HCs and the disruption of E-cadherin/p120ctn concomitantly decreased with age and ceased at P7, even after extended DAPT treatments. This timing is consistent with E-cadherin/p120ctn accumulation in the postnatal cochleae. These results suggest that the decreasing capacity of SCs to transdifferentiate into HCs correlates with E-cadherin/p120ctn localization in the postnatal cochleae, which might account for the absence of SC-to-HC conversion in the mammalian cochlea.

Keywords: DAPT; E-cadherin/p120ctn complexes; SC-to-HC conversion; cochlea; hair cells; supporting cells.


Figures

Figure 1
Figure 1
Increase in junctional E-cadherin/p120ctn in the postnatal mice cochleae. (A–C) Representative images of the apex turn in cochleae from P1, P3, and P7 mice immuno-labeled for E-cadherin (green) and p120ctn (red) with the same confocal intensity. (A3–C3) Magnified images of A2-C2 showing the differences in the junctional p120ctn widths between adjacent outer hair cells in the same row. (A4–C4) Double-labeling of E-cadherin (green) and p120ctn (red). (D) Quantification of apical junctional region (AJR) widths in the apexes of cochleae from P0, P3, and P7 mice. (E) Relative Atoh1, Hes1, Hes5, E-cadherin, and P120-catenin mRNA expression levels in cochleae from P1, P3, and P7 mice (n = 3 for each age). The mRNA levels for each gene were plotted relative to the respective P0 mRNA levels. (F) Representative examples of Western blots showing the E-cadherin, p120ctn, and total GAPDH (internal control) protein expression levels in pure cochlear sensory epithelia harvested from P1, P3, and P7 mice. (G) Quantification of Western-blot experimental results. E-cadherin and p120ctn were normalized to the total GAPDH levels, and the values are expressed as percentages relative to the P0 levels for comparison. The average percentages relative to P0 are shown (n = 3). OHC, Outer hair cell region; IHC, Inner hair cell region. The error bars in (D,E,G) show the SEMs. *p < 0.05, **p < 0.01. The scale bars represent 20 μm in (A1) and 5 μm in (A3).
Figure 2
Figure 2
DAPT-induced direct differentiation and mitotic generation of HCs are primarily restricted to the outer hair cell region. (A) A postnatal day 0 (P0) organ of Corti was cultured for 24 h. Cochlear explants were divided into the apex, mid-apex, mid-base, and base turn. Myo7a-labeled HCs (green) are shown. (B,C) After 4 days of DAPT treatment, numerous Myo7a+ HCs (green) were detected in the outer hair cell region, whereas only a few Prox1+ SCs (red) were preserved in the pillar cell region of the SC layer compared with the vehicle control. (D) In control cochleae, no EdU+/Myo7a+ HCs were detected in the sensory region of the HC layer. (E) In DAPT-treated cochleae, several EdU+/Myo7a+ HCs were observed in the HC layer. (E4) Magnified images of (E3). The explants presented in (B–E) were of the apex of P0 cochleae. OHC, Outer hair cell region; IHC, Inner hair cell region; DC, Deiter cell region; PC, Pillar cell region. The scale bars represent 200 μm in (A) and 25 μm in (B–E).
Figure 3
Figure 3
DAPT induces E-cadherin/p120ctn disorganization in the outer hair cell region of the sensory epithelium. (A–D) Images of the mid-apex of P0 cochleae treated with DMSO or DAPT for 2–4 days and immunostained for E-cadherin (blue), p120ctn (green), and Myo7a (red). In control cochleae, E-cadherin internalization and p120ctn depletion did not occur in the sensory epithelium (A,B). In the DAPT-treated groups, internalization of E-cadherin occurred along with depletion of p120ctn in the outer hair cell region (C,D). The short arrows in both (C1,D1) show that E-cadherin internalization occurred following the DAPT treatments. The long arrows in (C2) indicate that p120ctn was decreased in the sensory epithelium after 2 days of DAPT treatment. Following 4 days of DAPT treatment, p120ctn was depleted in the outer hair cell region (long arrows in D2). The short arrows in (C5) indicate SCs that internalized E-cadherin. The short arrows in (D5) represent HCs that internalized E-cadherin. (E) Relative Atoh1, Hes1, Hes5, E-cadherin, and p120ctn mRNA expression levels in P0 cochleae treated with DMSO or DAPT for 48 h (n = 3 for each gene). The mRNA levels for each gene were plotted relative to the respective vehicle control mRNA levels. (F) Representative images of Western blots showing the E-cadherin, p120ctn, and total GAPDH (internal control) protein expression levels in cochlear sensory epithelia treated with DMSO or DAPT for 4 days. (G) Quantification of Western blot experiments. E-cadherin and p120ctn were normalized to the total GAPDH levels, and the values are expressed as percentages relative to DMSO for comparison. Average percentages relative to DMSO are shown (n = 3). (H) 3D projections showing that Myo7a+ HCs and Prox1+ SCs in the sensory region are surrounded by p120ctn and do not undergo SC-to-HC conversion in control cochleae (long arrows). HCs and SCs were surrounded by p120ctn in x-z-axial sections (H2) and in y-z-axial sections (H3). (I) In DAPT-treated cochleae, p120ctn was largely depleted in both the HC and SC layers, whereas Myo7a+ HCs were significantly increased, and Prox1+ SCs were dramatically decreased (short arrows). (I2) x-z-axial sections. (I3) y-z-axial sections. Myo7a (blue), Prox1 (green), and p120ctn (red). The error bars in (E,G) show the SEMs. **p < 0.01. The scale bars represent 10 μm in (A–D) and 25 μm in (H,I).
Figure 4
Figure 4
The SC-to-HC conversion capacity differs by region and decreases with age. (A–F) The apexes of P0, P3, and P7 cochleae cultured for 4 days in the presence of DAPT or DMSO. (A,B) In the apexes of DAPT-treated P0 cochleae, the number of Myo7a+ HCs significantly increased and the number of Prox1+ SCs significantly decreased compared with the control. (C,D) In DAPT-treated P3 cochlea, there was a significant increase in Myo7a+ HCs and a decrease in Prox1+ SCs compared with DMSO treatment. (E,F) In the apexes of P7 cochlea, there were no differences in the numbers of Myo7a+ HCs and Prox1+ cells between the DAPT treatment group and the control group. (G,H) Quantification of the number of Myo7a+ HCs/100 μm and Prox1+ SCs/100 μm after 4 days of DAPT or DMSO treatments from the apex to the base of cochleae from P0, P3, and P7 mice. The error bars in (G,H) show the SEMs. **p < 0.01. The scale bar represents 20 μm.
Figure 5
Figure 5
E-cadherin/p120ctn disorganization and SC-to-HC conversion decline with age and cease by P7. (A–F) Whole mounts of apexes harvested from P0, P3, and P7 cochleae treated with DMSO and DAPT for 4 days. Myo7a (red), Prox1 (green), and p120ctn (white). p120ctn was imaged with the same confocal intensity for all samples. (A2–F2) p120ctn expression in the apex from P0 to P7. p120ctn disintegration was detected in the apexes of P0 (short arrow in B2) and P3 (short arrow in D2) mice treated with DAPT. No p120ctn disruption was observed in P7 mice or controls. (A3–F3) Higher magnification of p120ctn in the HC layers. p120ctn was depleted and HCs were regenerated in P0 (short arrows in B3) and P3 mice (short arrows in F3). (A4–F4) Higher magnification of p120ctn and Prox1+ SCs in the SC layer. After DAPT treatments, p120-depleted areas were notably smaller in the apexes of P3 mice (short arrows in F4) compared with those in the apexes of P0 mice (short arrows in B4). (G,H) Ratio of Myo7a+ HCs and Prox1+ SCs following DAPT treatments compared with DMSO treatments in the apexes of P0, P3, and P7 cochleae. (G–I) Quantification of p120ctn depletion widths in the apexes of P0, P3, and P7 mice treated with DAPT for 4 days. (J) Scatter plot of the number of Myo7a+ HCs/100 μm (y-axis) and Prox1+ SCs/100 μm (x-axis) in the apexes of P0, P3, and P7 mice. A higher number of generated Myo7a+ HCs was associated with the retention of fewer Prox1+ SCs. (K,L) Scatter plot of Myo7a+ HCs/100 μm (I, y-axis), Prox1+ SCs/100 μm (J, y-axis), and p120 depletion widths (x-axis) in the apexes of P0, P3, and P7 mice. The data in (G–L) are presented as the means ± SEMs. **p < 0.01. The scale bars represent 25 μm.
Figure 6
Figure 6
p120ctn depletion and SC-to-HC conversion gradually decrease from the apex to the base. (A–D) The apex, mid-apex, mid-base, and base of P0 cochleae were treated with DAPT and immunolabeled with Myo7a (red), Prox1 (green), and p120ctn (white). p120ctn was imaged with the same confocal intensity from the apex to the base. (A2–D2) Images show p120ctn expression from the apex to the base. p120ctn deletion occurred from the apex to the mid-base of the sensory epithelium (short arrows in A2–C2). (A3–D3) Higher magnification of p120ctn in the HC layers. Loss of p120ctn was detected in the HC layers (short arrows in A3–C3). (A4–D4) Higher magnification of p120ctn and Prox1+ SCs in the SC layers. p120ctn was depleted and Prox1+ SCs disappeared in the sensory region. The depleted areas decreased in a gradient from the apex to the mid-base (short arrows in A4–C4). Some scattered SCs retained p120ctn and did not exhibit any phenotype conversion. (E) Number of Myo7a+ HCs/100 μm in the sensory region. (F) Number of Prox1+ SCs/100 μm in the sensory region. (G) Widths of p120ctn depletion in the sensory region. (H) Scatterplot of the number of Myo7a+ HCs/100 μm (y-axis) and Prox1+ SCs/100 μm (x-axis) from the apex to the base of P0 cochleae. A higher number of retained Prox1+ SCs was associated with the generation of fewer Myo7a+ HCs. (I,J) Schematic diagram of Myo7a+ cells/100 μm (I, y-axis), Prox1+ cells/100 μm (J, y-axis) and p120 depletion widths (x-axis) from the apex to the base. A greater depletion of p120ctn was associated with the generation of more Myo7a+ HCs and the preservation of fewer Prox1+ SCs. The data in (E–J) are presented as the means ± SEMs. *p < 0.05, **p < 0.01. The scale bars represent 25 μm.
Figure 7
Figure 7
Longer DAPT treatments promote p120ctn/Prox1+ SC depletion and SC-to-HC conversion in the apex and mid-apex of P0 cochleae. (A–F) Mid-apexes harvested from P0 mice were treated with DMSO or DAPT for 2, 4, or 6 days. Myo7a (red), Prox1 (green), and p120ctn (white). (A2–F2) p120ctn expression in the apex for 2–6 days. (A3–F3) Higher magnification of p120ctn. A longer DAPT treatment was associated with greater p120ctn depletion. The short arrows in (B,D,F) indicate the regions with p120 depletion. (G–I) Comparison and quantification of Myo7a+ HCs, Prox1+ SCs, and p120 depletion widths in the mid-apexes of P0 mice treated with DAPT for 2, 4, and 6 days. The data in (G–I) are presented as the means ± SEMs. *p < 0.05. **p < 0.01. The scale bars represent 25 μm.

Similar articles

Cited by

References

    1. Boggiano J. C., Fehon R. G. (2012). Growth control by committee: intercellular junctions, cell polarity, and the cytoskeleton regulate Hippo signaling. Dev. Cell 22, 695–702. 10.1016/j.devcel.2012.03.013 - DOI - PMC - PubMed
    1. Burns J. C., Christophel J. J., Collado M. S., Magnus C., Carfrae M., Corwin J. T. (2008). Reinforcement of cell junctions correlates with the absence of hair cell regeneration in mammals and its occurrence in birds. J. Comp. Neurol. 511, 396–414. 10.1002/cne.21849 - DOI - PMC - PubMed
    1. Burns J. C., Collado M. S., Oliver E. R., Corwin J. T. (2013). Specializations of intercellular junctions are associated with the presence and absence of hair cell regeneration in ears from six vertebrate classes. J. Comp. Neurol. 521, 1430–1448. 10.1002/cne.23250 - DOI - PubMed
    1. Burns J. C., Corwin J. T. (2013). A historical to present-day account of efforts to answer the question: “what puts the brakes on mammalian hair cell regeneration?”. Hear. Res. 297, 52–67. 10.1016/j.heares.2013.01.005 - DOI - PMC - PubMed
    1. Burns J. C., Corwin J. T. (2014). Responses to cell loss become restricted as the supporting cells in mammalian vestibular organs grow thick junctional actin bands that develop high stability. J. Neurosci. 34, 1998–2011. 10.1523/JNEUROSCI.4355-13.2014 - DOI - PMC - PubMed

LinkOut - more resources