. 2018 Feb 20:9:291.
doi: 10.3389/fimmu.2018.00291. eCollection 2018.

T Cell Phenotype and T Cell Receptor Repertoire in Patients with Major Depressive Disorder

Affiliations

T Cell Phenotype and T Cell Receptor Repertoire in Patients with Major Depressive Disorder

Kostas Patas et al. Front Immunol. .

Abstract

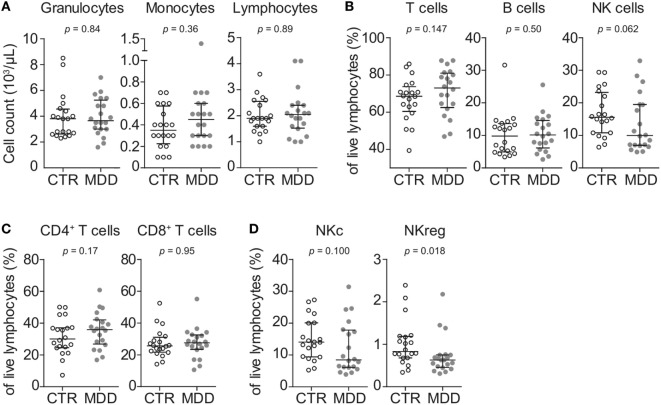
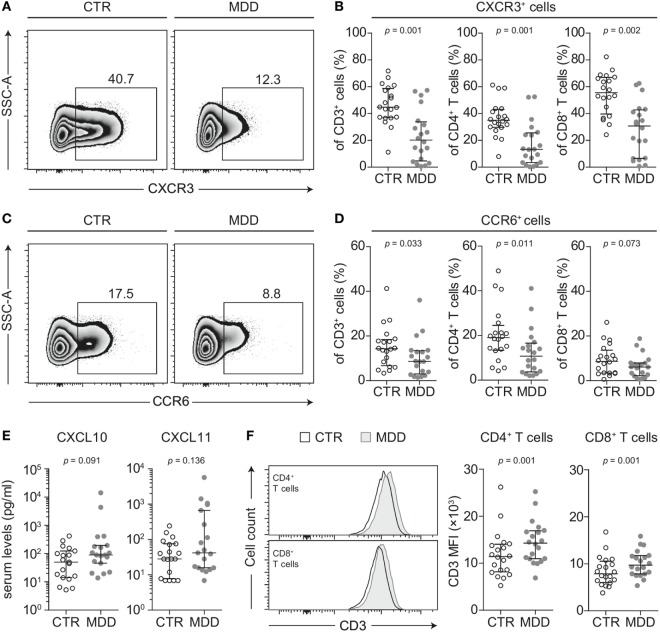
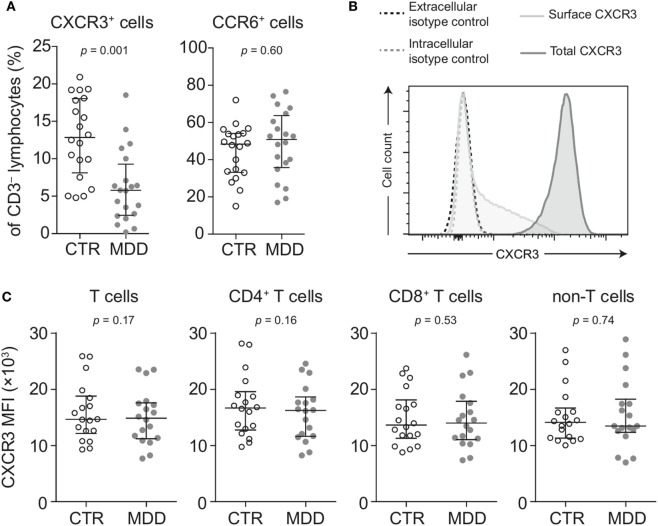
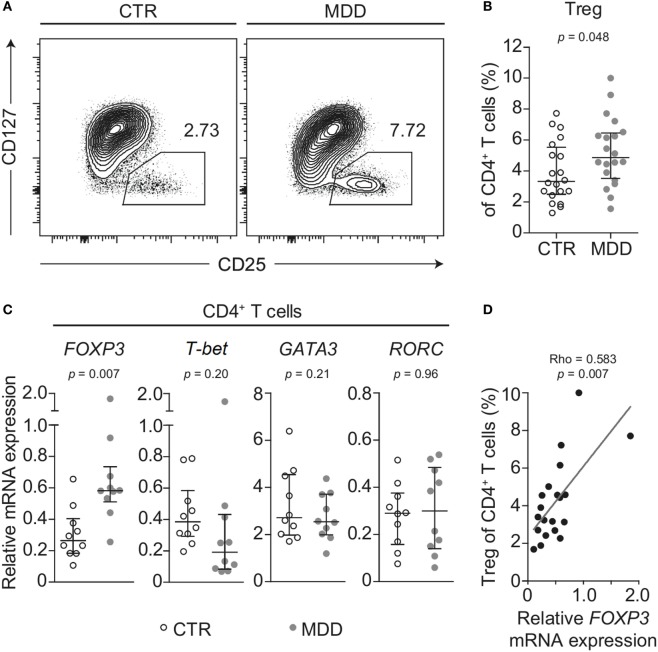
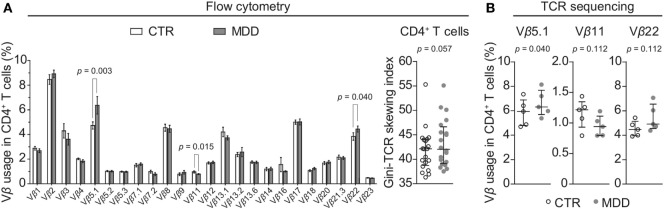
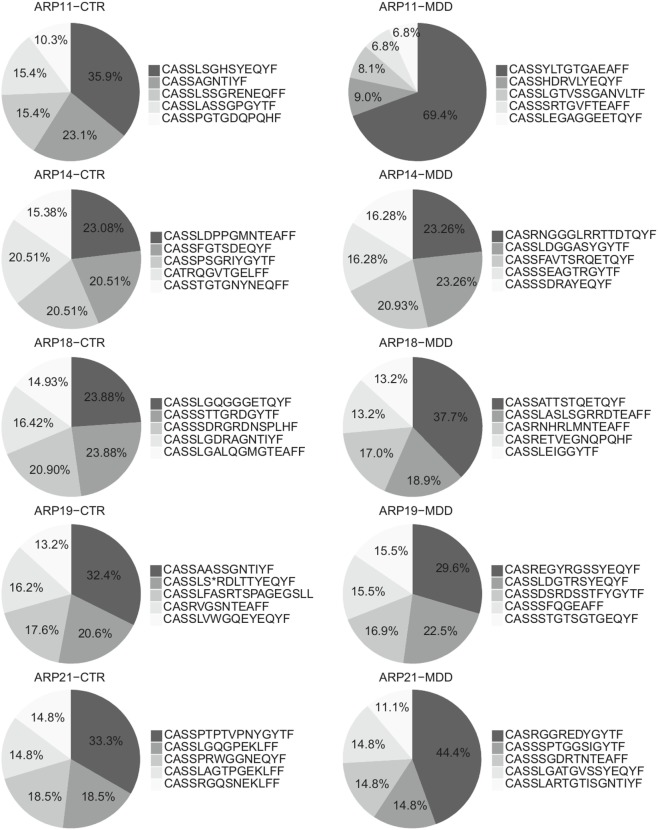
While a link between inflammation and the development of neuropsychiatric disorders, including major depressive disorder (MDD) is supported by a growing body of evidence, little is known about the contribution of aberrant adaptive immunity in this context. Here, we conducted in-depth characterization of T cell phenotype and T cell receptor (TCR) repertoire in MDD. For this cross-sectional case-control study, we recruited antidepressant-free patients with MDD without any somatic or psychiatric comorbidities (n = 20), who were individually matched for sex, age, body mass index, and smoking status to a non-depressed control subject (n = 20). T cell phenotype and repertoire were interrogated using a combination of flow cytometry, gene expression analysis, and next generation sequencing. T cells from MDD patients showed significantly lower surface expression of the chemokine receptors CXCR3 and CCR6, which are known to be central to T cell differentiation and trafficking. In addition, we observed a shift within the CD4+ T cell compartment characterized by a higher frequency of CD4+CD25highCD127low/- cells and higher FOXP3 mRNA expression in purified CD4+ T cells obtained from patients with MDD. Finally, flow cytometry-based TCR Vβ repertoire analysis indicated a less diverse CD4+ T cell repertoire in MDD, which was corroborated by next generation sequencing of the TCR β chain CDR3 region. Overall, these results suggest that T cell phenotype and TCR utilization are skewed on several levels in patients with MDD. Our study identifies putative cellular and molecular signatures of dysregulated adaptive immunity and reinforces the notion that T cells are a pathophysiologically relevant cell population in this disorder.

Keywords: T cell receptor repertoire; adaptive immunity; chemokine receptors; major depressive disorder; regulatory T cells.


Figures

Figure 1
Figure 1
Peripheral blood counts and frequencies of major leukocyte subsets. (A) Absolute peripheral blood granulocyte, monocyte, and lymphocyte counts were obtained from major depressive disorder (MDD) patients and matched non-depressed controls (CTR) using a Coulter Ac·T Diff hematology analyzer (n = 40). (B) Frequencies of total CD3+ lymphocytes (T cells), CD3CD56CD19+ B cells and CD3CD19CD20CD14CD56+ natural killer (NK) cells were obtained by flow cytometric analysis of thawed peripheral blood mononuclear cells. (C) T cells were further discriminated into CD4+CD8 and CD8+CD4 subsets. (D) Among NK cells, CD56lowCD16+ cytotoxic (NKc) cells and CD56highCD16 regulatory (NKreg) cells were also identified. Graphs depict medians with interquartile ranges. For all comparisons, the Wilcoxon signed-rank test was used.
Figure 2
Figure 2
CXCR3 and CCR6 expression in T cells of major depressive disorder (MDD) patients and non-depressed controls. (A) CXCR3-expressing T cells were identified by flow cytometric analysis of peripheral blood mononuclear cells from MDD patients and matched non-depressed controls (CTR). Displayed values are frequencies of CXCR3+ T cells expressed as a percentage of live CD3+ lymphocytes from a representative case–control pair. (B) Percentages of CXCR3-expressing total T cells, CD4+, and CD8+ T cells were quantified in our cohort (n = 40). (C,D) Similar analyses were conducted for the surface expression of CCR6 on total T cells as well as on the CD4+ and CD8+ T cell subsets. (E) The CXCR3 ligands CXCL10 and CXCL11 were quantified in sera of MDD patients and matched controls using a cytometric bead array (n = 38). (F) Surface CD3 MFI levels were measured by flow cytometric analysis of CD4+ and CD8+ T cells from MDD patients and matched controls (n = 40). All graphs depict medians with interquartile ranges. For all comparisons, the Wilcoxon signed-rank test was used. SSC-A, side scatter-area; CXCR3, CXC-chemokine receptor type 3; CCR6, CC-chemokine receptor type 6; MFI, median fluorescence intensity.
Figure 3
Figure 3
Surface and intracellular staining of CXCR3. (A) Percentages of CXCR3- and CCR6-expressing CD3 lymphocytes (non-T cells) were quantified in major depressive disorder (MDD) patients and matched non-depressed controls (CTR) (n = 40). (B) A representative plot shows fluorescence intensity of CXCR3 expression in intact (surface CXCR3; light gray-shaded curve) relative to fixed and permeabilized T cells (total cellular CXCR3; dark gray-shaded curve). Isotype-matched negative controls were used at the same concentration before fixation (black-dashed curve) and after fixation-permeabilization (gray-dashed curve) and showed no positive staining for CXCR3. (C) Total cellular CXCR3 MFI levels were measured by flow cytometric analysis of fixed and permeabilized peripheral blood mononuclear cells (PBMCs) from MDD patients and matched controls (n = 36). Stained PBMCs were gated on live CD3+ lymphocytes (T cells), CD4+ and CD8+ T cell subsets as well as CD3 lymphocytes (non-T cells). Graphs depict medians with interquartile ranges. For all comparisons, the Wilcoxon signed-rank test was used. CXCR3: CXC-chemokine receptor type 3; CCR6: CC-chemokine receptor type 6; MFI: median fluorescence intensity.
Figure 4
Figure 4
Regulatory T cells in major depressive disorder (MDD) patients and non-depressed controls. (A) Regulatory T cells (Tregs) were identified by flow cytometric analysis of peripheral blood mononuclear cells from MDD patients and matched non-depressed controls (CTR). Displayed values are frequencies of Tregs expressed as a percentage of live CD4+ T cells from a representative case–control pair. (B) Differences in Treg frequency are depicted for the entire cohort (n = 40). (C) Negatively selected CD4+ T cells from a subsample of patients and matched controls (n = 20) were analyzed for mRNA expression of the T helper-associated transcription factors Forkhead box P3 (FOXP3), T-box 21 (T-bet), GATA binding protein 3 (GATA3), and RAR related orphan receptor C (RORC), respectively. Expression was normalized to the geometric mean expression of three housekeeping genes (IPO8, TBP, RPL13A). (D) The correlation between the expression levels of the gene FOXP3 in purified CD4+ T cells and the frequency of Tregs expressed as a percentage of CD4+ T cells is plotted (n = 20). Graphs depict medians with interquartile ranges. For all comparisons, the Wilcoxon signed-rank test was used.
Figure 5
Figure 5
CD4+ T cell repertoire in major depressive disorder (MDD) patients and non-depressed controls. (A) T cell receptor (TCR) variable β chain (Vβ) family distribution analysis was performed by means of flow cytometric interrogation of CD4+ T cells from MDD patients and matched non-depressed controls (CTR) (n = 40). The resulting clonogram represents percentages (mean ± SEM) of the usage of 24 Vβ families. The Gini-TCR skewing index was next applied to the flow cytometric Vβ repertoire analysis (graph on right). Significant post hoc comparisons are denoted for the families Vβ 5.1, Vβ 11, and Vβ 22 (two-tailed, uncorrected p-values). (B) CD4+ T cells were negatively selected from a subsample of patients and matched controls (n = 10) and total genomic DNA was extracted for next generation sequencing of the TCRβ CDR3 repertoire. Usage of the families Vβ 5.1 (TCRBV05-01), Vβ 11 (TCRBV25-01), and Vβ 22 (TCRBV02-01) was then followed up (one-tailed planned comparisons). For all comparisons, the Wilcoxon signed-rank test was used.
Figure 6
Figure 6
Top Vβ 5.1-expressing clones. Relative frequencies of top five clones expressing Vβ 5.1 (TCRBV05-01) and their CDR3 amino acid sequence in patients with major depressive disorder (MDD) and matched non-depressed controls (CTR) (n = 10).

References

    1. Bromet E, Andrade LH, Hwang I, Sampson NA, Alonso J, de Girolamo G, et al. Cross-national epidemiology of DSM-IV major depressive episode. BMC Med (2011) 9:90. 10.1186/1741-7015-9-90 - DOI - PMC - PubMed
    1. Vos T, Barber RM, Bell B, Bertozzi-Villa A, Biryukov S, Bolliger I, et al. Global, regional, and national incidence, prevalence, and years lived with disability for 301 acute and chronic diseases and injuries in 188 countries, 1990–2013: a systematic analysis for the Global Burden of Disease Study 2013. Lancet (2015) 386(9995):743–800. 10.1016/S0140-6736(15)60692-4 - DOI - PMC - PubMed
    1. Kupfer DJ, Frank E, Phillips ML. Major depressive disorder: new clinical, neurobiological, and treatment perspectives. Lancet (2012) 379(9820):1045–55. 10.1016/S0140-6736(11)60602-8 - DOI - PMC - PubMed
    1. Otte C, Gold SM, Penninx BW, Pariante CM, Etkin A, Fava M, et al. Major depressive disorder. Nat Rev Dis Primers (2016) 2:16065. 10.1038/nrdp.2016.65 - DOI - PubMed
    1. Rush AJ, Trivedi MH, Wisniewski SR, Nierenberg AA, Stewart JW, Warden D, et al. Acute and longer-term outcomes in depressed outpatients requiring one or several treatment steps: a STAR*D report. Am J Psychiatry (2006) 163(11):1905–17. 10.1176/ajp.2006.163.11.1905 - DOI - PubMed

Publication types

Substances