. 2018 Feb 19:9:199.
doi: 10.3389/fpls.2018.00199. eCollection 2018.

Physical and Chemical Barriers in Root Tissues Contribute to Quantitative Resistance to Fusarium oxysporum f. sp. pisi in Pea

Affiliations

Physical and Chemical Barriers in Root Tissues Contribute to Quantitative Resistance to Fusarium oxysporum f. sp. pisi in Pea

Moustafa Bani et al. Front Plant Sci. .

Abstract

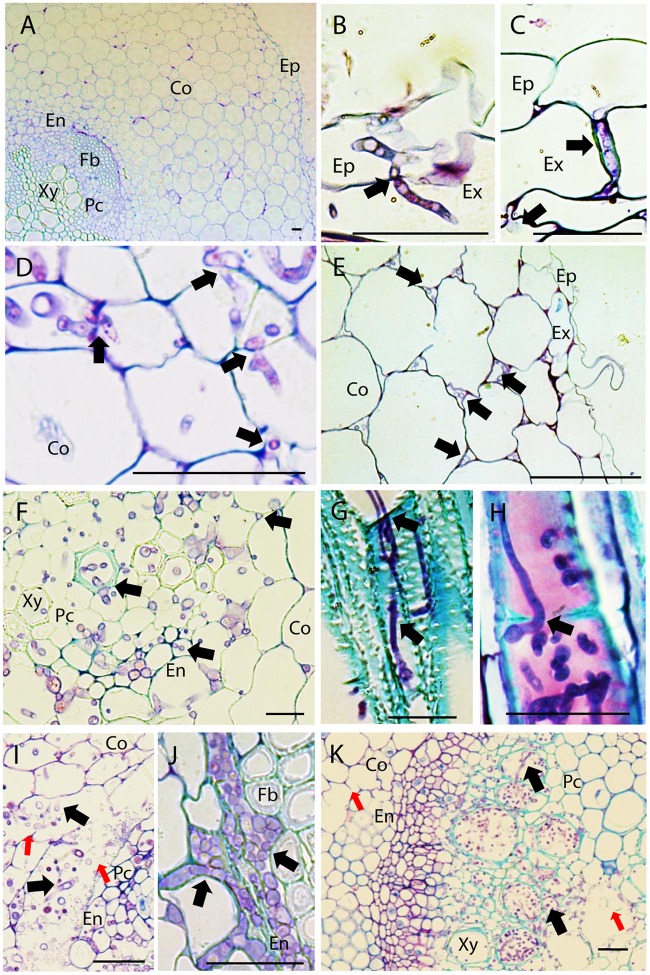
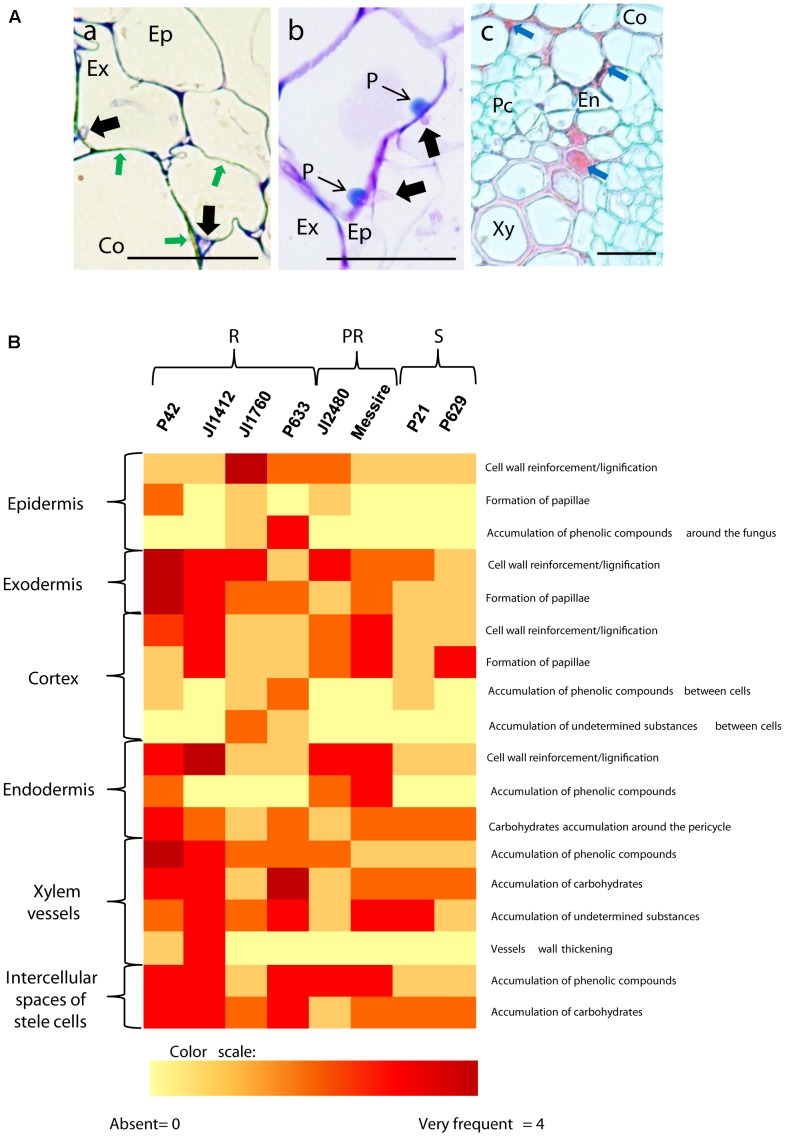
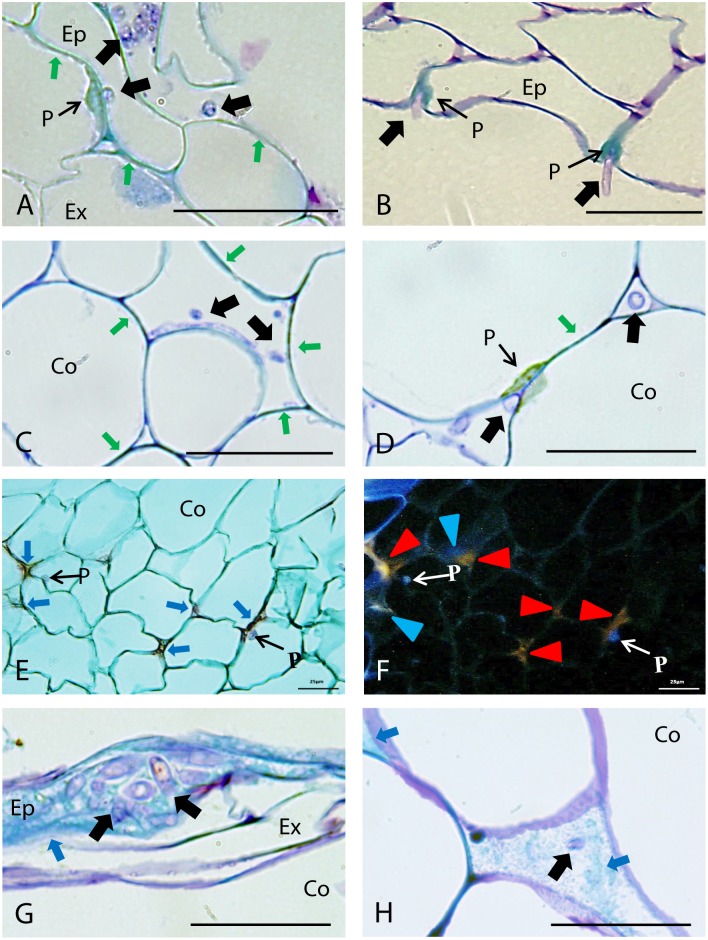
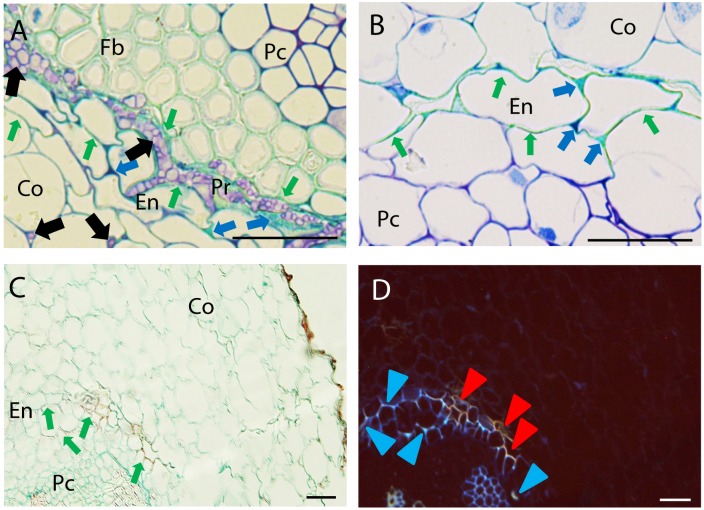
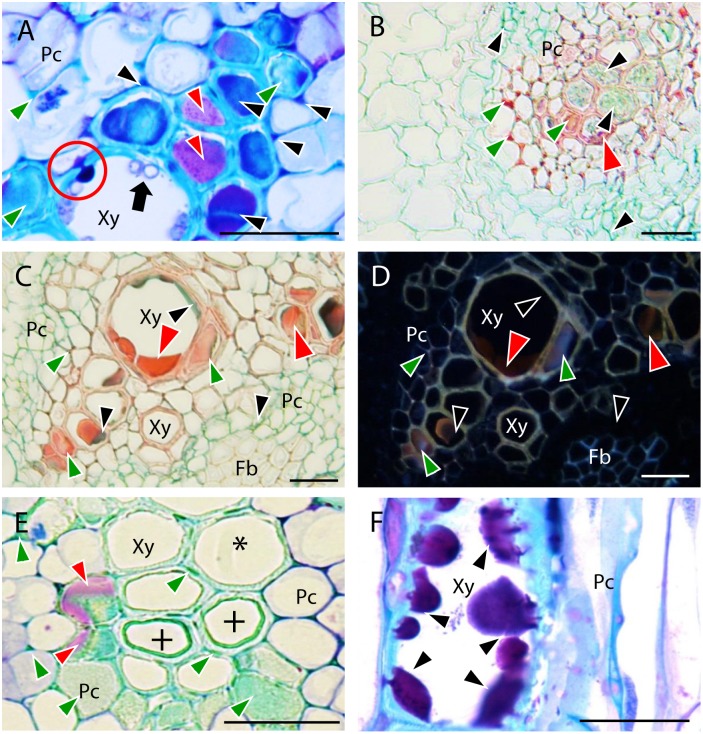
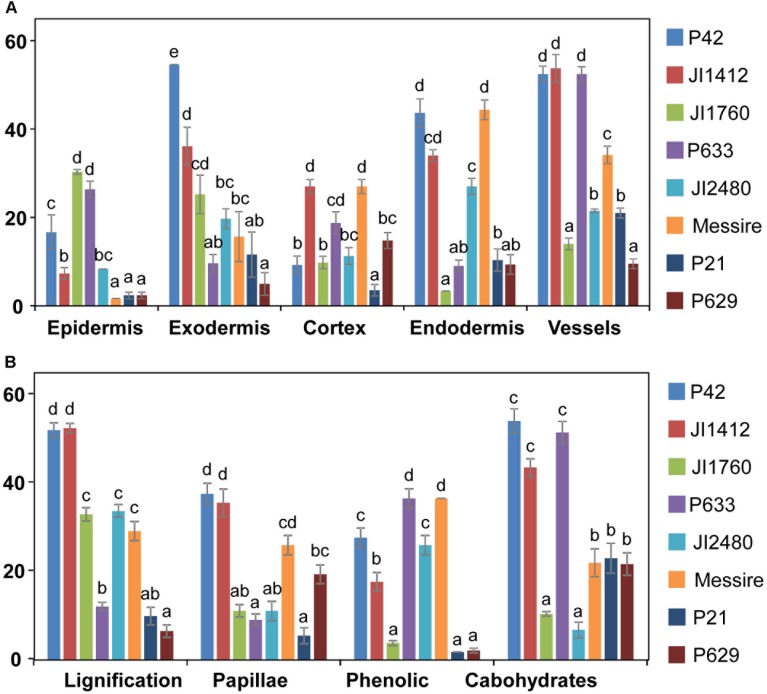
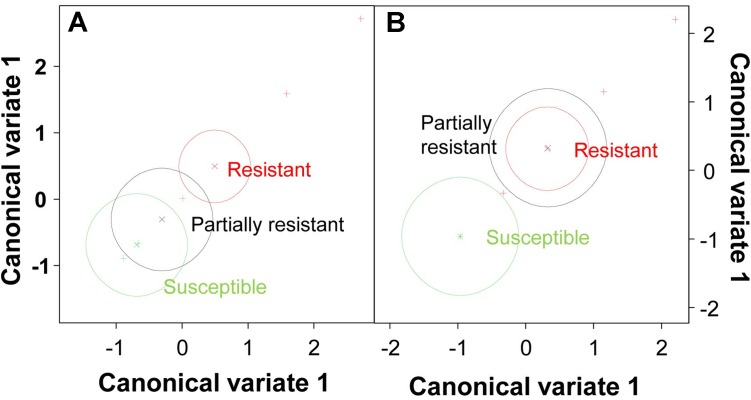
Fusarium wilt caused by Fusarium oxysporum f. sp. pisi (Fop) is one of the most destructive diseases of pea worldwide. Control of this disease is difficult and it is mainly based on the use of resistant cultivars. While monogenic resistance has been successfully used in the field, it is at risk of breakdown by the constant evolution of the pathogen. New sources of quantitative resistance have been recently identified from a wild relative Pisum spp. collection. Here, we characterize histologically the resistance mechanisms occurring in these sources of quantitative resistance. Detailed comparison, of the reaction at cellular level, of eight pea accessions with differential responses to Fop race 2, showed that resistant accessions established several barriers at the epidermis, exodermis, cortex, endodermis and vascular stele efficiently impeding fungal progression. The main components of these different barriers were carbohydrates and phenolic compounds including lignin. We found that these barriers were mainly based on three defense mechanisms including cell wall strengthening, formation of papilla-like structures at penetration sites and accumulation of different substances within and between cells. These defense reactions varied in intensity and localization between resistant accessions. Our results also clarify some steps of the infection process of F. oxysporum in plant and support the important role of cell wall-degrading enzymes in F. oxysporum pathogenicity.

Keywords: Fusarium oxysporum; Pisum sativum; cell wall strengthening; disease resistance; papilla-like structure; phenolic compounds; quantitative resistance; resistance mechanism.


Figures

FIGURE 1
FIGURE 1
Histopathology of Fusarium oxysporum f. sp. pisi (Fop) in pea accessions. The figure represents longitudinal and cross-sections of pea roots inoculated or not with Fop race 2 stained with TBO. (A) Cross-section of the susceptible P21 root maintained non-inoculated, showing a general view of pea root histology: epidermis, (Ep) cortex (Co), endodermis (En), parenchyma cells (Pc), Fiber cells (Fb), and xylem vessels (Xy). (B) Longitudinal section of Fop-inoculated root of the resistant accession P633 at 4 dpi, showing the penetration of an exodermal cell (Ex) by an infective hypha. Note the constriction of the hypha at site of cell wall penetration (black arrow). (C) Cross-section of the partially resistant accession Messire root at 7 dpi, showing the root penetration by Fop hypha growing between two exodermal cells (black arrow). (D) Cross-section of susceptible P629 roots at 7 dpi, showing intra- and intercellular progression of infective hyphae (Black arrows) through cortex and endodermis. Note the constriction of hypha at site of cortical cell penetration (Black arrows). (E) Cross section of Messire root at 7 dpi showing intercellular progression of infective hyphae through root cortex (Black arrows). (F) Cross-section of P21 root at 7 dpi after inoculation without root trimming showing abundant colonization of vascular tissue. (G) Longitudinal section of susceptible P21 root at 7 dpi showing inter- and intra-tracheary colonization of xylem vessels by elongation of infective hyphae (Black arrow). (H) Longitudinal section of resistant accession P633 at 7 dpi showing intra-tracheary colonization of xylem vessel by Fop conidia germinating through xylem perforation plate (Black arrow). (I) Cross section of the root of the susceptible accession P629 at 7 dpi showing intense degradation of endodermal cell layer (red arrows) and the abundant Fop development in the created intercellular space (Black arrows). (J) Cross-section of the partially resistant Messire root at 7 dpi showing abundant colonization of the intracellular space of endodermal cells by Fop (Black arrows). (K) Cross-section of the susceptible P21 hypocotyl showing abundant colonization of xylem vessels by Fop (Black arrows) and cell degradation in presence or absence of fungal structure (Red arrows). Bar = 25 μm.
FIGURE 2
FIGURE 2
Description and frequency of resistance mechanisms detected in pea cells. (A) Cross sections of inoculated pea roots of resistant accessions illustrating the main mechanisms of resistance detected in pea. (a) TBO stained cross-section of inoculated root of the resistant P42 at 7 dpi showing the strengthening of cortical cell wall through lignification (Green arrows). (b) TBO stained cross-section of inoculated root of the resistant P42 at 7 dpi showing the apposition of defensive papilla preventing cell penetrations. (c) AGS stained cross-section of inoculated root of the resistant accession P42 at 7 dpi showing accumulation of undetermined substance in the intercellular space and within cells (Blue arrows). Black arrows indicate fungal cell presence. Bars = 25 μm. Ep, epidermis; Ex, exodermis; En, endodermis; Co, cortex; Xy, xylem cells; Pc, parenchyma cells. (B) Heatmap summarizing the frequency of host cell reactions observed 7 days after Fop inoculation in the different accessions at each root tissue. Intensity range from yellow (0 = absent reaction) to dark red (4 = very frequent) according to a visual scale ranging from 0 to 4 with 0 = absence of reaction, 1 = rare: reaction observed in less than 10% of the analyzed sections, 2 = low frequency: <30%, 3 = frequent: <60% and 4 = high frequency: >60%. R, resistant accessions; PR, partially resistant accessions; S, susceptible accessions.
FIGURE 3
FIGURE 3
Defense responses and pathogen infection observed in root epidermis and cortical tissues of resistant pea accessions after inoculation with Fop race 2. Arrows indicate fungus. (A) Longitudinal section of the partially resistant Messire stained with TBO at 4 days post-inoculation (dpi) showing cell wall lignification (Green arrows) at epidermis (Ep) and the formation of a papilla at the exodermis (Ex) to prevent Fop hypha penetration. (B) TBO-stained cross-section of the resistant accession P42 at 4 dpi showing formation of papillae (P) in the epidermis at site of attempted fungal penetration. (C) Cross-section of the partially resistant accession Messire at 4 dpi, stained with TBO, showing the lignification of cortical cell walls (Green arrows) to prevent hypha penetration into cortical cells (Co). (D) TBO-stained cross-section of resistant accession JI1412 roots at 4 dpi showing the lignification of cortical cell wall (Green arrows) and formation of papillae (P) impeding fungal entry into cortical cells, although the fungi can progress through the cortex intercellularly (Black arrows). (E) Cross-section of the resistant accession JI1760 roots at 7 dpi, stained with alcian green:safranin mixture (AGS), showing papillae and the accumulation of undetermined substances (red staining indicated by Blue arrows) in the intercellular space of cortical cells. (F) The same cross-section as (E) observed by epi-fluorescence showing the blue-violet fluorescence of papillae and two types of fluorescent emission corresponding to the substances accumulated between cortical cells, blue (Blue arrowheads corresponding to lignin) and orange (Red arrowheads). (G) TBO-stained longitudinal section of the resistant accession P633 at 4 dpi showing accumulation of phenolic substances (turquoise green staining indicated by arrowheads) at epidermis in presence of fungi. (H) TBO-stained cross-section of the resistant accession P633 roots at 4 dpi showing the accumulation of phenolic substances (Blue arrows) between cortical cells. Bar = 25 μm.
FIGURE 4
FIGURE 4
Defense responses and pathogen infection observed at root endodermis in resistant pea accessions after inoculation with Fop race 2. (A) Cross-section of the partially resistant Messire at 7 days post-inoculation (dpi) stained with TBO showing cell wall strengthening of the endodermal cell walls (Green arrows) accumulation of phenolic and carbohydrates compounds (Blue arrows) stained in turquoise-green and dark purple respectively in the intercellular spaces of endodermis (En) and pericycle (Pr) surrounding fungal cells (Black arrows) Note the presence of fungus in the intercellular spaces of cortical cells and its accumulation between endodermal and pericycle cell layers. (B) TBO-stained cross-section of the partially resistant JI2480 at 4 dpi showing the strengthening of endodermal cell walls (turquoise green staining indicated by Green arrows) and the accumulation of phenolics (stained turquoise green) and carbohydrates (dark purple) between endodermal cells (Blue arrows). (C) Cross-section of the resistant accession JI1412 at 7 dpi, stained with alcian green:safranin mixture (AGS) showing strengthening of endodermal cell wall (red staining indicated by Green arrows). (D) The same cross-section as (C) observed under epi-fluorescence showing blue and orange fluorescent emissions of endodermal cell wall suggesting their lignification and suberisation respectively (Blue and Red arrowheads). Bar = 25 μm.
FIGURE 5
FIGURE 5
Defense responses observed in root vascular tissues of resistant pea accessions after inoculation with Fop race 2. Black arrows indicate fungus. (A) Cross-section of the resistant accession JI1412 at 7 dpi stained with TBO showing carbohydrate accumulation (dark purple staining indicated by Black arrowheads) between vascular cells and entering infected xylem cells (red circle) to trap fungal cells (Black arrows). The turquoise blue coloration accumulating within and between completely plugged vascular cells (Green arrowheads) corresponds to polyphenols and the clear purple staining (Red arrowheads) to other filling substances. (B) Cross-section of the resistant accession P633 at 7 dpi stained with AGS showing accumulation of polyphenols (red staining indicated by Green arrowheads), carbohydrates (green staining indicated by Black arrowheads) and other filling substances (dark red staining indicated by Red arrowheads) within and between vascular cells. (C) Cross-section of the resistant P42 roots at 7 dpi stained with AGS showing accumulation of polyphenols (red staining indicated by Green arrowheads) and carbohydrates (green staining indicated by Black arrowheads) and other filling substances (dark red staining indicated by Red arrowheads) within and between vascular cells. (D) The same as (C) observed under epi-fluorescence showing the fluorescent emission of polyphenols (Green arrowheads). Black arrowheads indicate carbohydrates and Red arrowheads indicate other non-fluorescent filling substances. (E) TBO-stained cross-section of the resistant accession JI1412 roots at 7 dpi showing the cell wall strengthening of xylem cells (+). Asterisk indicates a normal vessel as a reference. Note also the accumulation of phenolics between xylem parenchyma cells and in the lumen of some xylem cells (turquoise green staining, Green arrowheads) and accumulation of other filling substance in some of these xylem cells (clear purple staining, Red arrowheads). (F) TBO-stained longitudinal section of the resistant accession JI1412 at 7 dpi showing the filling of a xylem vessel by carbohydrates originating from intercellular vascular cells progressively plugging the xylem vessel (Black arrowheads). Bar = 25 μm.
FIGURE 6
FIGURE 6
Relevance of tissue and resistance responses in the defense strategy of pea against F. oxysporum. Data compare the frequency of overall resistance responses at each root tissue (A) and frequency of each defense reaction (B) between pea accessions with different levels of resistance to F. oxysporum. Vertical bars are standard errors for n = 10. Different letters indicate significant differences at p < 0.05 according to Tukey’s range test.
FIGURE 7
FIGURE 7
Multivariate analysis of pea genotypes. Scatterplot of canonical variate analysis scores of components 1 and 2 based on the frequency of resistance responses observed at epidermis/exodermis (A) and lignification (B).

Similar articles

Cited by

References

    1. Baayen R. P., Elgersma D. M. (1985). Colonization and histopathology of susceptible and resistant carnation cultivars infected with Fusarium oxysporum f.sp. dianthi. Neth. J. Plant Pathol. 91 119–135. 10.1007/bf01976386 - DOI
    1. Baayen R. P., Ouellette G. B., Rioux D. (1996). Compartmentalization of decay in carnations resistant to Fusarium oxysporum f. sp. dianthi. Phytopathology 86 1018–1031. 10.1094/Phyto-86-1018 - DOI
    1. Baayen R. P., Vaneijk C., Elgersma D. M. (1989). Histology of roots of resistant and susceptible carnation cultivars from soil infested with Fusarium oxysporum f. sp. dianthi. Neth. J. Plant Pathol. 95 3–13. 10.1007/bf02000875 - DOI
    1. Baird D. B., Harding S. A., Lane P. W., Murray D. A., Payne R. W., Soutar D. M. (2002). Genstat for Windows (6th Edition) Introduction. Oxford: VSN International.
    1. Bani M., Cimmino A., Evidente A., Rubiales D., Rispail N. (2018). Pisatin involvement in the variation of inhibition of Fusarium oxysporum f. sp. pisi spore germination by root exudates of Pisum spp. germplasm. Plant Pathol. (in press) 10.1111/ppa.12813 - DOI

LinkOut - more resources