. 2017:1:0083.
doi: 10.1038/s41551-017-0083. Epub 2017 Jun 13.

3D-printed vascular networks direct therapeutic angiogenesis in ischaemia

Affiliations

3D-printed vascular networks direct therapeutic angiogenesis in ischaemia

T Mirabella et al. Nat Biomed Eng. 2017.

Erratum in

Abstract

Arterial bypass grafts remain the gold standard for the treatment of end-stage ischaemic disease. Yet patients unable to tolerate the cardiovascular stress of arterial surgery or those with unreconstructable disease would benefit from grafts that are able to induce therapeutic angiogenesis. Here, we introduce an approach whereby implantation of 3D-printed grafts containing endothelial-cell-lined lumens induces spontaneous, geometrically guided generation of collateral circulation in ischaemic settings. In rodent models of hind-limb ischaemia and myocardial infarction, we demonstrate that the vascular patches rescue perfusion of distal tissues, preventing capillary loss, muscle atrophy and loss of function. Inhibiting anastomoses between the construct and the host's local capillary beds, or implanting constructs with unpatterned endothelial cells, abrogates reperfusion. Our 3D-printed grafts constitute an efficient and scalable approach to engineer vascular patches able to guide rapid therapeutic angiogenesis and perfusion for the treatment of ischaemic diseases.


Conflict of interest statement

Competing interests: C.S.C. is a cofounder of, and owns equity in, Innolign Biomedical, a company that is developing tissue engineered products.

Figures

Fig. 1
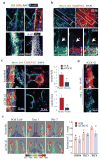
Fig. 1. Fabricated vascular patches rescue perfusion in hind limb ischaemia
(a) Schematic of VP (vascular patches) fabrication (i). Carbohydrate glasses are 3D printed as parallel filament. After PDGLA-coating and fibrin (10mg/ml) bulking, the sacrificial sugar are removed by overnight washings in PBS. The remaining channels are endothelialized by flowing HUVECs and shear-conditioning the confluent monolayer for an overnight, before implantation in ischaemic hind limb mice. In ii), representation of the patches implantation site within the cauterized femoral artery space. In iii, representation of patches retrieved after 5 days from implantation (stars mark collateral arteries and veins). (b) Laser Doppler Imaging (Moor Instrument) of distal limbs over time (post-surgery, day 3 and day5) in the two groups (VP vs Sham). Histograms for quantification of perfusion levels of the ischaemic limb. Perfusion units (P.U.) of ischaemic limb were normalized to P.U. of contralateral not ischaemic limb (C.L. norm, considered=1) and expressed as fold change. Data expressed as mean ± S.D. N=6 animals per group. T-test for comparison between two groups. * p-value < 0.01. (c) Staining of Gastrocnemius muscle (GC) sections (25 um thick) with phalloidin (cytoarchiteture), IB4 (capillaries) and activated caspase 3 (apoptosis). Representative images (Spin Disk Confocal, 20um stack) for the two groups (VP vs Sham). Arrow points at apoptotic EC. (d) Quantifications of capillary density (#vessels / #muscle fibers), capillary degeneration (% apoptotic ECs in capillaries) and muscle atrophy (distribution of muscle fiber area expressed as percentage of frequency for each area subgroup, with range 0–60 equal to 0–6000 um2) in the GC of the two groups (VP vs Sham). Total number of capillaries analyzed is 55 and 211 respectively for VP and Sham group. Data expressed as mean ± S.E.M. Three animals per group, three GC sections per mouse. Mann-Whitney U test for comparison between two groups. * p-value < 0.02. (e) Hematoxilyn&Eosin (H&E) staining of 15 um sections of GC muscles in the two groups (VP vs Sham) revealing hypercellularization and fibrosis initiation in the not implanted mice.
Fig. 2
Fig. 2. Host-driven biointegration of grafts drives perfusion of ischaemic limb
(a) VP explanted at day 5 are stained for Isolectin B4 (IB4) labeling both host capillary and VP endothelium), mouse specific smooth muscle actin-alpha (SMA) labeling host-derived smooth muscle cells, and Ter119 labeling red blood cells. The lower right panel shows a channel perfused by host vasculature as demonstrated by dye localization immediately following systemic perfusion of dye-labeled dextran (b–c) Explanted VP at day 5 are stained for host vessels (mouse CD31). Endogenous red fluorescence of implanted mCherry HUVECs is also shown. In (b), upper panels show a low magnification of a channel (dashed lines) within the VP implant. Lower panel shows the high magnification of the channel, which is chimeric (wall covered by both Host CD31 and implanted mCherry HUVECs) and anastomosed to a host capillary (arrow). In (c), 5 days ex vivo VP (scrambled and silenced for CDC42), with left panels showing the patterned channels (dashed lines) as mosaic multicellular composites (endogenous fluorescence for implanted mCherry-HUVECs and mouse CD31-stained host ECs); and panels on the right showing anastomosis between host capillaries and parental VP-derived vessels (ChHUVECs). In histograms, the number of VP-derived vessels (Parent vessels), and the number of anastomotic points between parent and host vessels was quantified in 9 fields from VP explanted from 3 mice per group (SCR vs siCDC42). Data expressed as mean ± S.E.M. Mann-Whitney U test for comparison between two groups. * p-value < 0.04. In (d), CDC42-silenced VP explanted at day 5 were stained with mouse specific smooth muscle actin-alpha (SMA) labeling host-derived smooth muscle cells, and with UAE-1 lectin, as a systemically injected dye labeling human endothelial cells of the implanted channels to demonstrate vascular integrity and function. Panels a, b, c, d are representative 100 μm stack images. In (e), Laser Doppler Imaging (Moor Instrument) of distal limbs over time (post-surgery, day 3 and day5) in the two groups: control VP (scrambled) versus VP where CDC42 has been knocked down (siCDC42). Histograms for quantification of perfusion levels of the ischaemic limb. Perfusion units (P.U.) of ischaemic limb were normalized to P.U. of contralateral non ischaemic limb (C.L. norm, considered=1) and expressed as fold change. Data expressed as mean ± S.D. N=4 animals per group. T-test for comparison between two groups. * p-value < 0.05.
Fig. 3
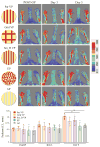
Fig. 3. Geometric patterning within vascular patches impacts perfusion performance
Laser Doppler Imaging of distal limbs over time (post-surgery, day 3 and day 5) in the five groups: vascular patches where channels were oriented parallel to each other (Par VP), or orthogonally to each other to form a grid (Grid VP), vascular patches with parallel channels of smaller diameter (Sm-D VP), endothelial patches where HUVECs were randomly embedded into fibrin matrix (EP), and acellular patches (AP) containing patterned not endothelialized channels. Histograms for quantification of perfusion levels of the ischaemic limb. Perfusion units (P.U.) of ischaemic limb were normalized to P.U. of contralateral not ischaemic limb (C.L. norm, considered=1) and expressed as fold change. Data expressed as mean ± S.D. N=5 animals per group. Anova test with Bonferroni correction for comparison between groups. ** p-value < 0.01.
Fig. 4
Fig. 4. Fabricated vascular patches rescue cardiac function after myocardial infarction in rats
(a) Angled view of a rat undergoing implantation of vascular patches (VP, dashed circle), placed on the left ventricle of the infarcted heart. An explanted heart shows the vascularized region where the implant was placed 4 weeks prior (Inset, dashed circle). The DiI infused vasculature within the explanted patch is showed in red, with channel borders marked with dashed lines and point of connections between the channel and capillaries marked by stars. (b) Immunofluorescence images of explanted heart sections (15um thick) stained for vWF (green). The relative histogram shows vascular density for the indicated groups (no MI, sham, and VP groups) quantified as number of vWF-positive capillaries per mm2 of cardiac tissue. Heart capillaries were quantified in 3 fields per heart, from 8 explanted hearts in Sham group, and 10 explanted hearts in noMI and VP groups. N=8–10. Data expressed as mean ± S.E.M. Mann-Whitney U test for comparison between two groups. * p-value < 0.03, ** p-value < 0.01. (c) Representative pressure-volume loop for infarcted hearts that received either no treatment or VP. (d) Ejection fraction of infarcted hearts in the no MI, sham and VP groups. (e) Cardiac output of infarcted hearts in the no MI, sham and VP groups. (f) Left ventricular internal dimension for hearts in diastole (LVIDd) and systole (LVIDs) in the no MI, sham and VP groups. In D, E, F, data are expressed as mean ± S.E.M. One way ANOVA followed by Bonferroni correction was performed to seek significance between groups, with noMI group containing 11 rats, and Sham and VP groups containing 13 rats. N=11–13. * indicates p-value <0.01, while “n.s.” refers to no significant difference between groups.

Similar articles

Cited by

References

    1. CDC, NCHS. Underlying Cause of Death 1999–2013 on CDC WONDER Online Database, released 2015. [Accessed Feb. 3, 2015];Data are from the Multiple Cause of Death Files, 1999–2013, as compiled from data provided by the 57 vital statistics jurisdictions through the Vital Statistics Cooperative Program.
    1. CDC. Deaths, Percent of Total Deaths, and Death Rates for the 15 Leading Causes of Death: United States and Each State, 1999–2014
    1. Mozaffarian D, et al. American Heart Association Statistics Committee and Stroke Statistics Subcommittee Heart disease and stroke statistics-2015 update: a report from the American Heart Association. Circulation. 2015;131:29–322. - PubMed
    1. Fryar CD, Chen TC, Li X. Prevalence of uncontrolled risk factors for cardiovascular disease: United States, 1999–2010. NCHS Data Brief. 2012;103:1–8. - PubMed
    1. Fowkes FG, et al. Comparison of global estimates of prevalence and risk factors for peripheral artery disease in 2000 and 2010: a systematic review and analysis. Lancet. 2013;382:1329–1340. - PubMed