

Left Ventricular Unloading During Veno-Arterial ECMO: A Simulation Study
- PMID: 29517515
- PMCID: PMC6325768
- DOI: 10.1097/MAT.0000000000000755
Left Ventricular Unloading During Veno-Arterial ECMO: A Simulation Study
Abstract
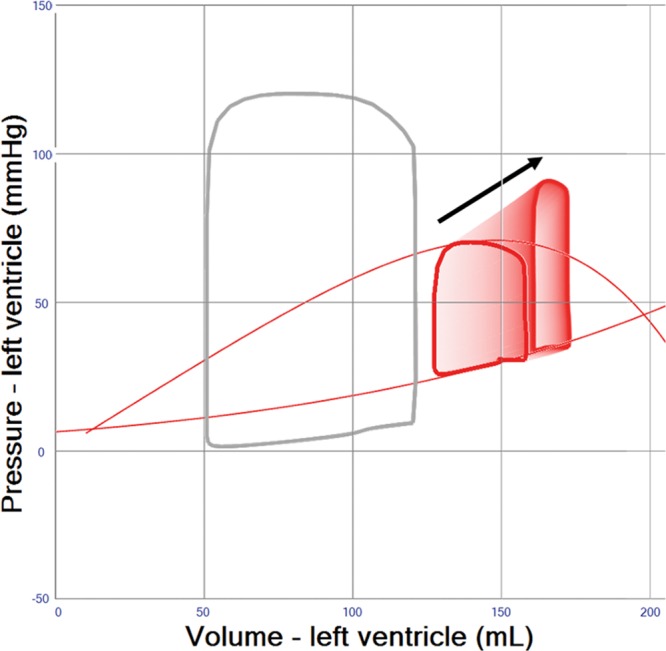
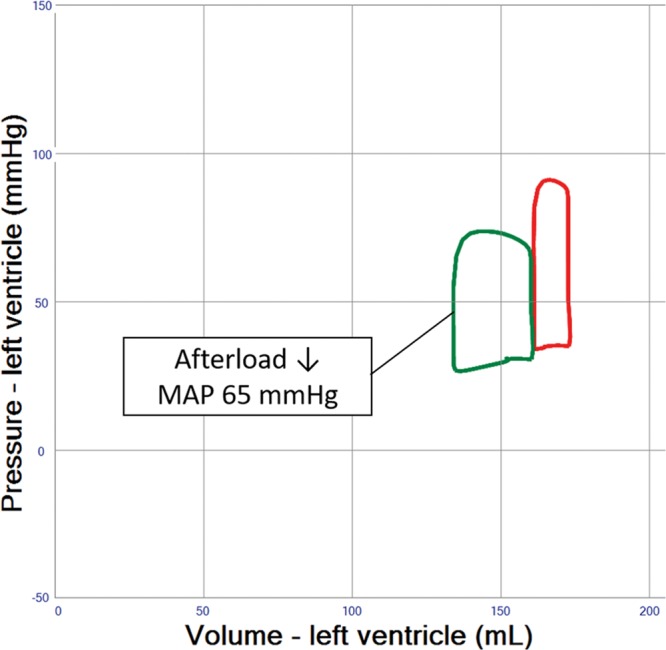
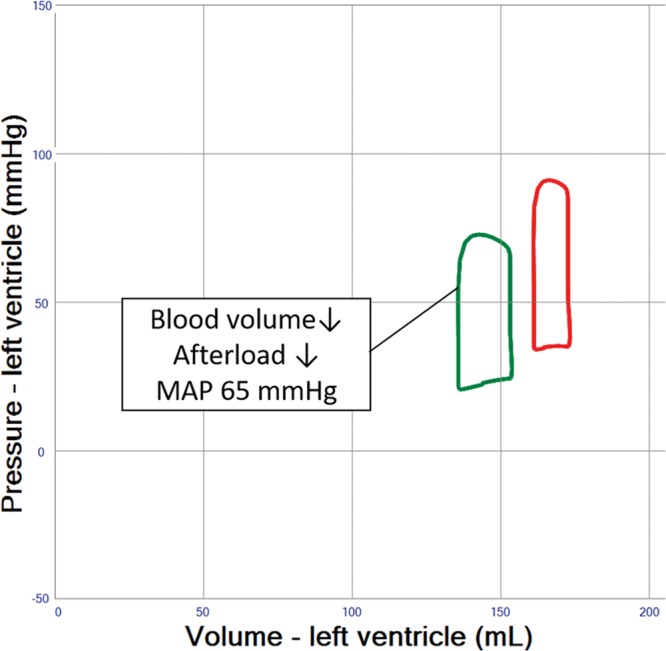
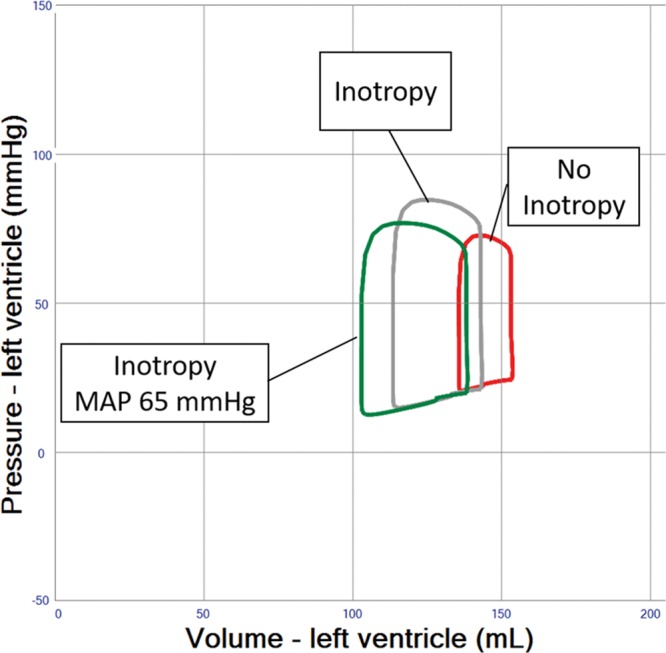
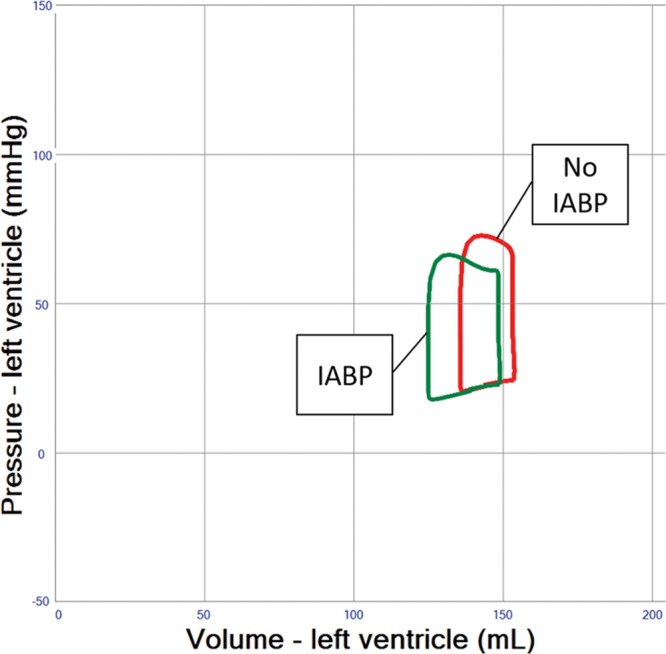
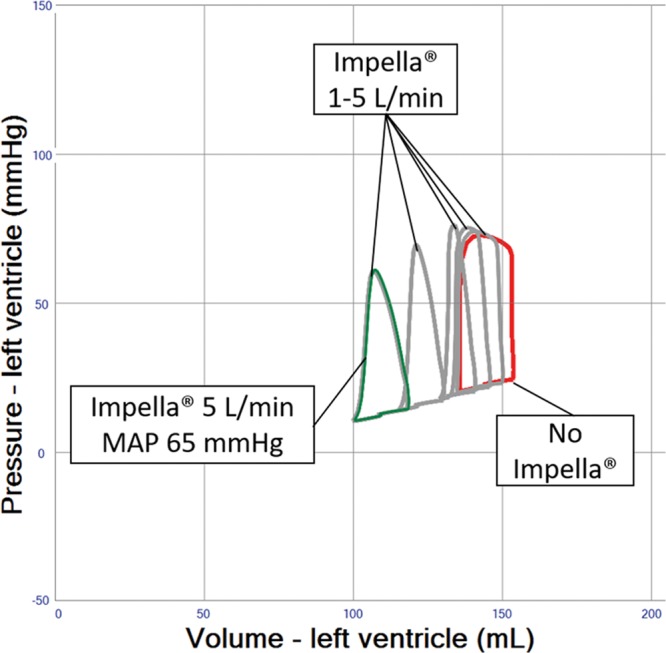
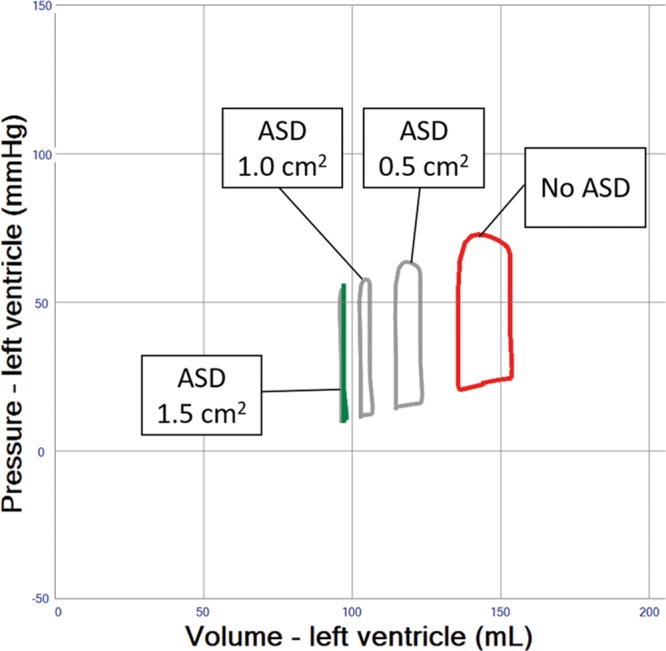
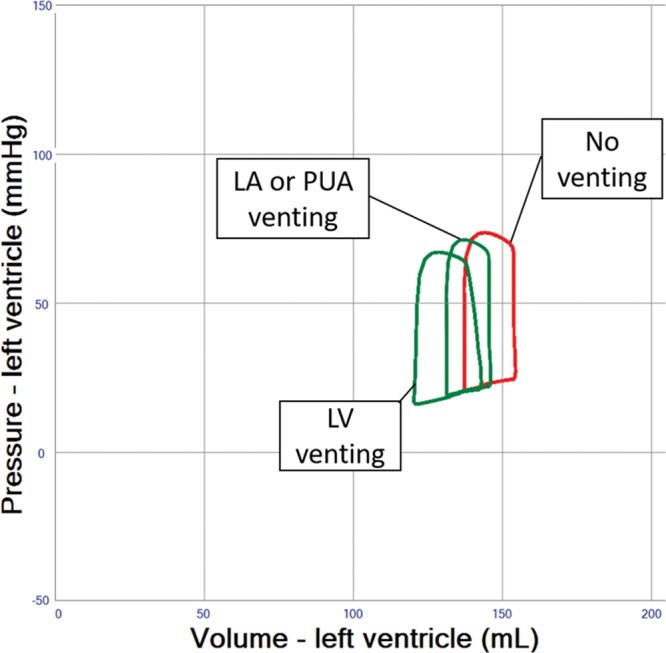
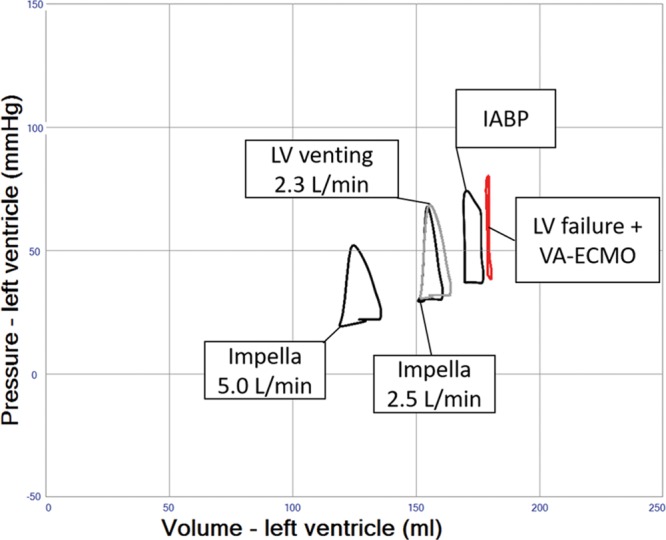
Veno-arterial extracorporeal membrane oxygenation (VA ECMO) is widely used in cardiogenic shock. It provides systemic perfusion, but left ventricular (LV) unloading is suboptimal. Using a closed-loop, real-time computer model of the human cardiovascular system, cardiogenic shock supported by peripheral VA ECMO was simulated, and effects of various adjunct LV unloading interventions were quantified. After VA ECMO initiation (4 L/min) in cardiogenic shock (baseline), hemodynamics improved (increased to 85 mm Hg), while LV overload occurred (10% increase in end-diastolic volume [EDV], and 5 mm Hg increase in pulmonary capillary wedge pressure [PCWP]). Decreasing afterload (65 mm Hg mean arterial pressure) and circulating volume (-800 mL) reduced LV overload (12% decrease in EDV and 37% decrease in PCWP) compared with baseline. Additional intra-aortic balloon pumping only marginally decreased cardiac loading. Instead, adjunct Impella™ enhanced LV unloading (23% decrease in EDV and 41% decrease in PCWP). Alternative interventions, for example, left atrial/ventricular venting, yielded substantial unloading. We conclude that real-time simulations may provide quantitative clinical measures of LV overload, depending on the degree of VA ECMO support and adjunct management. Simulations offer insights into individualized LV unloading interventions in cardiogenic shock supported by VA ECMO as a proof of concept for potential future applications in clinical decision support, which may help to improve individualized patient management in complex cardiovascular disease.
Figures
Similar articles
-
Left ventricular unloading during veno-arterial ECMO: a review of percutaneous and surgical unloading interventions.Perfusion. 2019 Mar;34(2):98-105. doi: 10.1177/0267659118794112. Epub 2018 Aug 16. Perfusion. 2019. PMID: 30112975 Free PMC article. Review.
-
Unloading of the Left Ventricle During Venoarterial Extracorporeal Membrane Oxygenation Therapy in Cardiogenic Shock.JACC Heart Fail. 2018 Dec;6(12):1035-1043. doi: 10.1016/j.jchf.2018.09.009. JACC Heart Fail. 2018. PMID: 30497643
-
Left anterior descending coronary artery blood flow and left ventricular unloading during extracorporeal membrane oxygenation support in a swine model of acute cardiogenic shock.Artif Organs. 2015 Feb;39(2):171-6. doi: 10.1111/aor.12336. Epub 2014 Jun 17. Artif Organs. 2015. PMID: 24935151
-
Comparison of left ventricular unloading strategies on venoarterial extracorporeal life support.Interact Cardiovasc Thorac Surg. 2021 Apr 8;32(3):467-475. doi: 10.1093/icvts/ivaa284. Interact Cardiovasc Thorac Surg. 2021. PMID: 33249443 Free PMC article.
-
Left Ventricular Unloading During Extracorporeal Membrane Oxygenation in Patients With Cardiogenic Shock.J Am Coll Cardiol. 2019 Feb 19;73(6):654-662. doi: 10.1016/j.jacc.2018.10.085. J Am Coll Cardiol. 2019. PMID: 30765031
Cited by
-
Fulminant myocarditis in adults: a narrative review.J Geriatr Cardiol. 2022 Feb 28;19(2):137-151. doi: 10.11909/j.issn.1671-5411.2022.02.006. J Geriatr Cardiol. 2022. PMID: 35317391 Free PMC article.
-
IABP versus Impella Support in Cardiogenic Shock: "In Silico" Study.J Cardiovasc Dev Dis. 2023 Mar 26;10(4):140. doi: 10.3390/jcdd10040140. J Cardiovasc Dev Dis. 2023. PMID: 37103019 Free PMC article.
-
Left ventricular unloading during extracorporeal life support for myocardial infarction with cardiogenic shock: surgical venting versus Impella device.Interact Cardiovasc Thorac Surg. 2022 Jan 6;34(1):137-144. doi: 10.1093/icvts/ivab230. Epub 2021 Aug 15. Interact Cardiovasc Thorac Surg. 2022. PMID: 34999807 Free PMC article.
-
Steady Flow Left Ventricle Unloading Is Superior to Pulsatile Pressure Augmentation Venting During Venoarterial Extracorporeal Membrane Oxygenation Support.ASAIO J. 2024 Nov 1;70(11):929-937. doi: 10.1097/MAT.0000000000002208. Epub 2024 Apr 8. ASAIO J. 2024. PMID: 38588597
-
Left Ventricular Unloading in Extracorporeal Membrane Oxygenation: A Clinical Perspective Derived from Basic Cardiovascular Physiology.Curr Cardiol Rep. 2024 Jul;26(7):661-667. doi: 10.1007/s11886-024-02067-w. Epub 2024 May 7. Curr Cardiol Rep. 2024. PMID: 38713362 Free PMC article. Review.
References
-
- Abrams D, Combes A, Brodie D. Extracorporeal membrane oxygenation in cardiopulmonary disease in adults. J Am Coll Cardiol 201463 (25 pt A): 2769–2778.. - PubMed
-
- Rupprecht L, Flörchinger B, Schopka S, et al. Cardiac decompression on extracorporeal life support: a review and discussion of the literature. ASAIO J 201359: 547–553.. - PubMed
-
- Mirabel M, Luyt CE, Leprince P, et al. Outcomes, long-term quality of life, and psychologic assessment of fulminant myocarditis patients rescued by mechanical circulatory support. Crit Care Med 201139: 1029–1035.. - PubMed
Publication types
MeSH terms
LinkOut - more resources
Full Text Sources
Other Literature Sources
