

Bone marrow-derived mesenchymal stem cells promote invasiveness and transendothelial migration of osteosarcoma cells via a mesenchymal to amoeboid transition
- PMID: 29517849
- PMCID: PMC5928379
- DOI: 10.1002/1878-0261.12189
Bone marrow-derived mesenchymal stem cells promote invasiveness and transendothelial migration of osteosarcoma cells via a mesenchymal to amoeboid transition
Abstract
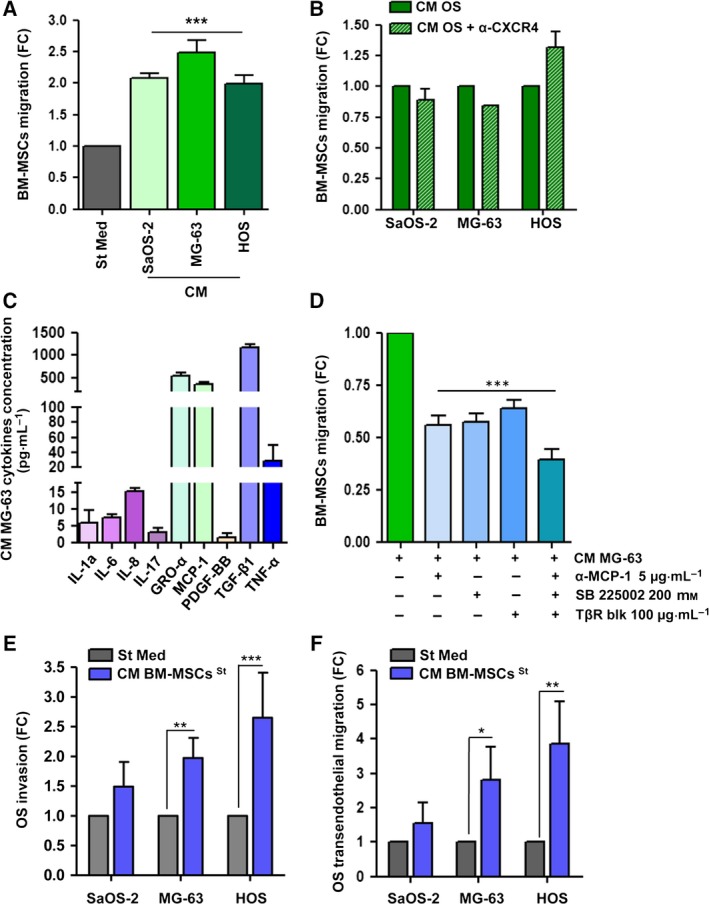
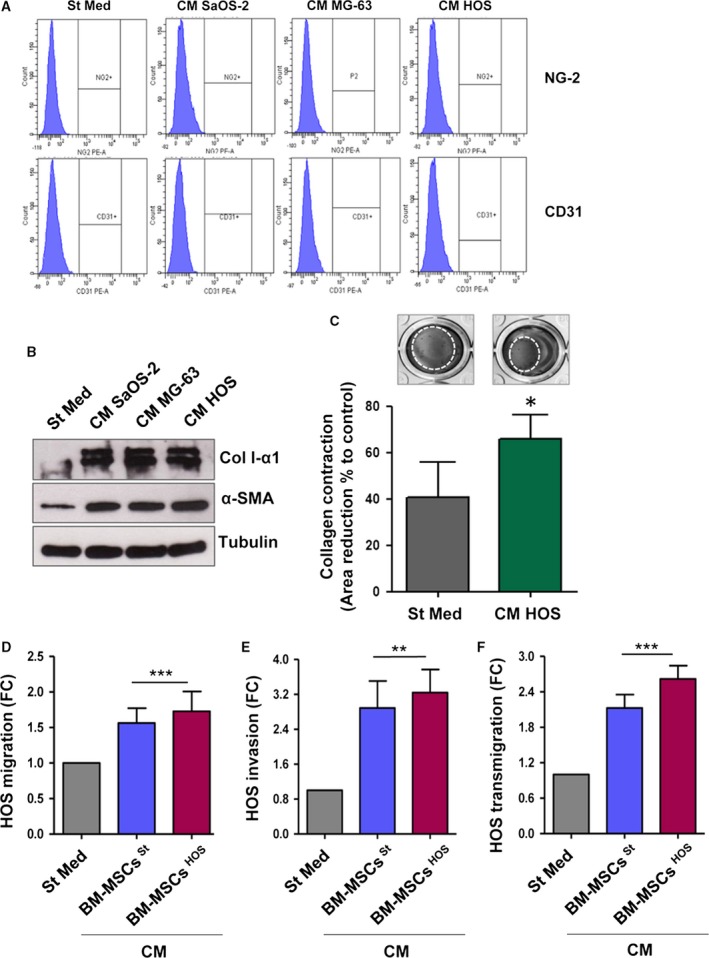
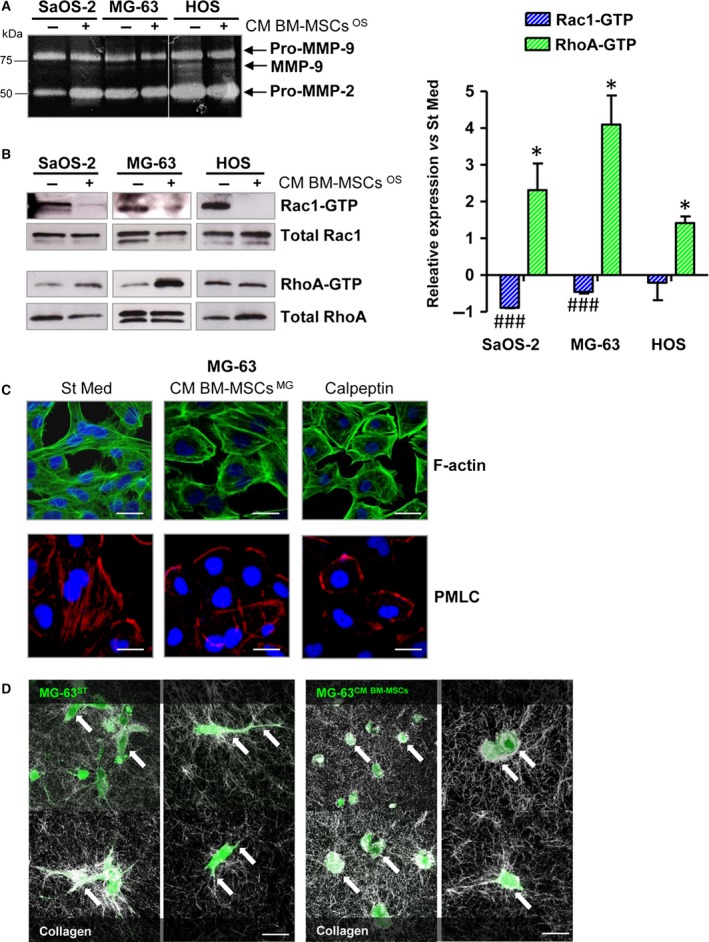
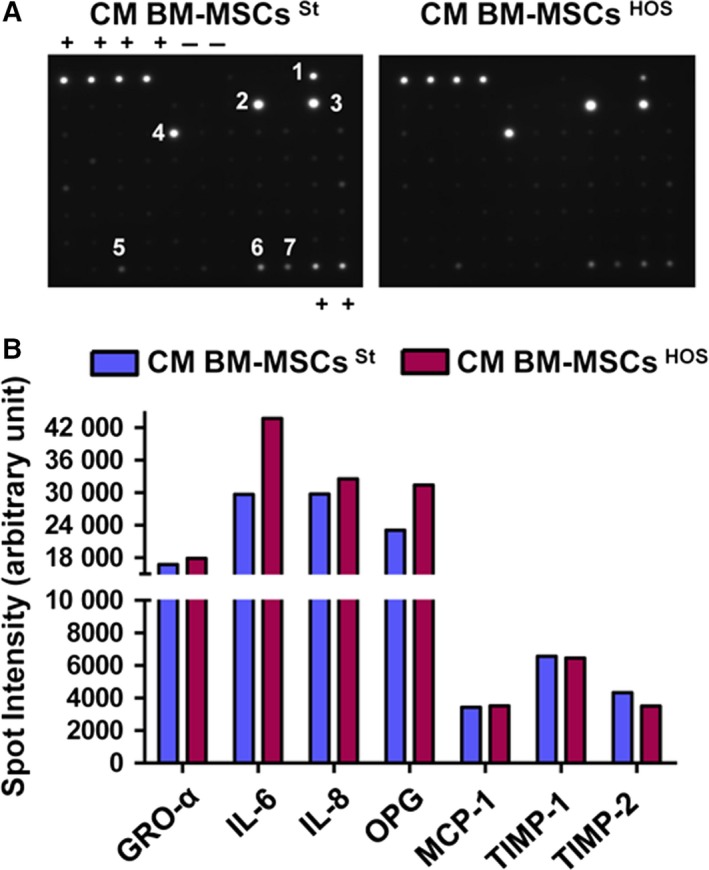
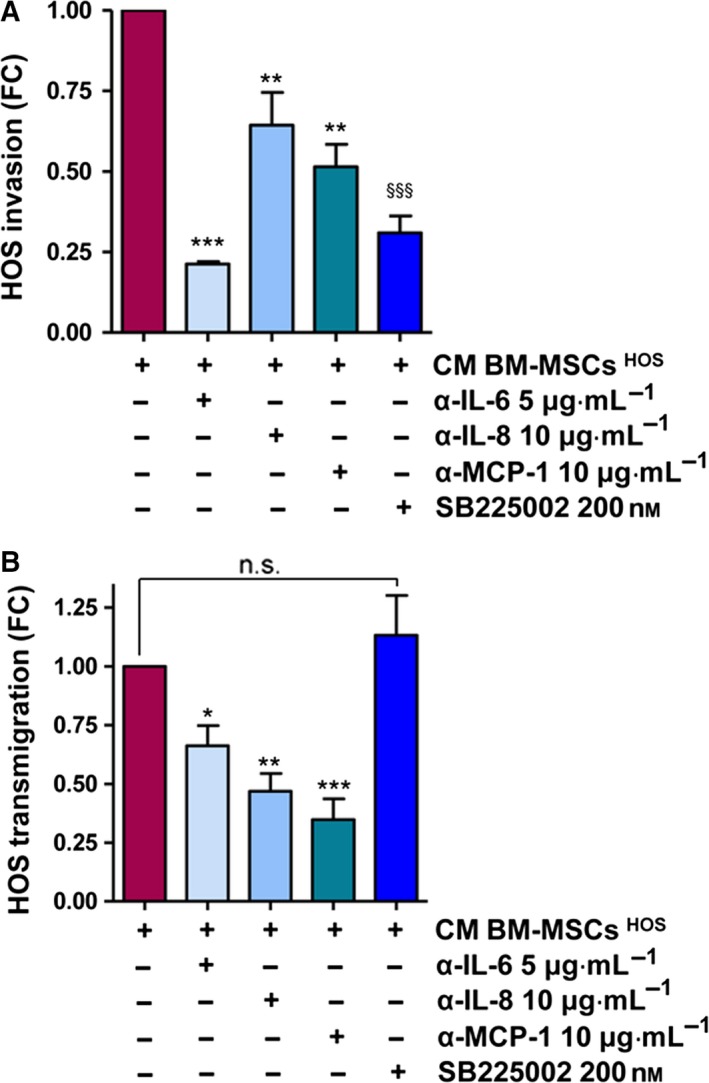
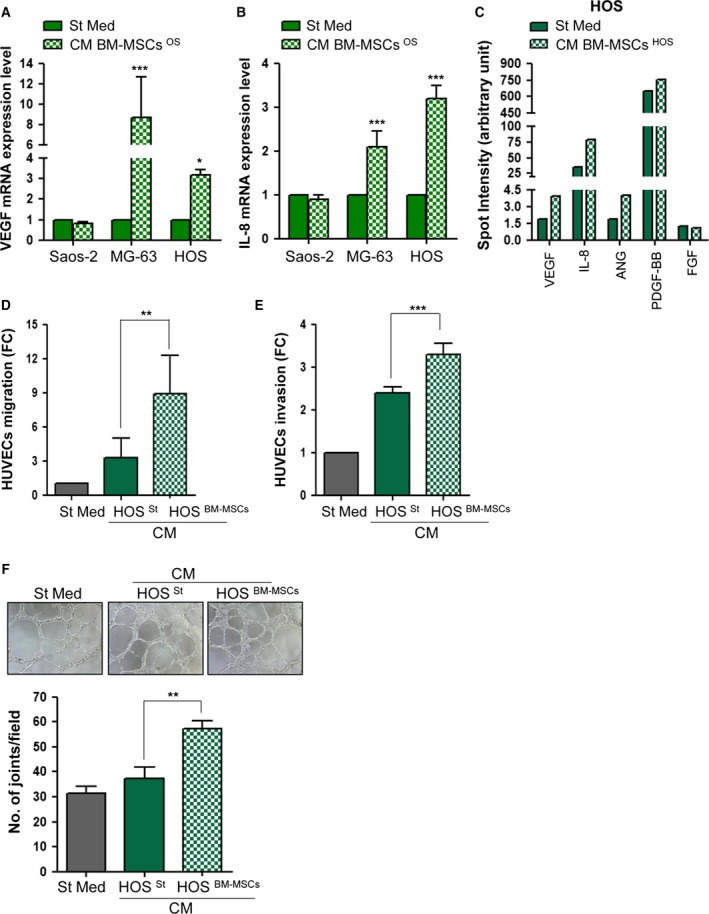
There is growing evidence to suggest that bone marrow-derived mesenchymal stem cells (BM-MSCs) are key players in tumour stroma. Here, we investigated the cross-talk between BM-MSCs and osteosarcoma (OS) cells. We revealed a strong tropism of BM-MSCs towards these tumour cells and identified monocyte chemoattractant protein (MCP)-1, growth-regulated oncogene (GRO)-α and transforming growth factor (TGF)-β1 as pivotal factors for BM-MSC chemotaxis. Once in contact with OS cells, BM-MSCs trans-differentiate into cancer-associated fibroblasts, further increasing MCP-1, GRO-α, interleukin (IL)-6 and IL-8 levels in the tumour microenvironment. These cytokines promote mesenchymal to amoeboid transition (MAT), driven by activation of the small GTPase RhoA, in OS cells, as illustrated by the in vitro assay and live imaging. The outcome is a significant increase of aggressiveness in OS cells in terms of motility, invasiveness and transendothelial migration. In keeping with their enhanced transendothelial migration abilities, OS cells stimulated by BM-MSCs also sustain migration, invasion and formation of the in vitro capillary network of endothelial cells. Thus, BM-MSC recruitment to the OS site and the consequent cytokine-induced MAT are crucial events in OS malignancy.
Keywords: bone marrow-derived mesenchymal stem cells; cytokines; osteosarcoma; transendothelial migration; tumour plasticity.
© 2018 The Authors. Published by FEBS Press and John Wiley & Sons Ltd.
Figures
Similar articles
-
Inhibition of AQP1 Hampers Osteosarcoma and Hepatocellular Carcinoma Progression Mediated by Bone Marrow-Derived Mesenchymal Stem Cells.Int J Mol Sci. 2016 Jul 11;17(7):1102. doi: 10.3390/ijms17071102. Int J Mol Sci. 2016. PMID: 27409610 Free PMC article.
-
Reversible secretome and signaling defects in diabetic mesenchymal stem cells from peripheral arterial disease patients.J Vasc Surg. 2018 Dec;68(6S):137S-151S.e2. doi: 10.1016/j.jvs.2018.05.223. Epub 2018 Aug 10. J Vasc Surg. 2018. PMID: 30104096 Free PMC article.
-
A novel antagonist of CXCR4 prevents bone marrow-derived mesenchymal stem cell-mediated osteosarcoma and hepatocellular carcinoma cell migration and invasion.Cancer Lett. 2016 Jan 1;370(1):100-7. doi: 10.1016/j.canlet.2015.10.018. Epub 2015 Oct 27. Cancer Lett. 2016. PMID: 26517945
-
Mesenchymal Stem Cells and Extracellular Vesicles in Osteosarcoma Pathogenesis and Therapy.Int J Mol Sci. 2021 Oct 13;22(20):11035. doi: 10.3390/ijms222011035. Int J Mol Sci. 2021. PMID: 34681692 Free PMC article. Review.
-
Mesenchymal stem cells: key players in cancer progression.Mol Cancer. 2017 Feb 1;16(1):31. doi: 10.1186/s12943-017-0597-8. Mol Cancer. 2017. PMID: 28148268 Free PMC article. Review.
Cited by
-
Deciphering Tumor Niches: Lessons From Solid and Hematological Malignancies.Front Immunol. 2021 Nov 10;12:766275. doi: 10.3389/fimmu.2021.766275. eCollection 2021. Front Immunol. 2021. PMID: 34858421 Free PMC article. Review.
-
Treatment with Cannabinoids as a Promising Approach for Impairing Fibroblast Activation and Prostate Cancer Progression.Int J Mol Sci. 2020 Jan 25;21(3):787. doi: 10.3390/ijms21030787. Int J Mol Sci. 2020. PMID: 31991773 Free PMC article.
-
Exosomal Transfer of LCP1 Promotes Osteosarcoma Cell Tumorigenesis and Metastasis by Activating the JAK2/STAT3 Signaling Pathway.Mol Ther Nucleic Acids. 2020 Sep 4;21:900-915. doi: 10.1016/j.omtn.2020.07.025. Epub 2020 Jul 23. Mol Ther Nucleic Acids. 2020. PMID: 32810692 Free PMC article.
-
Characteristics and regulation of mesenchymal stem cell plasticity by the microenvironment - specific factors involved in the regulation of MSC plasticity.Genes Dis. 2020 Oct 27;9(2):296-309. doi: 10.1016/j.gendis.2020.10.006. eCollection 2022 Mar. Genes Dis. 2020. PMID: 35224147 Free PMC article. Review.
-
Mesenchymal stem/stromal cell-based therapy: mechanism, systemic safety and biodistribution for precision clinical applications.J Biomed Sci. 2021 Apr 14;28(1):28. doi: 10.1186/s12929-021-00725-7. J Biomed Sci. 2021. PMID: 33849537 Free PMC article. Review.
References
-
- Attar‐Schneider O, Zismanov V, Drucker L and Gottfried M (2016) Secretome of human bone marrow mesenchymal stem cells: an emerging player in lung cancer progression and mechanisms of translation initiation. Tumour Biol 37, 4755–4765. - PubMed
-
- Barcellos‐de‐Souza P, Comito G, Pons‐Segura C, Taddei ML, Gori V, Becherucci V, Bambi F, Margheri F, Laurenzana A, Del Rosso M et al (2016) Mesenchymal stem cells are recruited and activated into carcinoma‐associated fibroblasts by prostate cancer microenvironment‐derived TGF‐β1. Stem Cells 34, 2536–2547. - PubMed
-
- Barcellos‐de‐Souza P, Gori V, Bambi F and Chiarugi P (2013) Tumor microenvironment: bone marrow‐mesenchymal stem cells as key players. Biochim Biophys Acta 1836, 321–335. - PubMed
-
- Belgiovine C, Frapolli R, Bonezzi K, Chiodi I, Favero F, Mello‐Grand M, Dei Tos AP, Giulotto E, Taraboletti G, D'Incalci M et al (2010) Reduced expression of the ROCK inhibitor Rnd3 is associated with increased invasiveness and metastatic potential in mesenchymal tumor cells. PLoS One 5, e14154. - PMC - PubMed
Publication types
MeSH terms
Substances
LinkOut - more resources
Full Text Sources
Other Literature Sources
Miscellaneous
