

Vital Signs: Trends in Emergency Department Visits for Suspected Opioid Overdoses - United States, July 2016-September 2017
- PMID: 29518069
- PMCID: PMC5844282
- DOI: 10.15585/mmwr.mm6709e1
Vital Signs: Trends in Emergency Department Visits for Suspected Opioid Overdoses - United States, July 2016-September 2017
Abstract
Introduction: From 2015 to 2016, opioid overdose deaths increased 27.7%, indicating a worsening of the opioid overdose epidemic and highlighting the importance of rapid data collection, analysis, and dissemination.
Methods: Emergency department (ED) syndromic and hospital billing data on opioid-involved overdoses during July 2016-September 2017 were examined. Temporal trends in opioid overdoses from 52 jurisdictions in 45 states were analyzed at the regional level and by demographic characteristics. To assess trends based on urban development, data from 16 states were analyzed by state and urbanization level.
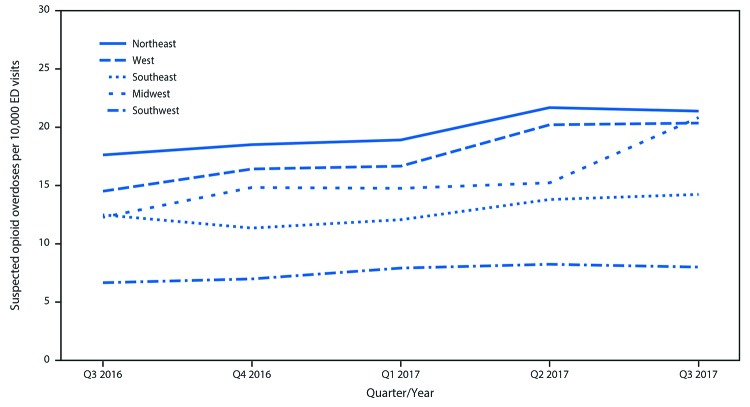
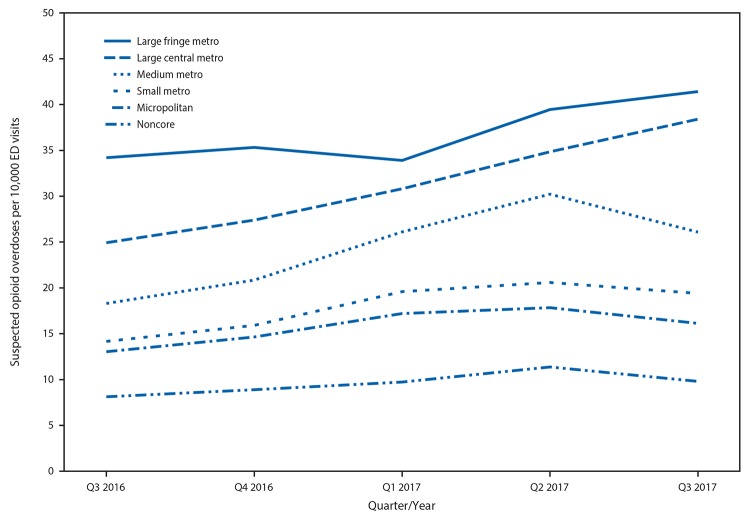
Results: From July 2016 through September 2017, a total of 142,557 ED visits (15.7 per 10,000 visits) from 52 jurisdictions in 45 states were suspected opioid-involved overdoses. This rate increased on average by 5.6% per quarter. Rates increased across demographic groups and all five U.S. regions, with largest increases in the Southwest, Midwest, and West (approximately 7%-11% per quarter). In 16 states, 119,198 ED visits (26.7 per 10,000 visits) were suspected opioid-involved overdoses. Ten states (Delaware, Illinois, Indiana, Maine, Missouri, Nevada, North Carolina, Ohio, Pennsylvania, and Wisconsin) experienced significant quarterly rate increases from third quarter 2016 to third quarter 2017, and in one state (Kentucky), rates decreased significantly. The highest rate increases occurred in large central metropolitan areas.
Conclusions and implications for public health practice: With continued increases in opioid overdoses, availability of timely data are important to inform actions taken by EDs and public health practitioners. Increases in opioid overdoses varied by region and urbanization level, indicating a need for localized responses. Educating ED physicians and staff members about appropriate services for immediate care and treatment and implementing a post-overdose protocol that includes naloxone provision and linking persons into treatment could assist EDs with preventing overdose.
Conflict of interest statement
No conflicts of interest were reported.
Figures
References
-
- Hedegaard H, Warner M, Miniño AM. Drug overdose deaths in the United States, 1999–2016. NCHS data brief, no 294. Hyattsville, MD: US Department of Health and Human Services, CDC, National Center for Health Statistics; 2017. https://www.cdc.gov/nchs/data/databriefs/db294.pdf
-
- CDC. Wide-ranging online data for epidemiologic research (WONDER). Atlanta, GA: US Department of Health and Human Services, CDC, National Center for Health Statistics; 2016. https://wonder.cdc.gov
-
- CDC. Annual surveillance report of drug-related risks and outcomes—United States, 2017. Atlanta, GA: US Department of Health and Human Services, CDC; 2017. https://www.cdc.gov/drugoverdose/pdf/pubs/2017-cdc-drug-surveillance-rep...
MeSH terms
Substances
LinkOut - more resources
Full Text Sources
Other Literature Sources
