. 2018 Apr 6;46(6):3019-3033.
doi: 10.1093/nar/gky163.

Genetic and epigenetic variation in 5S ribosomal RNA genes reveals genome dynamics in Arabidopsis thaliana

Affiliations

Genetic and epigenetic variation in 5S ribosomal RNA genes reveals genome dynamics in Arabidopsis thaliana

Lauriane Simon et al. Nucleic Acids Res. .

Abstract

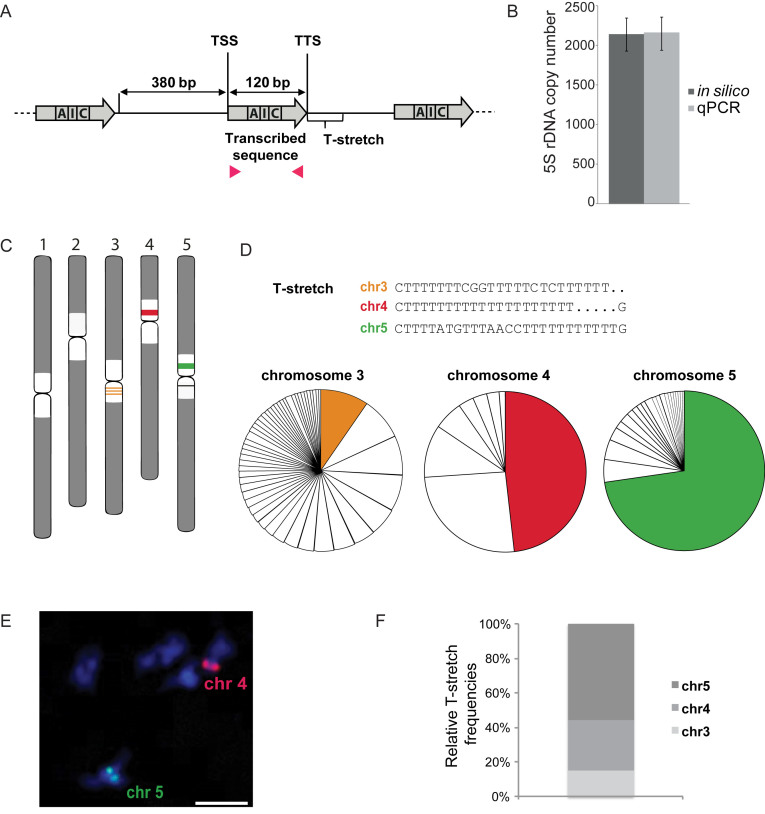
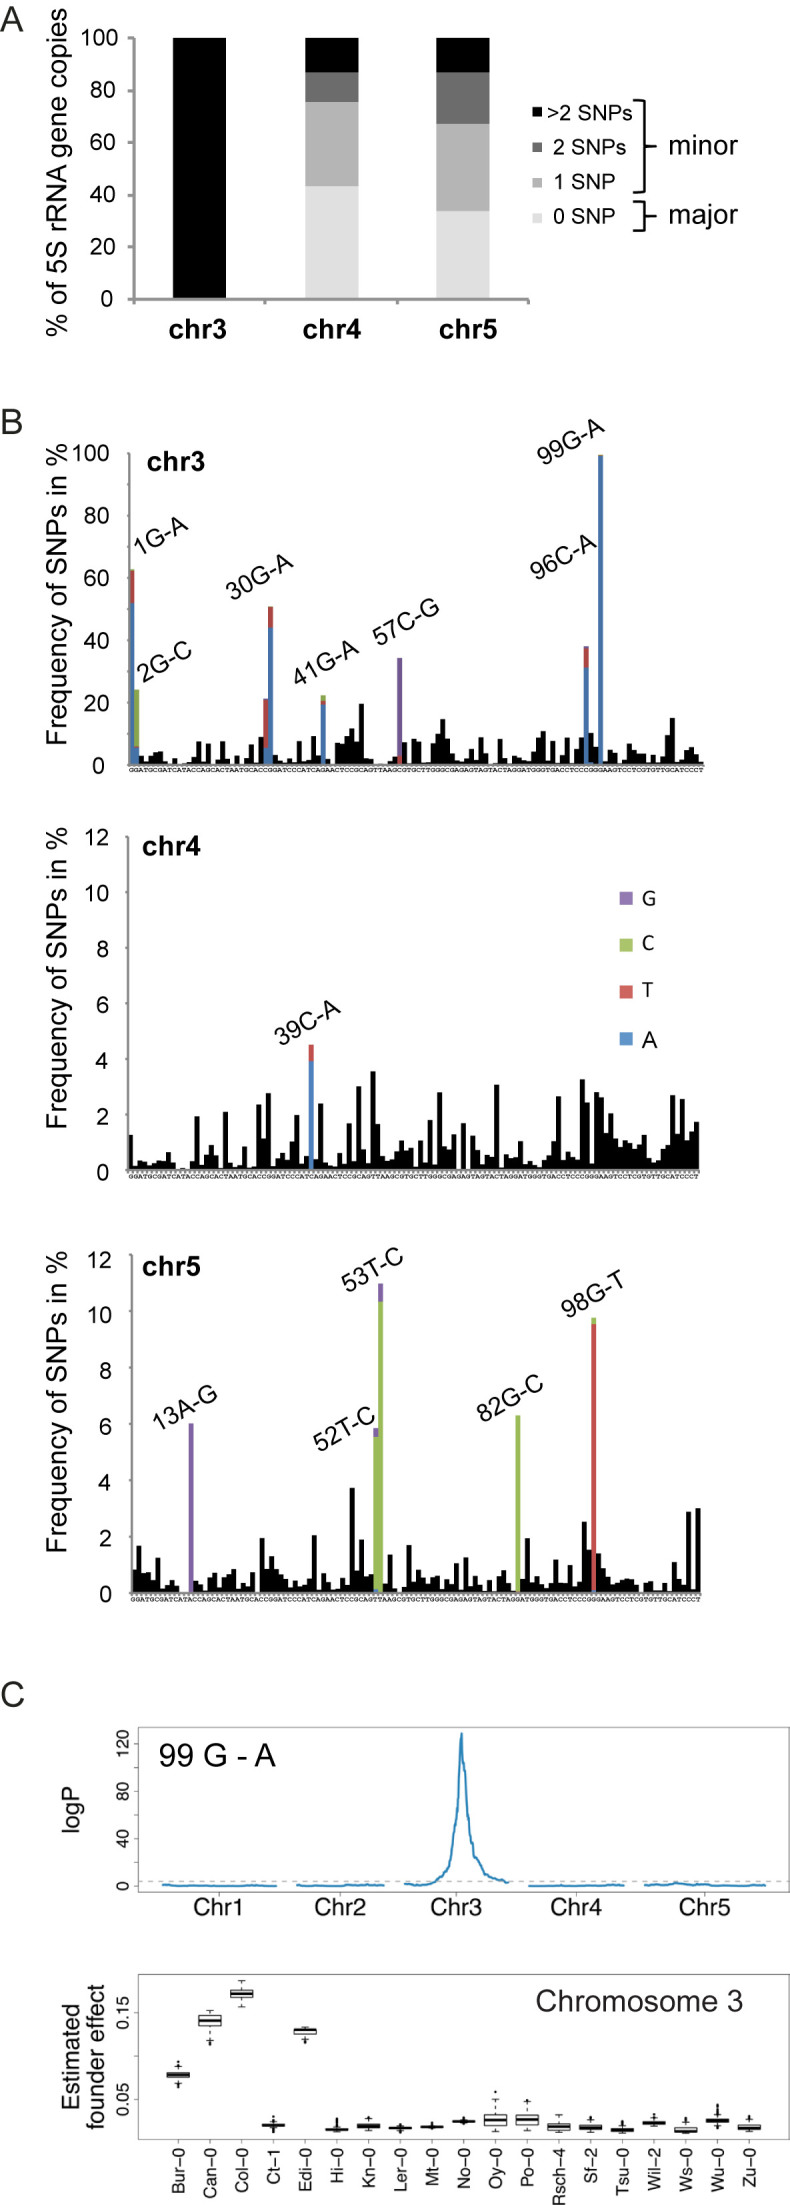
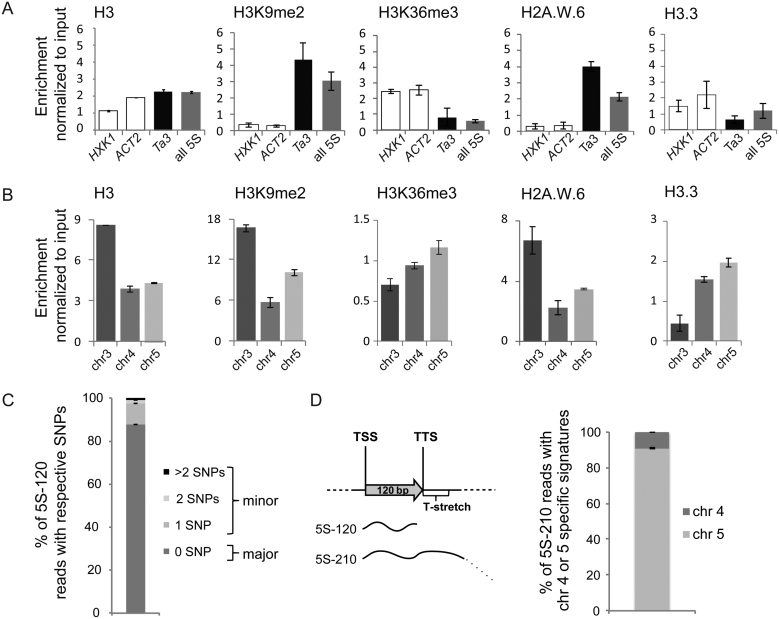
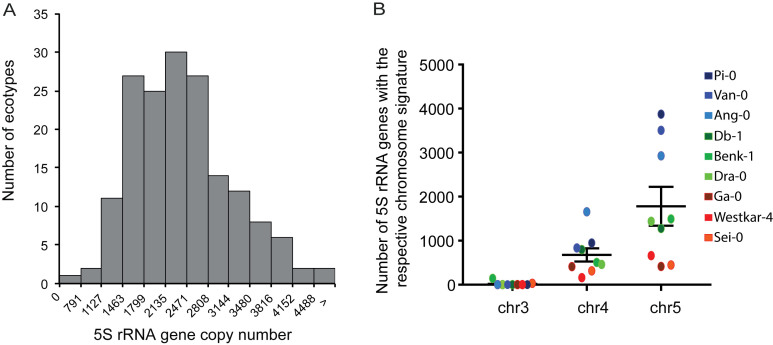
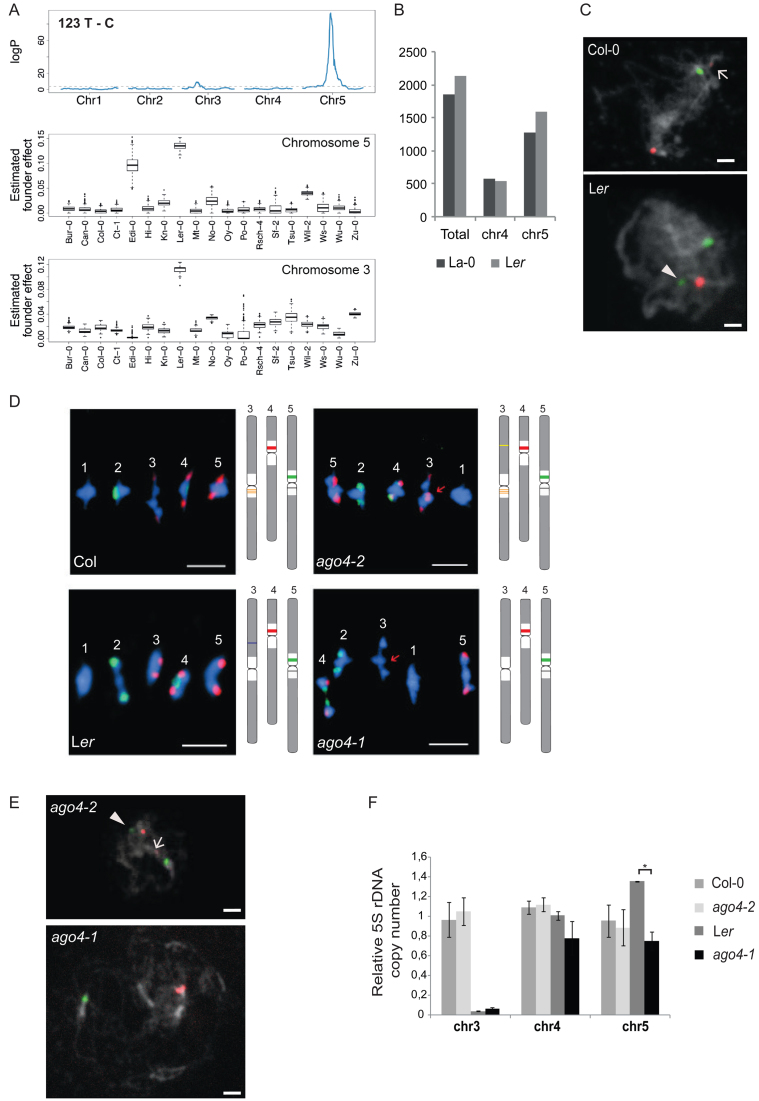
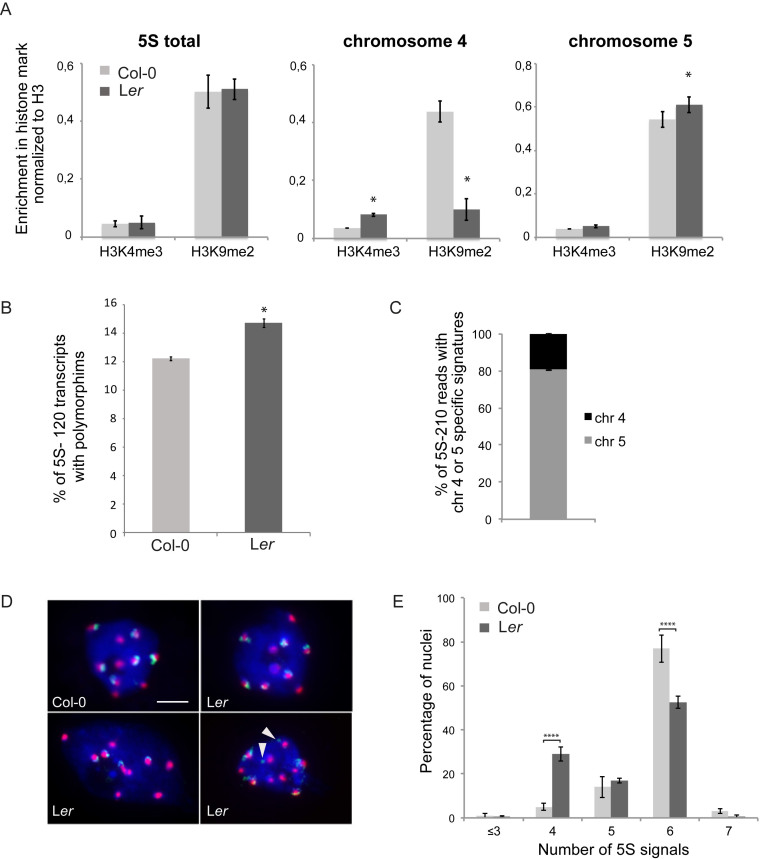
Organized in tandem repeat arrays in most eukaryotes and transcribed by RNA polymerase III, expression of 5S rRNA genes is under epigenetic control. To unveil mechanisms of transcriptional regulation, we obtained here in depth sequence information on 5S rRNA genes from the Arabidopsis thaliana genome and identified differential enrichment in epigenetic marks between the three 5S rDNA loci situated on chromosomes 3, 4 and 5. We reveal the chromosome 5 locus as the major source of an atypical, long 5S rRNA transcript characteristic of an open chromatin structure. 5S rRNA genes from this locus translocated in the Landsberg erecta ecotype as shown by linkage mapping and chromosome-specific FISH analysis. These variations in 5S rDNA locus organization cause changes in the spatial arrangement of chromosomes in the nucleus. Furthermore, 5S rRNA gene arrangements are highly dynamic with alterations in chromosomal positions through translocations in certain mutants of the RNA-directed DNA methylation pathway and important copy number variations among ecotypes. Finally, variations in 5S rRNA gene sequence, chromatin organization and transcripts indicate differential usage of 5S rDNA loci in distinct ecotypes. We suggest that both the usage of existing and new 5S rDNA loci resulting from translocations may impact neighboring chromatin organization.


Figures

Figure 1.
Figure 1.
Characterization of 5S rRNA genes and their genomic distribution in Col-0. (A) Scheme of 5S rRNA genes, comprising the 120 bp transcribed sequence (gray arrow) containing the internal promoter sequence (box A, I, C), the 380 bp long intergenic region and the Thymine-rich termination sequence (T-stretch). TSS and TTS indicate transcription start and termination sequence respectively. Positions of primers (pink arrowheads) used to determine 5S rRNA gene copy number by qPCR in (B) are indicated. (B) Mean 5S rRNA gene copy number in Col-0 determined by in silico analysis (dark gray) of the Mi-Seq dataset and two publicly available Hi-Seq datasets from the 1001 genome project and the mutation accumulation (MA) lines (28,34,35) after normalization to 18 single copy genes, and by qPCR (light grey). For the latter, mean values of 5S rDNA copy numbers from three biological replicates of Col-0 plants normalized to two single copy genes (HXK1, At4g29130 and UEV1C, At2g36060) are shown. Error bars correspond to SEM for three biological replicates. (C) Schematic representation of the predominant 5S rDNA loci in the pericentromeric regions (white) of chromosome 3 (orange), 4 (red) and 5 (green) in the Col-0 ecotype. (D) (Top) Major T-stretch signatures of each 5S rDNA locus in the Col-0 genome derived from the Mi-Seq data set. (Bottom) Relative frequencies of the predominant T-stretch signatures (colored fractions) and the T-stretches with single nucleotide polymorphisms (uncolored fractions) assigned to the three different loci by their characteristic nucleotide combinations (details in Supplemental Figure S1C) are shown in the pie chart. (E) DNA FISH on meiotic bivalents with LNA-DNA mixmer probes designed to specifically recognize the major T-stretch signatures (described in (D)) of chromosome 4 (red) and chromosome 5 (green), DNA is counterstained with DAPI (blue). The scale bar presents 10 μM. (F) Percentage of 5S rRNA gene copies carrying the T-stretch signatures characteristic of 5S rRNA genes from chromosomes 3, 4 and 5 in the Col-0 genome.
Figure 2.
Figure 2.
Chromosome specific single nucleotide polymorphisms. (A) Percentage of 5S rRNA gene copies assigned to chromosomes 3, 4 and 5 with 0 (major 5S rRNA genes), 1, 2 and more than 2 polymorphisms (minor 5S rRNA genes) in the transcribed sequence relative to the 5S rRNA consensus sequence. (B) Frequency of single nucleotide polymorphisms (SNPs) along the 120 bp transcribed sequence determined from the Mi-Seq NGS dataset. For the most frequent SNPs, the exchanged nucleotide at the given position is indicated in color. The consensus sequence is indicated below each graph. (C) (Top) Linkage mapping of the abundance of the G to A single nucleotide polymorphism at position 99 estimated by NGS in 393 individuals of the MAGIC population. (Bottom) Boxplot of the estimated founder ecotype effect by multiple imputation using R/happy at the major quantitative trait locus from the top panel in chromosome 3.
Figure 3.
Figure 3.
Epigenetic marks and expression of 5S rRNA genes. (A and B) Nucleosome occupancy estimated by H3-ChIP and enrichment in histone post-translational modifications (H3K9me2 and H3K36me3) as well as histone variants H2A.W.6 and H3.3 at (A) the transcriptionally active genes HEXOKINASE1 (HXK1, At4g29130) and ACTIN2 (ACT2, At3g18780), the retrotransposon Ta3 and the 120 bp transcribed sequence of a 5S rRNA gene or (B) at the 3 different 5S rDNA loci. The y-axis corresponds to the number of reads in the ChIP-seq datasets normalized to the number of reads in input datasets. (C) Mean percentage of 5S rRNA transcripts with 0 (major 5S rRNA genes) or 1, 2 and more than 2 single nucleotide polymorphisms (minor 5S rRNA genes) determined in RNA-seq datasets from 3 biological replicates of 2-day-old Col-0 seedlings. (D) Left: Schematic representation of the 5S-120 and the 5S-210 transcripts. Right: Mean percentage of 5S-210 reads with the chromosome 4 or chromosome 5 specific T-stretch signatures determined in RNA-seq datasets prepared from 2-day old seedlings in three biological replicates. For all panels the error bar corresponds to SEM.
Figure 4.
Figure 4.
5S rRNA gene copy number variation in different Arabidopsis thaliana ecotypes. (A) Total 5S rRNA gene copy number distribution in different Arabidopsis ecotypes as determined by in silico analysis of NGS datasets with 50 bp-long reads (see Materials and Methods). (B) Number of 5S rRNA gene copies with the respective T-stretches of chromosome 3, 4 and 5 in 9 different ecotypes: 3 with few (∼800 copies, red, Ga-0, Westkar-4, Sei-0), 3 with medium (∼2,000 copies, green, Benk-1, Dra-0, Db-1) and 3 with high (∼4500 copies, blue, Ang-0, Pi-0, Van-0) total 5S rDNA copy numbers.
Figure 5.
Figure 5.
Variations of 5S rDNA copy number and genomic position. (A) (Top) Linkage mapping of the abundance of the T to C single nucleotide polymorphism at position 123 estimated by NGS in 393 individuals of the MAGIC population. (Bottom) Boxplots of the estimated founder ecotype effect by multiple imputation using R/happy at the major quantitative trait locus from the top panel in chromosome 5 and chromosome 3. (B) Number of total 5S rRNA genes and genes with chromosome 4 or 5 specific T-stretch signatures as determined by in silico analysis of La-0 and Ler Illumina sequencing datasets. (C) FISH using LNA-DNA mixmer probes specific for chromosome 4 (red) and chromosome 5 (green) on pachytene spreads of Col-0 and Ler. DNA is counterstained by DAPI (in grey). Arrow indicates weak cross hybridization of the chromosome 4 probe to the 5S rRNA gene copies from chromosome 3. Arrowhead indicates the 5S locus on the long arm of bivalent 3 in Ler. The scale bar presents 5 μM. (D) FISH with 5S (red) and 45S (green) rDNA probes on metaphase I bivalents of Col-0, Ler and the ago4 mutant alleles, ago4-2 (Col-0 background) and ago4-1 (Ler background). The scale bar presents 5 μM. (E) FISH on ago4-2 and ago4-1 pachytene spreads with LNA-DNA mixmer probes as in (C). Arrow indicates weak cross hybridization of the chromosome 4 probe with the 5S rRNA gene copies of chromosome 3 in ago4-2. Arrowhead designates the additional locus (green) on the long arm of bivalent 3 in ago4-2. The locus on the long arm of bivalent 3 in Ler is lost in ago4-1. The scale bar presents 5 μM. (F) Relative 5S rDNA copy number for each locus in Col-0, ago4-2, Ler and ago4-1 determined by qPCR in three biological replicates. Copy numbers in Col-0 are set to 1 for each chromosome. *P < 0.05, ANOVA.
Figure 6.
Figure 6.
Differences in nuclear organization and epigenetic marks at 5S rDNA loci in Col-0 and Ler. (A) Differential enrichment in H3K4me3 and H3K9me2 normalized to H3 levels in Col-0 and Ler plants at all 5S rRNA genes (left) and specifically at copies carrying the chromosome 4 (middle) or chromosome 5-specific signature (right). Error bars correspond to SEM from three biological replicates. *P < 0.05, Wilcoxon test. (B) Percentage of 5S-120 reads with polymorphisms in RNA-seq datasets of three biological replicates of Col-0 and Ler 2-day old plantlets. *P < 0.05, t-test. (C) Percentage of 5S-210 reads with chromosome 4 or chromosome 5 specific T-stretches determined from an RNA-seq dataset comprising three biological replicates of 2-day old Ler plantlets. (D) Representative nuclei of 10-day-old cotyledons stained by FISH with 5S rDNA probes (green) showing 5S rDNA loci associated or not with a chromocenter revealed by a probe against the centromeric 180 bp repeats (red). In Col-0, all 5S signals are associated with chromocenters. Representative nuclei for Ler showing six or four 5S rDNA signals associated with chromocenters or six 5S rDNA signals out of which two are located distant from chromocenters (indicated by arrowheads). (E) Percentage of cotyledon interphase nuclei presenting 3, 4, 5, 6 or 7 5S rDNA signals per nucleus as revealed by a FISH probe detecting all 5S rRNA genes (300 nuclei per genotype, n = 3 experiments; Error bars correspond to SEM). ****P < 0.0001, ANOVA.

References

    1. Murata M., Heslop-Harrison J.S., Motoyoshi F.. Physical mapping of the 5S ribosomal RNA genes in Arabidopsis thaliana by multi-color fluorescence in situ hybridization with cosmid clones. Plant J. 1997; 12:31–37. - PubMed
    1. Fransz P., Armstrong S., Alonso-Blanco C., Fischer T.C., Torres-Ruiz R.A., Jones G.. Cytogenetics for the model system Arabidopsis thaliana. Plant J. 1998; 13:867–876. - PubMed
    1. Tutois S., Cloix C., Cuvillier C., Espagnol M.C., Lafleuriel J., Picard G., Tourmente S.. Structural analysis and physical mapping of a pericentromeric region of chromosome 5 of Arabidopsis thaliana. Chromosome Res. 1999; 7:143–156. - PubMed
    1. Arabidopsis Genome Initiative Analysis of the genome sequence of the flowering plant Arabidopsis thaliana. Nature. 2000; 408:796–815. - PubMed
    1. Brown D.D., Wensink P.C., Jordan E.. A comparison of the ribosomal DNA’s of Xenopus laevis and Xenopus mulleri: the evolution of tandem genes. J. Mol. Biol. 1972; 63:57–73. - PubMed

Publication types

LinkOut - more resources