. 2018 Aug;142(2):485-496.e16.
doi: 10.1016/j.jaci.2018.01.043. Epub 2018 Mar 5.

Mast cell activation test in the diagnosis of allergic disease and anaphylaxis

Affiliations

Mast cell activation test in the diagnosis of allergic disease and anaphylaxis

Rajia Bahri et al. J Allergy Clin Immunol. 2018 Aug.

Abstract

Background: Food allergy is an increasing public health issue and the most common cause of life-threatening anaphylactic reactions. Conventional allergy tests assess for the presence of allergen-specific IgE, significantly overestimating the rate of true clinical allergy and resulting in overdiagnosis and adverse effect on health-related quality of life.

Objective: To undertake initial validation and assessment of a novel diagnostic tool, we used the mast cell activation test (MAT).

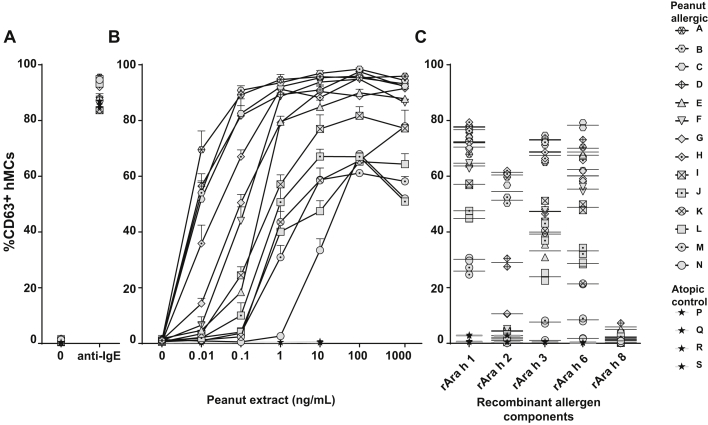
Methods: Primary human blood-derived mast cells (MCs) were generated from peripheral blood precursors, sensitized with patients' sera, and then incubated with allergen. MC degranulation was assessed by means of flow cytometry and mediator release. We compared the diagnostic performance of MATs with that of existing diagnostic tools to assess in a cohort of peanut-sensitized subjects undergoing double-blind, placebo-controlled challenge.

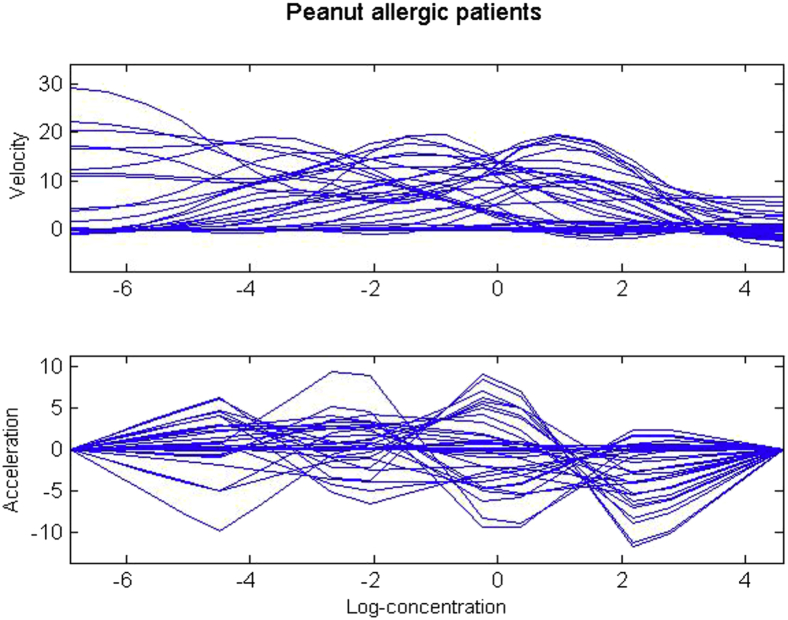
Results: Human blood-derived MCs sensitized with sera from patients with peanut, grass pollen, and Hymenoptera (wasp venom) allergy demonstrated allergen-specific and dose-dependent degranulation, as determined based on both expression of surface activation markers (CD63 and CD107a) and functional assays (prostaglandin D2 and β-hexosaminidase release). In this cohort of peanut-sensitized subjects, the MAT was found to have superior discrimination performance compared with other testing modalities, including component-resolved diagnostics and basophil activation tests. Using functional principle component analysis, we identified 5 clusters or patterns of reactivity in the resulting dose-response curves, which at preliminary analysis corresponded to the reaction phenotypes seen at challenge.

Conclusion: The MAT is a robust tool that can confer superior diagnostic performance compared with existing allergy diagnostics and might be useful to explore differences in effector cell function between basophils and MCs during allergic reactions.

Keywords: Anaphylaxis; basophil activation test; diagnosis; food allergy; mast cell activation test; mast cells; peanut allergy.


Figures

None
Graphical abstract
Fig 1
Fig 1
Peanut- and grass pollen–induced degranulation of hMCs sensitized with sera of patients with peanut and grass pollen allergy (sensitized to both peanut and pollen, n = 5; sensitized to peanut only, n = 1; sensitized to grass pollen but not peanut, n = 1). hMCs were sensitized overnight with sera from patients with peanut allergy, patients with grass pollen allergy, or both; washed; and either left untreated or exposed for 1 hour to anti-IgE (10 μg/mL) as a positive control (left), different concentrations of peanut extract (middle), or grass pollen extract (right). A and B, hMC degranulation was measured based on CD63 (Fig 1, A) and CD107a (Fig 1, B) surface staining and analyzed by using flow cytometry. C, β-Hexosaminidase levels were measured in cell pellets, as well as in supernatants. Percentage β-hexosaminidase release is shown. D, PGD2 levels were measured in supernatants. The assay was performed in duplicates or triplicates with pooled hMCs from at least 3 different healthy donors. Symbols indicate individual patients, and values indicate means ± SDs.
Fig 2
Fig 2
hMC degranulation using hMCs from patients with peanut allergy. hMCs were sensitized overnight with sera of patients with peanut allergy or control sera (volume ratio, 1:10), washed, and either left untreated or exposed for 1 hour to anti-IgE (10 μg/mL; A), different concentrations of peanut extract (as indicated; B), or recombinant peanut allergens (rAra h 1, rAra h 2, rAra h 3, rAra h 6, and rAra h 8 [10 nmol/L]; C). hMC degranulation was measured by using CD63 surface staining and analyzed with flow cytometry. Fig 2, A and B, show one representative experiment of 2, and the assay was performed in duplicates or triplicates with pooled hMCs from at least 3 different healthy donors. Values indicate means ± SDs, and symbols show individual subjects. In Fig 2, C, the assay was performed in duplicates; lines indicate the mean of replicates, and symbols show each subject.
Fig 3
Fig 3
Correlation of serum Arachis hypogaea IgE measurements and hMC degranulation analysis in the panel of 14 patients with peanut allergy. Correlation of serum specific peanut IgE levels versus peanut extract–induced hMC degranulation (A), serum specific peanut IgE levels versus MC allergen CD-sens (B), and serum IgE levels specific for rAra h 1, rAra h 3, rAra h 2, and rAra h 6 versus hMC degranulation induced by the respective recombinant peanut allergen (C) are shown. IgE levels are expressed as natural logarithm (LN). Measurements noted as less than the limit of detection (<0.4) in Table E1 were given a value of half the limit of detection (0.2). CD-sens values were calculated as described previously by Johansson et al, with higher values implying greater sensitivity. Symbols indicate mean values for each investigated serum from patients with peanut allergy. Degranulation was measured based on surface expression of CD63 on hMCs by flow cytometry. Ara h IgE levels are expressed in natural logarithm (LN). Measurements noted as less than the limit of detection (<0.4) in Table E1 were given a value of half the limit of detection (0.2). Symbols indicate mean values for each investigated serum from patients with peanut allergy.
Fig 4
Fig 4
ROC curves comparing discrimination performance of the MAT with that of other diagnostic modalities in 42 peanut-sensitized subjects, of whom 30 reacted to less than 4.4 g of peanut protein with objective symptoms (A), and a subgroup of peanut-sensitized subjects with equivocal results for conventional allergy tests (B). In both scenarios the MAT had the most favorable diagnostic accuracy compared with other tests in identifying those with clinical reactivity to peanut.
Fig 5
Fig 5
FDA of the MAT. A, Raw data and smoothed curves for peanut-sensitized subjects (n = 42). B, Principal components analysis (PCA) of pattern response measured by using the MAT assay. Lines show the effect of adding (green line) or subtracting (red line) 2 SDs from the mean response curve (blue line). C, Distinct clusters of allergic responses to peanut obtained through k-means on FPC scores.
Fig 6
Fig 6
K-means cluster on sIgE data in patients with peanut allergy. A, IgE clusters on peanut-specific IgE versus the first FPC. B, MAT clusters on peanut-specific IgE versus the first FPC.
Fig E1
Fig E1
Characterization of hMCs. A, After 8 to 10 weeks of culture, hMC maturation was controlled by measuring the size granularity, (side scatter [SSC]–H/forward scatter [FSC]–H) and CD117 surface expression by using flow cytometry. Control shows fluorescence minus one values for CD117 control staining. B, Serum IgE binding. hMCs were sensitized overnight with human serum (1:10 dilution) or not for control hMCs and washed. IgE fixed on the surfaces of hMCs was detected by using flow cytometry. Numbers represent percentage cells in the gate. C and D, Immunofluorescence for tryptase (Fig E1, C) and chymase (Fig E1, D). A spectrum of tryptase and chymase expression is seen within the MC population. E and F, MC metachromatic granules were identified by using May-Grünwald Giemsa (Fig E1, E) or toluidine blue (Fig E1, F) staining.
Fig E2
Fig E2
Correlation of surface expression and mediators release measurement. hMCs were sensitized overnight with serum from patients with peanut allergy, patients with grass pollen allergy, or both (volume ratio, 1:10); washed; and either left untreated or exposed for 1 hour to different concentrations of peanut or grass pollen extract or anti-IgE (10 μg/mL) as a positive control. hMC degranulation was measured by CD63 and CD107a surface staining and analyzed by using flow cytometry. β-Hexosaminidase levels were measured in cell pellets, as well as in supernatants, and expressed as percentage β-hexosaminidase release. PGD2 levels were measured in supernatants. The assay was performed in duplicates or triplicates with pooled hMCs from at least 3 different healthy donors. Correlations were calculated by using Spearman R (R2) values (A) with both absolute values and percentages of readout induced by anti-IgE summarized in B.
Fig E3
Fig E3
hMCs are more susceptible to IgE-mediated degranulation than LAD2 cells. hMCs were sensitized overnight with 1 μg/mL human IgE washed and either left untreated (0 μg/mL) or exposed for 1 hour to anti-IgE (10 μg/mL). A and B, hMC degranulation was measured based on CD63 (Fig E3, A) and CD107a (Fig E3, B) surface staining and analyzed by using flow cytometry. C, β-Hexosaminidase levels were measured in cell pellets, as well as in supernatants. Percentage of β-hexosaminidase release is shown. D, PGD2 levels were measured in supernatants. The assay was performed with pooled hMCs from at least 3 different healthy donors.
Fig E4
Fig E4
hMC degranulation in patients with a clinical history of systemic reaction to wasp (n = 21) or honeybee (n = 6) venom. hMCs were sensitized overnight with patients' sera, washed, and then incubated with varying concentrations of wasp venom extract (as indicated) for 1 hour. hMC degranulation was measured based on CD63 surface expression by using flow cytometry.
Fig E5
Fig E5
hMC degranulation in peanut-sensitized patients from the validation cohort (n = 42). A, hMCs were sensitized overnight with patients' sera, washed, and then incubated with varying concentrations of peanut extract (as indicated) or anti-IgE (10 μg/mL) for 1 hour. hMC degranulation was measured based on CD63 surface expression by using flow cytometry. B, Corresponding ROC curve. AUC, Area under curve; PN, peanut.
Fig E6
Fig E6
First and second derivatives of response curves for peanut-sensitized patients.
Fig E7
Fig E7
Scores of patients on the first 2 principal components of the allergic response.
Fig E8
Fig E8
Evaluation measures distribution for the choice of the optimal number of cluster obtained with the package NbClust.
Fig E9
Fig E9
Functional t test for differences between responses in the 5 clusters.
Fig E10
Fig E10
Velocity and acceleration in the distinct response patterns in the clusters.
Fig E11
Fig E11
K-means clustering on sIgE data in patients with peanut allergy. A, MAT responses on the first 2 principle components, assigned to the 2 IgE clusters detected. B, IgE clusters on MAT response curves to peanut.

Comment in

  • Reply.
    Bulfone-Paus S, Bahri R, Shamji MH, Custovic A, Turner PJ. Bulfone-Paus S, et al. J Allergy Clin Immunol. 2018 Sep;142(3):1019. doi: 10.1016/j.jaci.2018.06.021. Epub 2018 Jul 25. J Allergy Clin Immunol. 2018. PMID: 30055830 No abstract available.
  • Mast cell activation test versus basophil activation test and related competing issues.
    Chirumbolo S, Bjørklund G, Vella A. Chirumbolo S, et al. J Allergy Clin Immunol. 2018 Sep;142(3):1018-1019. doi: 10.1016/j.jaci.2018.06.020. Epub 2018 Jul 25. J Allergy Clin Immunol. 2018. PMID: 30055831 No abstract available.

References

    1. Nwaru B.I., Hickstein L., Panesar S.S., Roberts G., Muraro A., Sheikh A. Prevalence of common food allergies in Europe: a systematic review and meta-analysis. Allergy. 2014;69:992–1007. - PubMed
    1. Turner P.J., Gowland M.H., Sharma V., Ierodiakonou D., Harper N., Garcez T. Increase in anaphylaxis-related hospitalizations but no increase in fatalities: an analysis of United Kingdom national anaphylaxis data, 1992-2012. J Allergy Clin Immunol. 2015;135:956–963. - PMC - PubMed
    1. Turner P.J., Boyle R.J. Food allergy in children: what is new? Curr Opin Clin Nutr Metab Care. 2014;17:285–293. - PubMed
    1. Sampson H.A., Gerth van Wijk R., Bindslev-Jensen C., Sicherer S., Teuber S.S., Burks A.W. Standardizing double-blind, placebo-controlled oral food challenges: American Academy of Allergy, Asthma & Immunology-European Academy of Allergy and Clinical Immunology PRACTALL consensus report. J Allergy Clin Immunol. 2012;130:1260–1274. - PubMed
    1. Statement by the American Academy of Allergy, Asthma & Immunology, American College of Allergy, Asthma & Immunology and the Canadian Society of Allergy and Clinical Immunology relating to fatality during food challenge test. http://csaci.ca/wp-content/uploads/2017/08/Statement-to-public-regarding... Available at:

Publication types