. 2018 Mar 7;19(3):759.
doi: 10.3390/ijms19030759.

Quantitative Proteomic Approach Targeted to Fibrinogen β Chain in Tissue Gastric Carcinoma

Affiliations

Quantitative Proteomic Approach Targeted to Fibrinogen β Chain in Tissue Gastric Carcinoma

Ombretta Repetto et al. Int J Mol Sci. .

Abstract

Elevated plasma fibrinogen levels and tumor progression in patients with gastric cancer (GC) have been largely reported. However, distinct fibrinogen chains and domains have different effects on coagulation, inflammation, and angiogenesis. The aim of this study was to characterize fibrinogen β chain (FGB) in GC tissues. Retrospectively we analyzed the data of matched pairs of normal (N) and malignant tissues (T) of 28 consecutive patients with GC at diagnosis by combining one- and two-dimensional electrophoresis (1DE and 2DE) with immunoblotting and mass spectrometry together with two-dimensional difference in gel electrophoresis (2D-DIGE). 1DE showed bands of the intact FGB at 50 kDa and the cleaved forms containing the fragment D at ~37-40 kDa, which corresponded to 19 spots in 2DE. In particular, spot 402 at ~50 kDa and spots 526 and 548 at ~37 kDa were of interest by showing an increased expression in tumor tissues. A higher content of spot 402 was associated with stomach antrum, while spots 526 and 548 amounts correlated with corpus and high platelet count (>208 × 10⁸/L). The quantification of FGB and cleaved products may help to further characterize the interconnections between GC and platelet/coagulation pathways.

Keywords: DIGE; FGB; biomarker; coagulation; comparative proteomics; fibrinogen β chain; gastric cancer; platelets.


Conflict of interest statement

The authors declare no conflict of interest. The founding sponsors had no role in the design of the study; in the collection, analyses, or interpretation of data; in the writing of the manuscript, and in the decision to publish the results.

Figures

Figure A1
Figure A1
A schematic illustration of the proteomic workflow adopted. Proteins have been extracted from both gastric tumor-affected (T) and normal (N) biopsies of 28 patients. After extraction (1), some protein pools were separated by one-dimensional electrophoresis (1DE) (2), the presence of fibrinogen β chain (FGB) was investigated by western blotting (WB) (3), and the presence of FGB in the cross-reacting 1DE bands was validated by mass spectrometry (4,5). Some protein extracts resulted to contain high levels of FGB were separated by two-dimensional electrophoresis (2DE) (6), and the presence of FGB was successfully individuated to some spots after 2DE immunoblotting on gels (7, 8). For comparative analyses by DIGE, all the protein extracts were labelled (9), separated by isoelectric focusing (IEF) and molecular weight (2DE) (10), images were acquired (11) and targeted image analyses were performed on the only spots of interest containing FGB (12,13). Details are explained in Methods section.
Figure A2
Figure A2
The complete amino acid sequence of fibrinogen β chain (FGB) immature form (http://www.uniprot.org/uniprot/P02675), where the peptides identified by mass spectrometry in gel portions of Figure 1c are evidenced in bold (a). The FGB immature form of 56 kDa is processed into a mature form of ~52 kDa after signal peptide removal. During the conversion of fibrinogen into fibrin, thrombin cleaves fibrinopeptide B from β chains and releases FGB forms of ~51 kDa, which can be further cleaved by plasmin into fibrinogen fragments D of ~37 kDa to break down fibrin clots. These processes are summarized in (b). All the possible post-translational modifications (phosphorylation, acetylation and N-glycosilation) are shown as interactive sequence in (c), after interrogation of P02675 as substrate with iPTMnet bioinformatic resource (http://proteininformationresource.org/iPTMnet).
Figure 1
Figure 1
One-dimensional electrophoresis (1DE) and immunoblotting of fibrinogen ß chain (FGB) in normal (N) versus tumor-affected (T) gastric tissues belonging to patients divided according to their tumor stage (Group I: T1–T2; Group II: T3–T4). (a) Image of the 1DE stain-free gel fluorescence acquired upon excitation with the Chemidoc system before its transfer to nitrocellulose membrane. Numbers refer to the relative quantity of the band calculated with the Image LabTM software (R, reference band for which quantity is 1); (b) Chemiluminescence signals of proteins cross-reacting with the anti-FGB antibody. Circles and asterisks evidence a band at ~40 and 37 kDa, respectively, while the arrow shows a band at <50 kDa; (c) From the blue-stained 1DE gel in (a), an area of ~37–60 kDa was excised, and gel portions numbered 1 to 8 submitted to analysis by mass spectrometry for protein identification. Asterisks confirmed the presence of FGB product(s) in the gel portions.
Figure 2
Figure 2
Two-Dimensional Electrophoresis (2DE) and immunoblotting of FGB from proteins pooled from normal and tumor-affected gastric tissues. (a) After labelling with cyanines, proteins were resolved by isoelectrofocusing (IEF) over the pI 3–10, followed by 8–16% gradient Sodium Dodecyl Sulfate—PolyAcrylamide Gel Electrophoresis (SDS-PAGE). The gel image was acquired and added to a Decyder project before its transfer to a nitrocellulose membrane. The frame corresponds to the gel area shown in (b); (b) Visualization of spots cross-reacting with the anti-FGB antibody ([1F9], GeneTex) in the gel area corresponding to the rectangle in (a). The 2DE protein map showed FGB cross-reacting spots in the same molecular weights (MWs) as those evidenced by immunoblotting on 1DE gel, here visualized on the left (for more details, see Figure 1b). The frames corresponds to the gel area containing the FGB cross-reacting spots shown in (c), on which our image analysis focussed; (c) FGB cross-reactive spots were identified, numbered, and analyzed using the Decyder software for quantitative analysis and comparison, as described in Methods section.
Figure 3
Figure 3
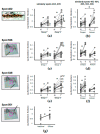
Graphical visualization of abundance distribution of spots 402, 526, 548 and 501 in tumor non-affected (N) and tumor-affected (T) gastric tissue biopsies, according to their tumor stage (Group I: T1–T2; Group II: T3–T4), anatomical site (corpus, antrum) or histological type (intestinal, diffuse). (a) Abundance of Spot 402, similarly to spots 404, 405, 526 (c) and 548 (d), increased in T versus N tissues both in Group I and II, and more even in T-tissue of Group II. (b) Spot 402 abundance, similarly to spots 403, 404, 405, 393 and 396 was particularly higher in T than N in the antrum location, while spots 526 and 548, showed the highest abundance associated with corpus location. (e) Spot 548, similarly to spots 402 (a) and 526 (c), increased in content in T versus N tissues both in Group I and II, its abundance being higher in T-tissues of Group II. (f) Spot 548 content was significantly higher in T versus N tissues in corpus. (g) Spot 501 content was higher in diffuse than intestinal histological type. In each graph, a single circle represents the Log standardized abundance of the spot calculated for a single gel/patient. Asterisks indicate a statistically significant difference at paired t-test p < 0.05 or between T tissues of different groups (b,g) at Student’s t-test p < 0.05. Dotted lines combine N and T samples belonging to the same patient and co-migrated within the same gel, while arrows indicate a detail of the Decyder tridimensional 3D view of the graphically visualized spots.
Figure 4
Figure 4
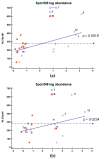
Graphical visualization of the correlation between the activated partial thromboplastin time (APTT) and the log abundance of spot 548 in normal (N, ■) together with malignant (T, ○) tissues of patients belonging to T stage Group II (T3–T4). The broken line indicates the low value considered to be normal. Regression line values were: intercept 28.3 (SE 0.46) and slope −0.55 (SE 0.26).
Figure 5
Figure 5
Graphical visualization of the correlation between platelet counts (PLT) and the log abundance of spot 526 in malignant (T, ¡) tissues (a), and spots 548 in normal (N, ■) together with malignant (T, ○) tissues of patients (b) belonging to Group II (T3–T4). The optimum PLT cut-off of 280 × 109/L(mean ± 70 × 109/L), calculated in the cohort of healthy individuals, is indicated with a broken line. Regression line values were: intercept 260.5 (SE 20.6) and slope 45.0 (SE 12.35) (a); intercept 258.4 (SE 15.45) and slope 20.9 (SE 8.85) (b).

Similar articles

Cited by

References

    1. Ferlay J., Soerjomataram I., Dikshit R., Eser S., Mathers C., Rebelo M., Parkin D.M., Forman D., Bray F. Cancer incidence and mortality worldwide: Sources, methods and major patterns in GLOBOCAN 2012. Int. J. Cancer. 2015;136:E359–E386. doi: 10.1002/ijc.29210. - DOI - PubMed
    1. Fakhri B., Lim K.H. Molecular landscape and sub-classification of gastrointestinal cancers: A review of literature. J. Gastrointest. Oncol. 2017;8:379–386. doi: 10.21037/jgo.2016.11.01. - DOI - PMC - PubMed
    1. Gigek C.O., Calcagno D.Q., Rasmussen L.T., Santos L.C., Leal M.F., Wisnieski F., Burbano R.R., Lourenço L.G., Lopes-Filho G.J., Smith M.A.C. Genetic variants in gastric cancer: Risks and clinical implications. Exp. Mol. Pathol. 2017;103:101–111. doi: 10.1016/j.yexmp.2017.07.004. - DOI - PubMed
    1. Nishikawa J., Iizasa H., Yoshiyama H., Nakamura M., Saito M., Sasaki S., Shimokuri K., Yanagihara M., Sakai K., Suehiro Y., et al. The role of epigenetic regulation in Epstein-Barr virus-Associated gastric cancer. Int. J. Mol. Sci. 2017;18:E1606. doi: 10.3390/ijms18081606. - DOI - PMC - PubMed
    1. Patel T.N., Roy S., Ravi R. Gastric cancer and related epigenetic alterations. Ecancermedicalscience. 2017;11:714. doi: 10.3332/ecancer.2017.714. - DOI - PMC - PubMed

MeSH terms

LinkOut - more resources