. 2018 Mar 7;18(3):806.
doi: 10.3390/s18030806.

Automatic Non-Destructive Growth Measurement of Leafy Vegetables Based on Kinect

Affiliations

Automatic Non-Destructive Growth Measurement of Leafy Vegetables Based on Kinect

Yang Hu et al. Sensors (Basel). .

Abstract

Non-destructive plant growth measurement is essential for plant growth and health research. As a 3D sensor, Kinect v2 has huge potentials in agriculture applications, benefited from its low price and strong robustness. The paper proposes a Kinect-based automatic system for non-destructive growth measurement of leafy vegetables. The system used a turntable to acquire multi-view point clouds of the measured plant. Then a series of suitable algorithms were applied to obtain a fine 3D reconstruction for the plant, while measuring the key growth parameters including relative/absolute height, total/projected leaf area and volume. In experiment, 63 pots of lettuce in different growth stages were measured. The result shows that the Kinect-measured height and projected area have fine linear relationship with reference measurements. While the measured total area and volume both follow power law distributions with reference data. All these data have shown good fitting goodness (R² = 0.9457-0.9914). In the study of biomass correlations, the Kinect-measured volume was found to have a good power law relationship (R² = 0.9281) with fresh weight. In addition, the system practicality was validated by performance and robustness analysis.

Keywords: 3D reconstruction; Kinect v2; non-destructive; plant growth measurement; point cloud.


Conflict of interest statement

The authors declare no conflict of interest.

Figures

Figure 1
Figure 1
Platform of our system (a), relationship of each component (b) and effect of the white card (c). The arrows in (b) represent data flow directions.
Figure 2
Figure 2
Data acquisition procedure of our system. Solid lines are the main processes and dashed lines represent to use the information/data obtained by previous steps.
Figure 3
Figure 3
Main procedure of point cloud processing and plant growth parameters measurement. Solid lines are the main processes and dashed lines represent to use the information/data obtained by previous steps. The point clouds and triangular meshes appeared in this figure can be found in Supplementary Material A.
Figure 4
Figure 4
Plant and non-plant segmentation based on HSI color space: (a) data set definitions and segmentation results; (b) plant segmentation model; and (c) non-plant segmentation model. The data points in (b,c) are from the training set (combined by the data of three different sized plants). The interactive 3D scatter plots of (b,c) can be found in Supplementary Material B.
Figure 5
Figure 5
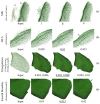
Key parameter optimization for major algorithms. In each row (ad), the left title is the algorithm name with its key parameter(s) in parentheses, then follows the input data and the results under three different settings, where the optimized values are underlined. Arrows indicate the discussed key areas. All numbers are in meters except for IterationTimes.
Figure 6
Figure 6
Principle of pot shape feature extraction and in-pot parts segmentation: (a) sample points extraction; (b) circle fitting and cone apex calculation; (c) construction of datum plane and adjusted cone (red); (d) in-pot point clouds segmentation; (e) segmented results.
Figure 7
Figure 7
Definitions and principles of plant height measurement.
Figure 8
Figure 8
Principle of projected leaf area measurement. The points inside and outside the projected triangles are in green and red, respectively.
Figure 9
Figure 9
Precision parameters optimization for projected leaf area (a) and volume (b). The selected values are shown as dashed lines.
Figure 10
Figure 10
Principle of tetrahedralization and volume measurement: (a) overlapped tetrahedrons construction; (b) tetrahedralization result; (c) volume measuring principle. In (c), the points inside and outside the tetrahedrons are in green and red, respectively, and their sizes are differed by viewing distance (the farther the smaller).
Figure 11
Figure 11
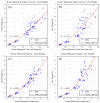
Data distribution and fitting results for relative height (a), absolute height based on soil method (b) and plant bottom method (c), total leaf area (d), projected leaf area (e) and volume (f). The original data for this figure can be found in Supplementary Material D.
Figure 12
Figure 12
Triangulation results of plants in different sizes. The triangular meshes can be found in Supplementary Material C.
Figure 13
Figure 13
Results of projected leaf area monitoring (periodical measurement) for a single plant.
Figure 14
Figure 14
Correlations of Kinect measurements and biomass: Kinect measured total leaf area and fresh weight (a), Kinect measured total leaf area and dry weight (b), Kinect measured volume and fresh weight (c), and Kinect measured volume and dry weight (d). The original data for this figure can be found in Supplementary Material D.
Figure 15
Figure 15
Time consumption of our system, for single plant measurement. The data are grouped by the number of points in original point clouds and the major time-consuming processes are in different colors.
Figure 16
Figure 16
3D reconstruction results for different species of leafy vegetables. The Qianbaocai is a hybrid of Brassica oleracea L. and Brassica campeseris L.

References

    1. Lati R.N., Filin S., Eizenberg H. Estimation of plants’ growth parameters via image-based reconstruction of their three-dimensional shape. Agron. J. 2013;105:191–198. doi: 10.2134/agronj2012.0305. - DOI
    1. Andersen H.J., Reng L., Kirk K. Geometric plant properties by relaxed stereo vision using simulated annealing. Comput. Electron. Agric. 2005;49:219–232. doi: 10.1016/j.compag.2005.02.015. - DOI
    1. Lati R.N., Filin S., Eizenberg H. Estimating plant growth parameters using an energy minimization-based stereovision model. Comput. Electron. Agric. 2013;98:260–271. doi: 10.1016/j.compag.2013.07.012. - DOI
    1. Yeh Y.H.F., Lai T.C., Liu T.Y., Liu C.C., Chung W.C., Lin T.T. An automated growth measurement system for leafy vegetables. Biosyst. Eng. 2014;117:43–50. doi: 10.1016/j.biosystemseng.2013.08.011. - DOI
    1. Aksoy E.E., Abramov A., Wörgötter F., Scharr H., Fischbach A., Dellen B. Modeling leaf growth of rosette plants using infrared stereo image sequences. Comput. Electron. Agric. 2015;110:78–90. doi: 10.1016/j.compag.2014.10.020. - DOI

LinkOut - more resources