. 2018 Mar 7;19(3):764.
doi: 10.3390/ijms19030764.

Unravelling the Effects of the Mutation m.3571insC/MT-ND1 on Respiratory Complexes Structural Organization

Affiliations

Unravelling the Effects of the Mutation m.3571insC/MT-ND1 on Respiratory Complexes Structural Organization

Luisa Iommarini et al. Int J Mol Sci. .

Abstract

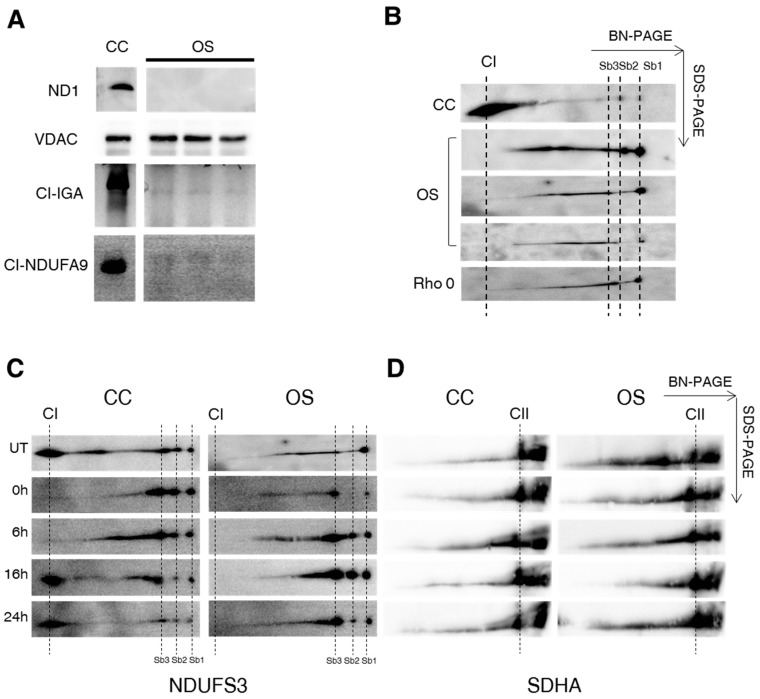
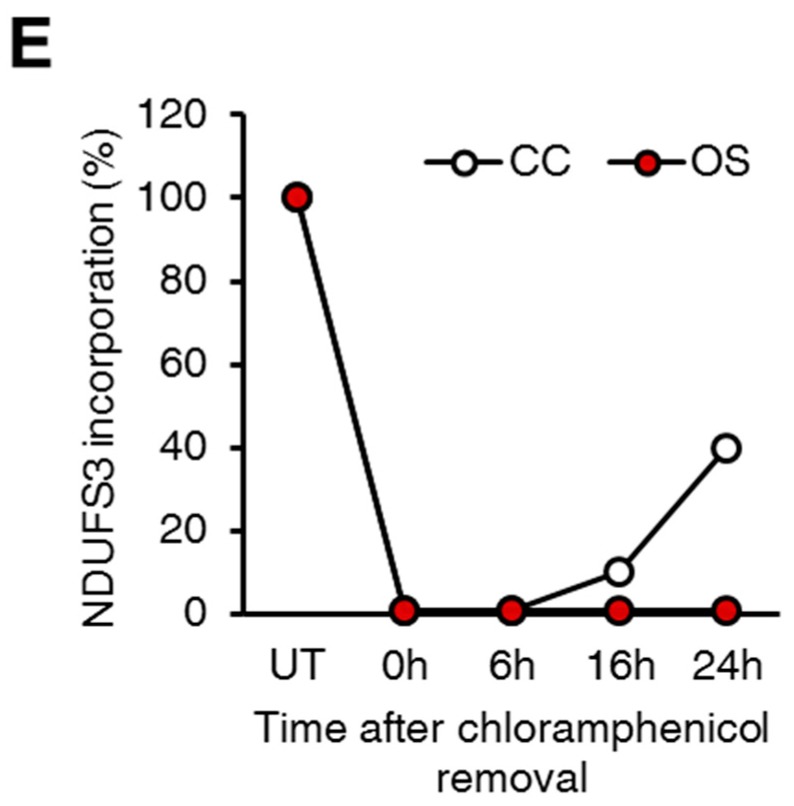
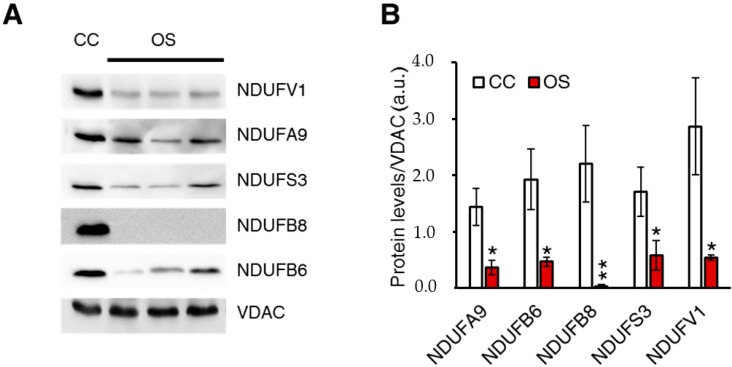
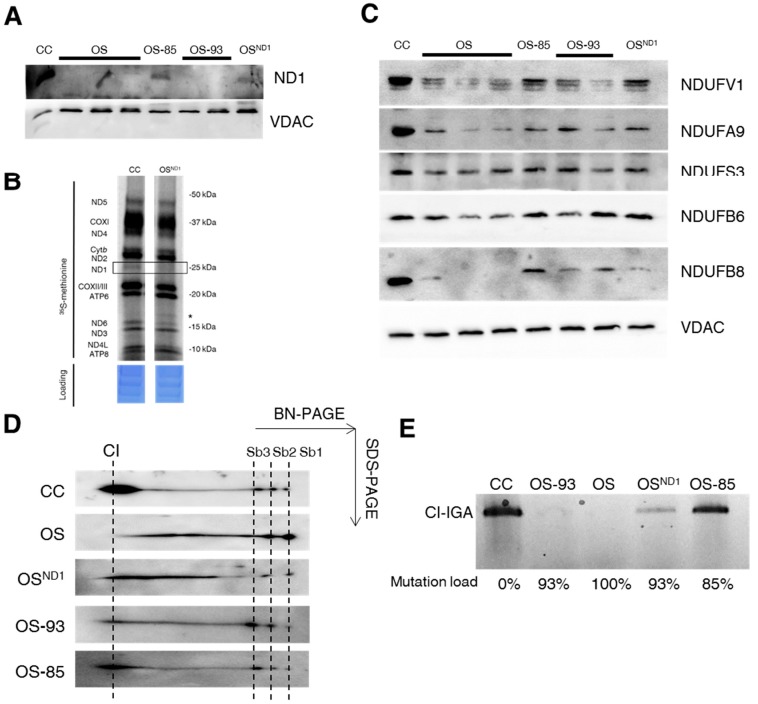
Mammalian respiratory complex I (CI) biogenesis requires both nuclear and mitochondria-encoded proteins and is mostly organized in respiratory supercomplexes. Among the CI proteins encoded by the mitochondrial DNA, NADH-ubiquinone oxidoreductase chain 1 (ND1) is a core subunit, evolutionary conserved from bacteria to mammals. Recently, ND1 has been recognized as a pivotal subunit in maintaining the structural and functional interaction among the hydrophilic and hydrophobic CI arms. A critical role of human ND1 both in CI biogenesis and in the dynamic organization of supercomplexes has been depicted, although the proof of concept is still missing and the critical amount of ND1 protein necessary for a proper assembly of both CI and supercomplexes is not defined. By exploiting a unique model in which human ND1 is allotopically re-expressed in cells lacking the endogenous protein, we demonstrated that the lack of this protein induces a stall in the multi-step process of CI biogenesis, as well as the alteration of supramolecular organization of respiratory complexes. We also defined a mutation threshold for the m.3571insC truncative mutation in mitochondrially encoded NADH:ubiquinone oxidoreductase core subunit 1 (MT-ND1), below which CI and its supramolecular organization is recovered, strengthening the notion that a certain amount of human ND1 is required for CI and supercomplexes biogenesis.

Keywords: MT-ND1; ND1; OXPHOS; mitochondria; mtDNA mutation; respirasome; respiratory complex I; respiratory complexes; supercomplexes.


Conflict of interest statement

The authors declare no conflict of interest.

Figures

Figure 1
Figure 1
Human ND1 is necessary for CI assembly and stability. (A) Immunoblotting of ND1 levels in crude mitochondria obtained from control (CC) and three different ND1-null cybrids (OS). One representative experiment of three is shown. Complex I In-Gel Activity (CI-IGA) and western blot analysis of isolated CI using an antibody against the NDUFA9 subunit performed on isolated respiratory complexes separated by hrCNE. VDAC1 was used as a loading control. (B) 2D BN/SDS-PAGE performed on mitochondria-enriched fractions obtained from control (CC), three different ND1-null (OS) and mtDNA depleted (Rho 0) cybrids followed by western blot analysis using an antibody against NDUFS3. Fully assembled CI and sub-complexes (Sb1-2-3) are indicated by dotted lines. (C) 2D BN/SDS-PAGE followed by western blotting using an antibody against NDUFS3. Mitochondria-enriched fractions were obtained from control (CC) and three different ND1-null (OS) cybrids in absence (untreated, UT) of 50 µg/mL chloramphenicol and at different times (0, 6, 16 and 24 h) after chloramphenicol removal. Fully assembled CI and sub-complexes (Sb1-2-3) are indicated by dotted lines. One representative experiment of three is shown. (D) 2D BN/SDS-PAGE, followed by western blotting using an antibody against SDHA, carried out in mitochondria-enriched fractions isolated from CC and OS clone in the absence (untreated, UT) of 50 µg/mL chloramphenicol and at different times (0, 6, 16 and 24 h) after chloramphenicol removal. Fully assembled CII is indicated by dotted lines. One representative experiment of three is shown. (E) Mean incorporation rates of NDUFS3 in fully assembled CI after chloramphenicol removal. The signal was quantified on the level of SDHA, a subunit of CII. Mean values are expressed as percentages relative to untreated cells (UT, 100%).
Figure 1
Figure 1
Human ND1 is necessary for CI assembly and stability. (A) Immunoblotting of ND1 levels in crude mitochondria obtained from control (CC) and three different ND1-null cybrids (OS). One representative experiment of three is shown. Complex I In-Gel Activity (CI-IGA) and western blot analysis of isolated CI using an antibody against the NDUFA9 subunit performed on isolated respiratory complexes separated by hrCNE. VDAC1 was used as a loading control. (B) 2D BN/SDS-PAGE performed on mitochondria-enriched fractions obtained from control (CC), three different ND1-null (OS) and mtDNA depleted (Rho 0) cybrids followed by western blot analysis using an antibody against NDUFS3. Fully assembled CI and sub-complexes (Sb1-2-3) are indicated by dotted lines. (C) 2D BN/SDS-PAGE followed by western blotting using an antibody against NDUFS3. Mitochondria-enriched fractions were obtained from control (CC) and three different ND1-null (OS) cybrids in absence (untreated, UT) of 50 µg/mL chloramphenicol and at different times (0, 6, 16 and 24 h) after chloramphenicol removal. Fully assembled CI and sub-complexes (Sb1-2-3) are indicated by dotted lines. One representative experiment of three is shown. (D) 2D BN/SDS-PAGE, followed by western blotting using an antibody against SDHA, carried out in mitochondria-enriched fractions isolated from CC and OS clone in the absence (untreated, UT) of 50 µg/mL chloramphenicol and at different times (0, 6, 16 and 24 h) after chloramphenicol removal. Fully assembled CII is indicated by dotted lines. One representative experiment of three is shown. (E) Mean incorporation rates of NDUFS3 in fully assembled CI after chloramphenicol removal. The signal was quantified on the level of SDHA, a subunit of CII. Mean values are expressed as percentages relative to untreated cells (UT, 100%).
Figure 2
Figure 2
ND1 ablation impacts on steady state levels of nDNA-encoded complex I (CI) subunits. (A) Immunoblotting of CI nuclear-encoded subunits in crude mitochondria from control (CC) and three different ND1-null (OS) cybrids. VDAC1 was used as a loading control. One representative experiment of three is shown. (B) Densitometric quantification of western blot analysis of CI nuclear-encoded subunits. Data are mean ± SEM (n = 3, * p-value < 0.05; ** p-value < 0.001).
Figure 3
Figure 3
Low levels of wild type ND1 partially rescue CI assembly and function. (A) Western blot analysis of ND1 levels in crude mitochondria from control (CC), ND1-null (OS), 93% ND1 mutant (OS-93), 85% ND1 mutant (OS-85) and allotopically complemented (OSND1) cybrids. VDAC1 was used as loading control. One representative experiment of three is shown. (B) Mitochondrial in vitro translation. The autoradiogram displaying the radiolabeled mitochondrial translation products and the corresponding Coomassie blue-stained gel as a control for loading are shown. The boxed section correspond to the endogenous ND1 subunit. A small protein product of about 15 kDa, indicated by an asterisk, is detectable in OSND1. This band may be the bona fide truncated ND1 subunit. (C) Western blot analysis of steady state levels of CI nuclear-encoded subunits in crude mitochondria from control (CC), ND1-null (OS), 93% ND1 mutant (OS-93), 85% ND1 mutant (OS-85), and allotopically complemented (OSND1) cybrids. VDAC1 was used as a loading control. One representative experiment of three is shown. (D) 2D BN/SDS-PAGE followed by western blotting using an antibody against NDUFS3 subunit performed on mitochondria-enriched fractions. Fully assembled CI and sub-complexes (Sb1-2-3) are indicated by dotted lines. One representative experiment of three is shown. (E) CI-IGA assay after separation of mitochondria-enriched fractions by hrCNE. One representative experiment of three is shown. (F) CI redox specific activity (rotenone-sensitive) normalized on citrate synthase (CS) activity. Data are mean ± SD (n = 5, * p-value < 0.05). (G) Mitochondrial ATP synthesis rate driven by CI substrates. Data are normalized on CS activity and are mean ± SD (n = 5, * p-value < 0.05; ** p-value < 0.001).
Figure 3
Figure 3
Low levels of wild type ND1 partially rescue CI assembly and function. (A) Western blot analysis of ND1 levels in crude mitochondria from control (CC), ND1-null (OS), 93% ND1 mutant (OS-93), 85% ND1 mutant (OS-85) and allotopically complemented (OSND1) cybrids. VDAC1 was used as loading control. One representative experiment of three is shown. (B) Mitochondrial in vitro translation. The autoradiogram displaying the radiolabeled mitochondrial translation products and the corresponding Coomassie blue-stained gel as a control for loading are shown. The boxed section correspond to the endogenous ND1 subunit. A small protein product of about 15 kDa, indicated by an asterisk, is detectable in OSND1. This band may be the bona fide truncated ND1 subunit. (C) Western blot analysis of steady state levels of CI nuclear-encoded subunits in crude mitochondria from control (CC), ND1-null (OS), 93% ND1 mutant (OS-93), 85% ND1 mutant (OS-85), and allotopically complemented (OSND1) cybrids. VDAC1 was used as a loading control. One representative experiment of three is shown. (D) 2D BN/SDS-PAGE followed by western blotting using an antibody against NDUFS3 subunit performed on mitochondria-enriched fractions. Fully assembled CI and sub-complexes (Sb1-2-3) are indicated by dotted lines. One representative experiment of three is shown. (E) CI-IGA assay after separation of mitochondria-enriched fractions by hrCNE. One representative experiment of three is shown. (F) CI redox specific activity (rotenone-sensitive) normalized on citrate synthase (CS) activity. Data are mean ± SD (n = 5, * p-value < 0.05). (G) Mitochondrial ATP synthesis rate driven by CI substrates. Data are normalized on CS activity and are mean ± SD (n = 5, * p-value < 0.05; ** p-value < 0.001).
Figure 4
Figure 4
Mitochondrial respiration depends on ND1 abundance. (A) Oxygen consumption rate (OCR) profiles performed in 10 mM glucose medium upon injection of 1 µM oligomycin (Oligo), variable concentration of carbonyl cyanide 4-(trifluoromethoxy)phenylhydrazone (FCCP) determined by titration, 1 µM rotenone (Rote), and 1 µM antimycin A (Aa). Data (mean ± SD, n ≥ 4) are expressed as OCR (picomoles of O2 per minute) normalized on SRB absorbance. All the data points from CC are statistically significant compared to all the other cell lines (B) Basal, ATP-linked and maximal respiration, spare respiratory capacity, rotenone sensitive, and insensitive OCR of mutant cells with different amount of ND1. Data (mean ± SD, n ≥ 4, * p-value < 0.05; ** p-value < 0.001) are expressed as OCR (picomoles of O2 per minute) normalized on SRB absorbance.
Figure 4
Figure 4
Mitochondrial respiration depends on ND1 abundance. (A) Oxygen consumption rate (OCR) profiles performed in 10 mM glucose medium upon injection of 1 µM oligomycin (Oligo), variable concentration of carbonyl cyanide 4-(trifluoromethoxy)phenylhydrazone (FCCP) determined by titration, 1 µM rotenone (Rote), and 1 µM antimycin A (Aa). Data (mean ± SD, n ≥ 4) are expressed as OCR (picomoles of O2 per minute) normalized on SRB absorbance. All the data points from CC are statistically significant compared to all the other cell lines (B) Basal, ATP-linked and maximal respiration, spare respiratory capacity, rotenone sensitive, and insensitive OCR of mutant cells with different amount of ND1. Data (mean ± SD, n ≥ 4, * p-value < 0.05; ** p-value < 0.001) are expressed as OCR (picomoles of O2 per minute) normalized on SRB absorbance.
Figure 5
Figure 5
ND1 is required for respirasome CI+CIII2+CIV formation and stability. (A) 2D BN/SDS-PAGE and western blotting of respirasome (indicated as SC) performed on mitochondria-enriched fractions using an antibody against NDUFS3. Fully assembled CI is indicated as CI; sub-complexes of CI are indicated as Sb1-2-3. One representative experiment of three is shown. (B) CI-IGA of supercomplexes (SC) and isolated CI performed on mitochondria-enriched fractions. One representative experiment of three is shown. (C) 2D BN/SDS-PAGE and western blotting for supercomplexes (SC) performed on mitochondria-enriched fractions using an antibody against NDUFS3. CI sub-complexes are indicated as Sb1-2-3. One representative experiment of three is shown. (D) CI-IGA of supercomplexes (indicated as CI+III2+IVn, CI+III2+IV or CI+CIII2) and isolated CI (CI) of mitochondria-enriched fractions. One representative experiment of three is shown.

Similar articles

Cited by

References

    1. Hirst J. Mitochondrial Complex I. Annu. Rev. Biochem. 2013;82:551–575. doi: 10.1146/annurev-biochem-070511-103700. - DOI - PubMed
    1. Vinothkumar K.R., Zhu J., Hirst J. Architecture of mammalian respiratory complex I. Nature. 2014;515:80–84. doi: 10.1038/nature13686. - DOI - PMC - PubMed
    1. Guerrero-Castillo S., Baertling F., Kownatzki D., Wessels H.J., Arnold S., Brandt U., Nijtmans L. The Assembly Pathway of Mitochondrial Respiratory Chain Complex I. Cell Metab. 2017;25:128–139. doi: 10.1016/j.cmet.2016.09.002. - DOI - PubMed
    1. Sánchez-Caballero L., Guerrero-Castillo S., Nijtmans L. Unraveling the complexity of mitochondrial complex I assembly: A dynamic process. Biochim. Biophys. Acta. 2016 doi: 10.1016/j.bbabio.2016.03.031. - DOI - PubMed
    1. Baradaran R., Berrisford J.M., Minhas G.S., Sazanov L.A. Crystal structure of the entire respiratory complex I. Nature. 2013;494:443–448. doi: 10.1038/nature11871. - DOI - PMC - PubMed

MeSH terms

LinkOut - more resources