

Key Players of Cisplatin Resistance: Towards a Systems Pharmacology Approach
- PMID: 29518977
- PMCID: PMC5877628
- DOI: 10.3390/ijms19030767
Key Players of Cisplatin Resistance: Towards a Systems Pharmacology Approach
Abstract
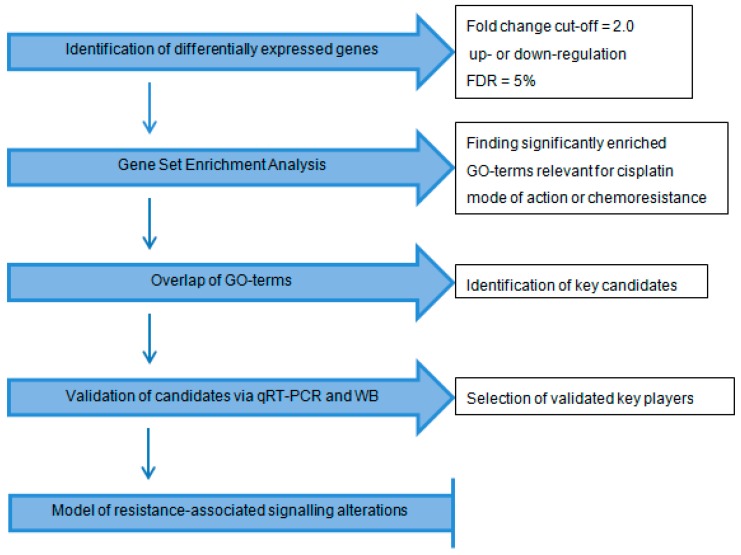
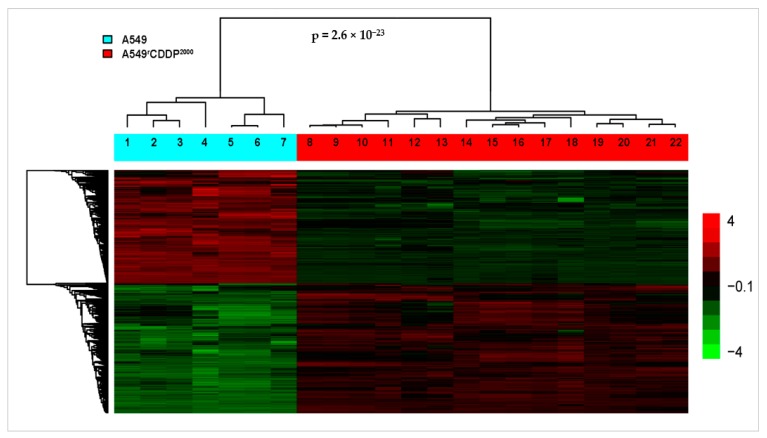
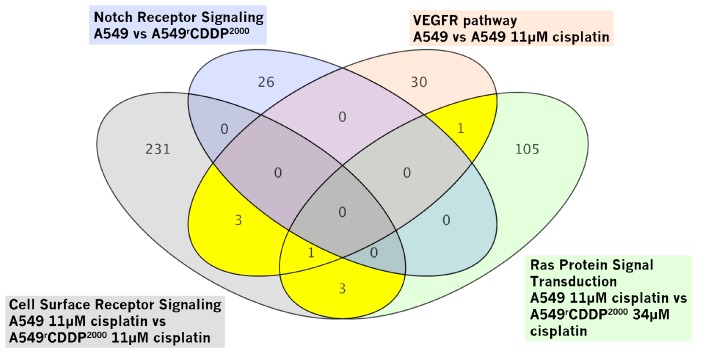
The major obstacle in the clinical use of the antitumor drug cisplatin is inherent and acquired resistance. Typically, cisplatin resistance is not restricted to a single mechanism demanding for a systems pharmacology approach to understand a whole cell's reaction to the drug. In this study, the cellular transcriptome of untreated and cisplatin-treated A549 non-small cell lung cancer cells and their cisplatin-resistant sub-line A549rCDDP2000 was screened with a whole genome array for relevant gene candidates. By combining statistical methods with available gene annotations and without a previously defined hypothesis HRas, MAPK14 (p38), CCL2, DOK1 and PTK2B were identified as genes possibly relevant for cisplatin resistance. These and related genes were further validated on transcriptome (qRT-PCR) and proteome (Western blot) level to select candidates contributing to resistance. HRas, p38, CCL2, DOK1, PTK2B and JNK3 were integrated into a model of resistance-associated signalling alterations describing differential gene and protein expression between cisplatin-sensitive and -resistant cells in reaction to cisplatin exposure.
Keywords: CCL2; DOK1; HRas; JNK3; PTK2B; cellular signalling; cisplatin resistance; p38.
Conflict of interest statement
The authors declare no conflict of interest.
Figures
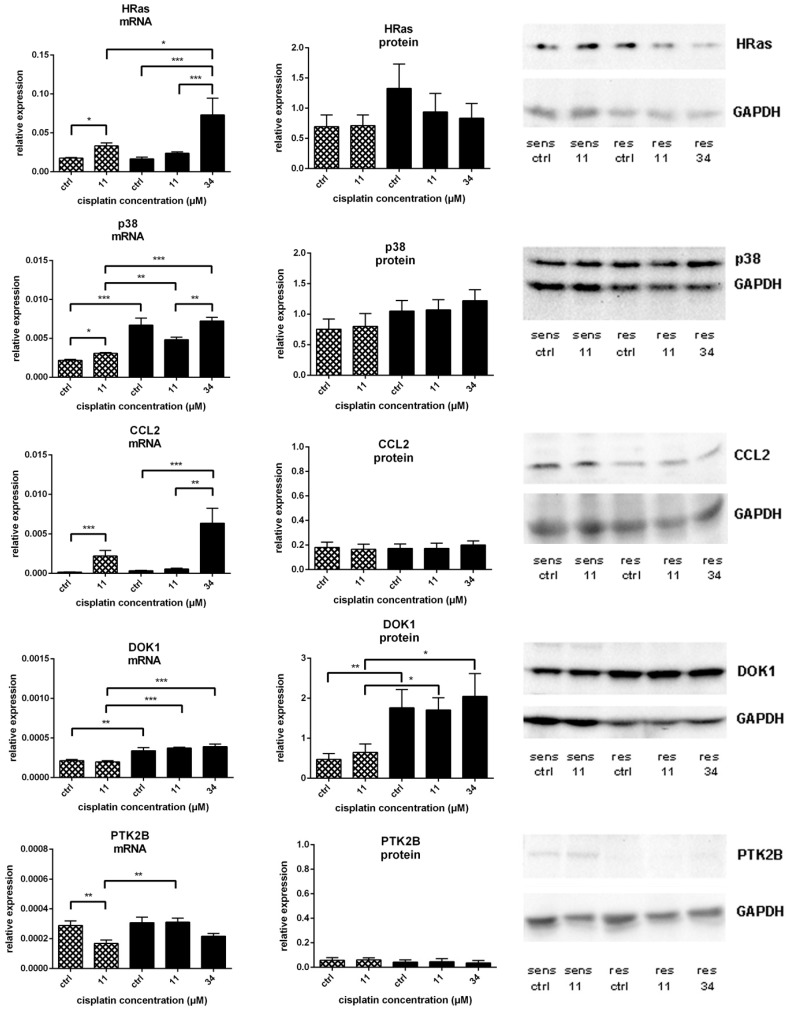
 ) and A549rCDDP2000 (
 ) before (ctrl) and after treatment with 11 µM cisplatin (11) or 34 µM cisplatin (34) presented as mean ± SEM; as well as representative Western blots. * p < 0.05; ** p < 0.01; *** p < 0.01.
 ) and A549rCDDP2000 (
 ) after treatment with 11 µM cisplatin (11) or 34 µM cisplatin (34) expressed as mean ± SEM, as well as representative Western blots.* p < 0.05; ** p < 0.01; *** p < 0.01.
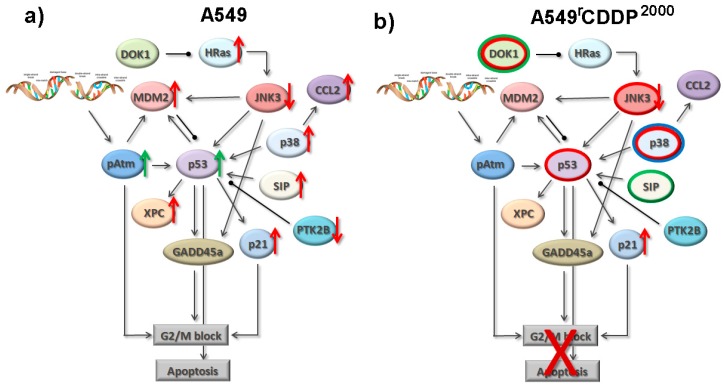
Similar articles
-
A systems biology approach to identify microRNAs contributing to cisplatin resistance in human ovarian cancer cells.Mol Biosyst. 2017 Oct 24;13(11):2268-2276. doi: 10.1039/c7mb00362e. Mol Biosyst. 2017. PMID: 28861582
-
Cisplatin resistance in non-small cell lung cancer cells is associated with an abrogation of cisplatin-induced G2/M cell cycle arrest.PLoS One. 2017 Jul 26;12(7):e0181081. doi: 10.1371/journal.pone.0181081. eCollection 2017. PLoS One. 2017. PMID: 28746345 Free PMC article.
-
A systems biology case study of ovarian cancer drug resistance.Comput Syst Bioinformatics Conf. 2006:389-98. Comput Syst Bioinformatics Conf. 2006. PMID: 17369659
-
Differences in gene expression profiles and carcinogenesis pathways involved in cisplatin resistance of four types of cancer.Oncol Rep. 2013 Aug;30(2):596-614. doi: 10.3892/or.2013.2514. Epub 2013 Jun 3. Oncol Rep. 2013. PMID: 23733047
-
EHD1 confers resistance to cisplatin in non-small cell lung cancer by regulating intracellular cisplatin concentrations.BMC Cancer. 2016 Jul 13;16:470. doi: 10.1186/s12885-016-2527-3. BMC Cancer. 2016. PMID: 27411790 Free PMC article.
Cited by
-
Identification of BXDC2 as a Key Downstream Effector of the Androgen Receptor in Modulating Cisplatin Sensitivity in Bladder Cancer.Cancers (Basel). 2021 Feb 26;13(5):975. doi: 10.3390/cancers13050975. Cancers (Basel). 2021. PMID: 33652650 Free PMC article.
-
Isothiocyanates (ITCs) 1-(Isothiocyanatomethyl)-4-phenylbenzene and 1-Isothiocyanato-3,5-bis(trifluoromethyl)benzene-Aldehyde Dehydrogenase (ALDH) Inhibitors, Decreases Cisplatin Tolerance and Migratory Ability of NSCLC.Int J Mol Sci. 2022 Aug 3;23(15):8644. doi: 10.3390/ijms23158644. Int J Mol Sci. 2022. PMID: 35955773 Free PMC article.
-
Oxidative Damage as a Fundament of Systemic Toxicities Induced by Cisplatin-The Crucial Limitation or Potential Therapeutic Target?Int J Mol Sci. 2023 Sep 26;24(19):14574. doi: 10.3390/ijms241914574. Int J Mol Sci. 2023. PMID: 37834021 Free PMC article. Review.
-
Systematic Identification of Genomic Markers for Guiding Iron Oxide Nanoparticles in Cervical Cancer Based on Translational Bioinformatics.Int J Nanomedicine. 2022 Jun 29;17:2823-2841. doi: 10.2147/IJN.S361483. eCollection 2022. Int J Nanomedicine. 2022. PMID: 35791307 Free PMC article.
-
Study on the chemodrug-induced effect in nasopharyngeal carcinoma cells using laser tweezer Raman spectroscopy.Biomed Opt Express. 2020 Mar 5;11(4):1819-1833. doi: 10.1364/BOE.388785. eCollection 2020 Apr 1. Biomed Opt Express. 2020. PMID: 32341850 Free PMC article.
References
-
- Besse B., Adjei A., Baas P., Meldgaard P., Nicolson M., Paz-Ares L., Reck M., Smit E.F., Syrigos K., Stahel R., et al. 2nd ESMO Consensus Conference on Lung Cancer: Non-small-cell lung cancer first-line/second and further lines of treatment in advanced disease. Ann. Oncol. 2014;25:1475–1484. doi: 10.1093/annonc/mdu123. - DOI - PubMed
MeSH terms
Substances
LinkOut - more resources
Full Text Sources
Other Literature Sources
Molecular Biology Databases
Research Materials
Miscellaneous
