. 2018 Mar 13;71(10):1078-1089.
doi: 10.1016/j.jacc.2017.12.064.

10-Year Resource Utilization and Costs for Cardiovascular Care

Affiliations

10-Year Resource Utilization and Costs for Cardiovascular Care

Leslee J Shaw et al. J Am Coll Cardiol. .

Abstract

Background: Cardiovascular disease (CVD) imparts a heavy economic burden on the U.S. health care system. Evidence regarding the long-term costs after comprehensive CVD screening is limited.

Objectives: This study calculated 10-year health care costs for 6,814 asymptomatic participants enrolled in MESA (Multi-Ethnic Study of Atherosclerosis), a registry sponsored by the National Heart, Lung, and Blood Institute, National Institutes of Health.

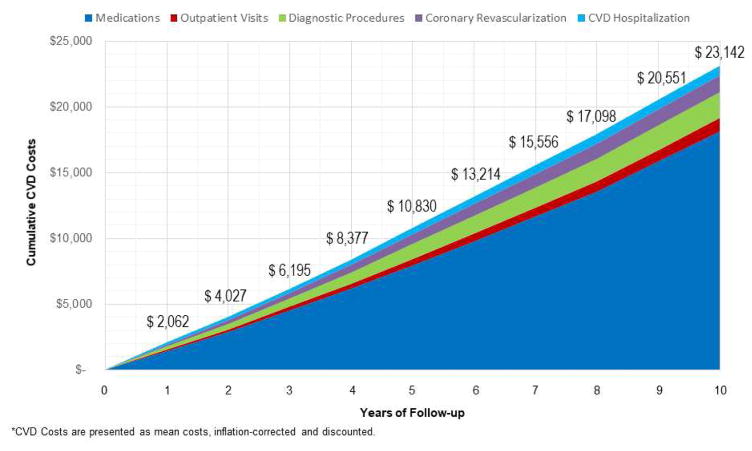
Methods: Cumulative 10-year costs for CVD medications, office visits, diagnostic procedures, coronary revascularization, and hospitalizations were calculated from detailed follow-up data. Costs were derived by using Medicare nationwide and zip code-specific costs, inflation corrected, discounted at 3% per year, and presented in 2014 U.S. dollars.

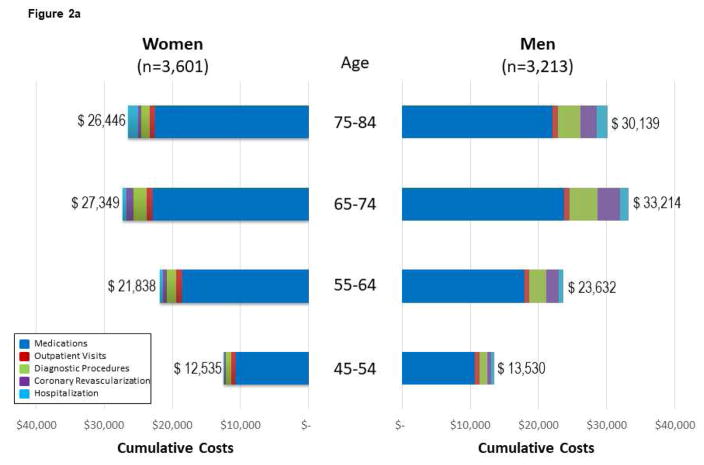
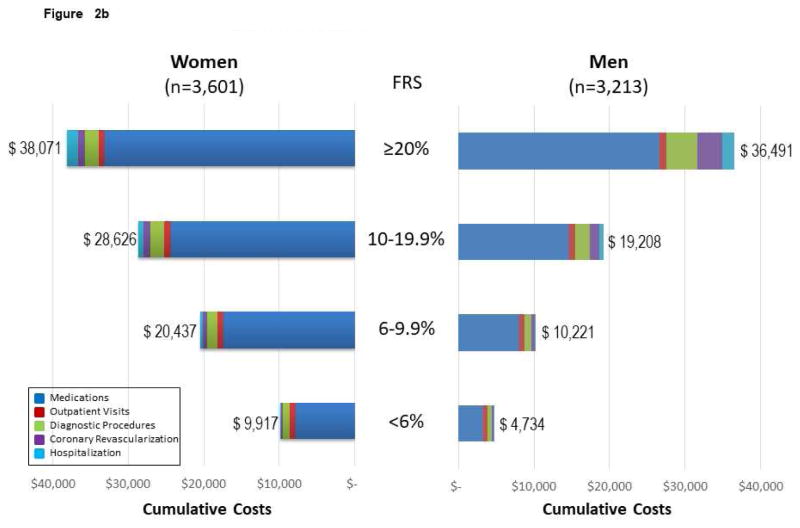
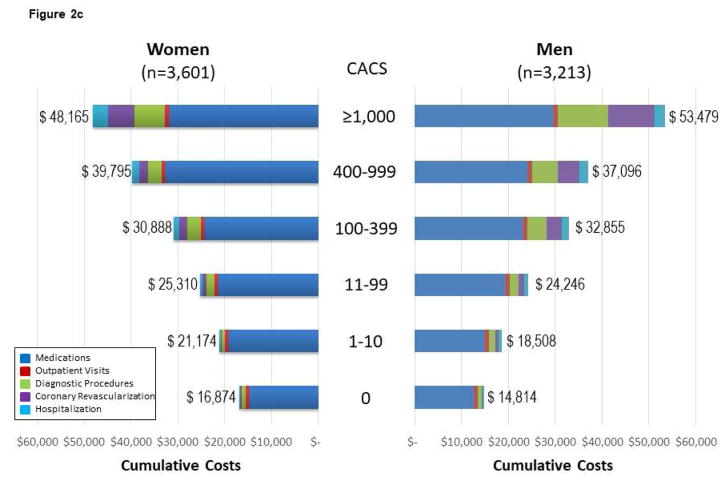
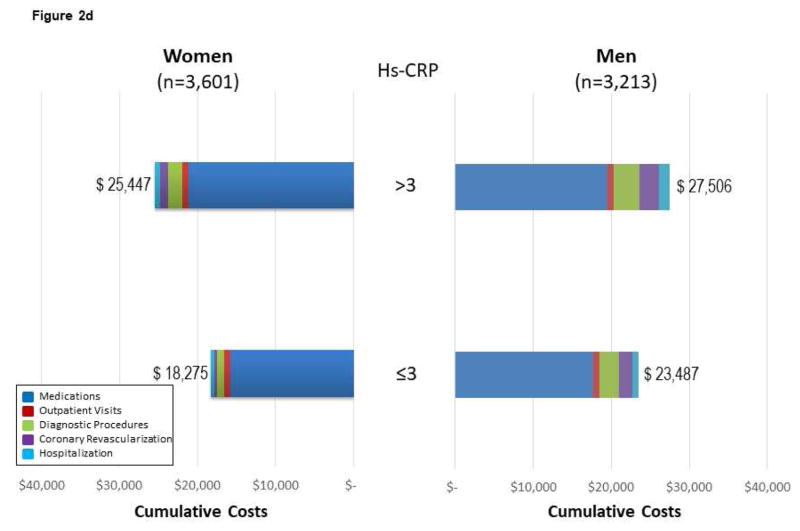
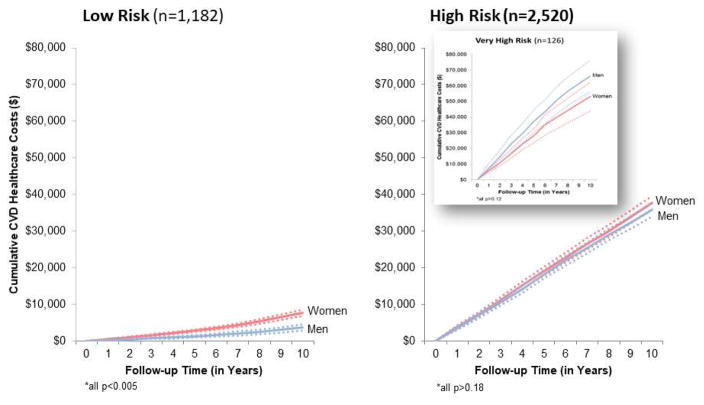
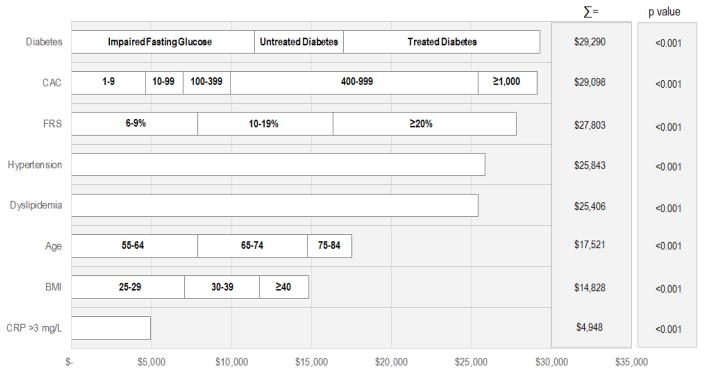
Results: Risk factor prevalence increased dramatically and, by 10 years, diabetes, hypertension, and dyslipidemia was reported in 19%, 57%, and 53%, respectively. Self-reported symptoms (i.e., chest pain or shortness of breath) were common (approximately 40% of enrollees). At 10 years, approximately one-third of enrollees reported having an echocardiogram or exercise test, whereas 7% underwent invasive coronary angiography. These utilization patterns resulted in 10-year health care costs of $23,142. The largest proportion of costs was associated with CVD medication use (78%). Approximately $2 of every $10 were spent for outpatient visits and diagnostic testing among the elderly, obese, those with a high-sensitivity C-reactive protein level >3 mg/l, or coronary artery calcium score (CACS) ≥400. Costs varied widely from <$7,700 for low-risk (Framingham risk score <6%, 0 CACS, and normal glucose measurements at baseline) to >$35,800 for high-risk (persons with diabetes, Framingham risk score ≥20%, or CACS ≥400) subgroups. Among high-risk enrollees, CVD costs accounted for $74 million of the $155 million consumed by MESA participants.

Conclusions: Longitudinal patterns of health care resource use after screening revealed new evidence on the economic burden of treatment and testing patterns not previously reported. Maintenance of a healthy population has the potential to markedly reduce the economic burden of CVD among asymptomatic individuals.

Keywords: asymptomatic; cardiovascular disease screening; economics; long-term follow-up.


Figures

Figure 1
Figure 1. Cumulative Mean Per-Patient CVD Costs for Medications, Diagnostic Procedures, Outpatient Visits, Coronary Revascularization, and Hospitalization among 6,814 MESA Participants
At each year of follow-up, the mean per-patient cost values for medications, visits, diagnostic procedures, coronary revascularization, and hospitalization are reported. The mean value at each year of follow-up is reported above the cumulative total costs. All cost values are rounded to the nearest whole number. CVD = cardiovascular disease; MESA = Multi-Ethnic Study of Atherosclerosis.
Figure 2
Figure 2. Follow-up CVD Costs* for Medications, Diagnostic Procedures, Outpatient Visits, Coronary Revascularization, and Hospitalization Among MESA Subgroups
(A) Follow-up CVD costs for medications, diagnostic procedures, outpatient visits, coronary revascularization, and hospitalization among 6,814 MESA participants across age and sex subgroups. Costs are reported by sex, as data support variable cost patterns among women and men. For Figure 2, the cumulative costs by subgroups of medications, visits, diagnostic procedures, coronary revascularization, and hospitalization are reported. The cumulative costs across the age ranges support higher cost/resource consumption patterns. (B) Cumulative follow-up CVD costs* for medications, diagnostic procedures, outpatient visits, coronary revascularization, and hospitalization among 6,814 mesa participants across Framingham Risk Score (FRS) subgroups of women and men. The cumulative costs across the FRS subgroups support higher cost/resource consumption patterns among higher-risk individuals. The presented costs are unadjusted consumption patterns among older individuals. The presented costs are unadjusted. (C) Follow-up CVD costs* for medications, diagnostic procedures, outpatient visits, coronary revascularization, and hospitalization among 6,814 MESA participants across CACS subgroups of women and men. The cumulative costs across the CACS subgroups support higher cost/resource consumption patterns among individuals with more extensive CAC. Please note that this x-axis extends through $60,000 versus $40,000 for the age, FRS, and hsCRP analyses. The presented costs are unadjusted. (D) Follow-up CVD costs* for medications, diagnostic procedures, outpatient visits, coronary revascularization, and hospitalization among 6,814 MESA participants across hsCRP subgroups of women and men. The cumulative costs among low- and high-risk hsCRP subgroups report slightly higher cost/resource consumption patterns within these higher risk individuals. Noteworthy is the higher costs associated with medications for those individuals with high-risk hsCRP. The presented costs are unadjusted. CACS = coronary artery calcium score; FRS = Framingham Risk Score; hsCRP = high-sensitivity C-reactive protein. Other abbreviations as in Figure 1.
Figure 3
Figure 3. Cumulative Follow-Up CVD Health Care Costs Among MESA Subjects with Low- and High-Risk Findings
Cumulative (unadjusted) follow-up CVD health care costs (with 95% confidence intervals, dotted lines) are shown for low-risk (n = 1,182 with low-risk FRS, CACS = 0, and normal glucose values) and high-risk findings (n = 2,520 with CACS ≥400, diabetes, or high-risk FRS). A subset of very high-risk subjects, defined as diabetic patients with a high-risk FRS and CACS ≥400 (n = 126) is plotted as an insert. Abbreviations as in Figures 1 and 2.
Central Illustration
Central Illustration. Adjusted 10-Year Health Care Costs by Traditional and Nontraditional CVD Risk Factors
We first log-transformed 10-year total costs and performed a multivariate linear regression (Model r2 = 0.41; p < 0.001). So that adjusted costs might be presented, results from a multivariate linear model using the log-transformed dependent variable of 10-year total costs are also shown (Model r2 = 0.35; p < 0.001). From this latter model, we present the predicted, unique costs associated with each variable and/or subgroup. For example, MESA enrollees with an impaired fasting glucose had $11,449 higher 10-year costs compared with those with normal glucose values. Moreover, a participant with untreated diabetes at the index evaluation had an additional $5,567 in ten-year health care costs compared with participants with an impaired fasting glucose. Finally, the 10-year health care costs were highest for those with treated diabetes ($29,290). Costs are ranked from highest to lowest. When added to the model, MESA racial/ethnic subgroups had lower costs of CVD; with black, Hispanic, and Chinese participants having $832, $619, and $1,666 lower adjusted 10-year costs (p = 0.46); however, this is not statistically significant. Similarly, enrollees on Medicare, Medicaid, or with private insurance had predicted costs of $2,264 (p = 0.006), $562 (p = 0.63), and $719 (p = 0.30), respectively. BMI = body mass index; CAC = coronary artery calcium; CRP = C-reactive protein; CVD = cardiovascular disease; FRS = Framingham Risk Score; MESA = Multi-Ethnic Study of Atherosclerosis.

Comment in

References

    1. Go AS, Mozaffarian D, Roger VL, et al. American Heart Association Statistics Committee and Stroke Statistics Subcommittee. Heart disease and stroke statistics--2014 update: a report from the American Heart Association. Circulation. 2014;129:e28–e292. - PMC - PubMed
    1. Heidenreich PA, Trogdon JG, Khavjou OA, et al. Forecasting the future of cardiovascular disease in the United States: a policy statement from the American Heart Association. Circulation. 2011;123:933–44. - PubMed
    1. Benjamin EJ, Blaha MJ, Chiuve SE, et al. American Heart Association Statistics Committee and Stroke Statistics Subcommittee. Heart disease and stroke statistics-2017 update: a report from the American Heart Association [Published corrections appear in Circulation 2017;135:e646 and Circulation. 2017;136:e196] Circulation. 2017;135:e146–e603. - PMC - PubMed
    1. Fihn SD, Gardin JM, Abrams J, et al. 2012 ACCF/AHA/ACP/AATS/PCNA/SCAI/STS Guideline for the diagnosis and management of patients with stable ischemic heart disease: a report of the American College of Cardiology Foundation/American Heart Association Task Force on Practice Guidelines, and the American College of Physicians, American Association for Thoracic Surgery, Preventive Cardiovascular Nurses Association, Society for Cardiovascular Angiography and Interventions, and Society of Thoracic Surgeons. J Am Coll Cardiol. 2012;60:e44–e164. - PubMed
    1. Curry SJ, Byers T, Hewitt M, editors. Fulfilling the Potential of Cancer Prevention and Early Detection. National Academies Press; Washington, DC: 2003. Available at: https://doi.org/10.17226/10263. - DOI - PubMed

Publication types

MeSH terms