

Impact of Ischemic and Valvular Heart Disease on Atrial Excitation:A High-Resolution Epicardial Mapping Study
- PMID: 29519812
- PMCID: PMC5907575
- DOI: 10.1161/JAHA.117.008331
Impact of Ischemic and Valvular Heart Disease on Atrial Excitation:A High-Resolution Epicardial Mapping Study
Abstract
Background: The influence of underlying heart disease or presence of atrial fibrillation (AF) on atrial excitation during sinus rhythm (SR) is unknown. We investigated atrial activation patterns and total activation times of the entire atrial epicardial surface during SR in patients with ischemic and/or valvular heart disease with or without AF.
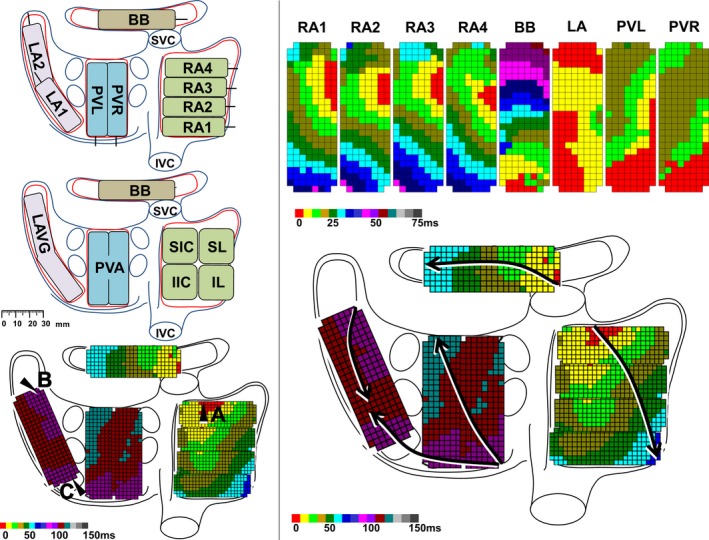
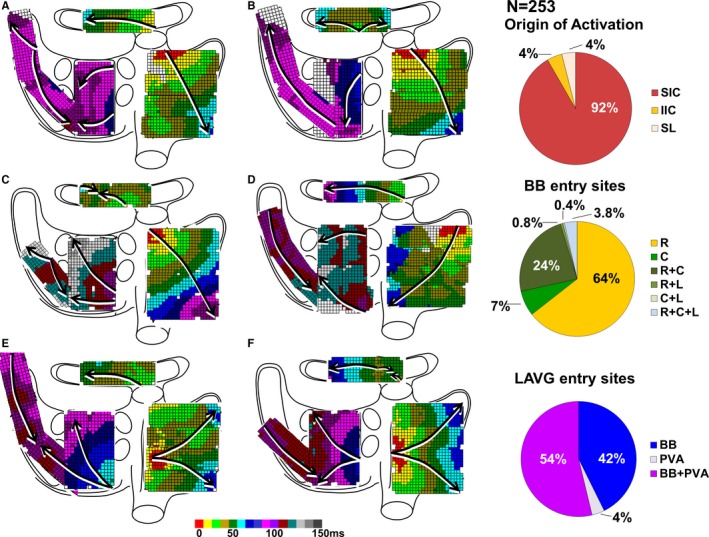
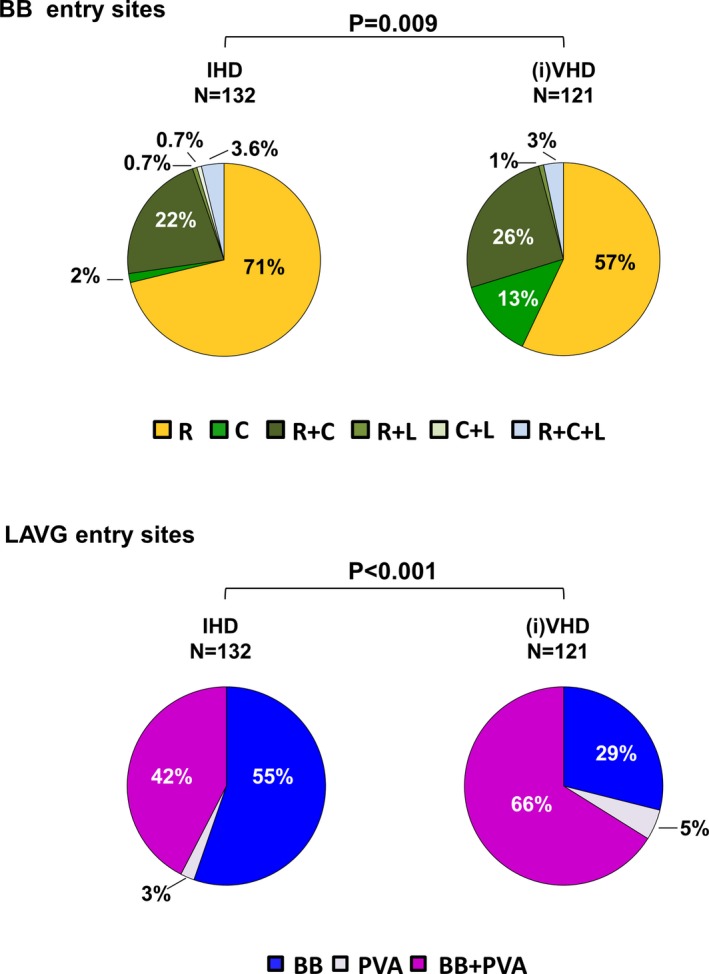
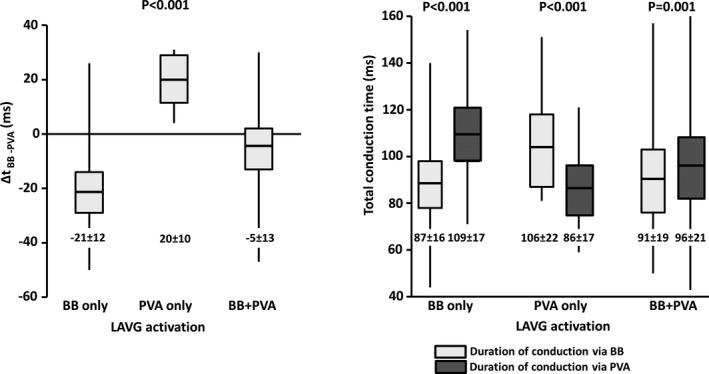
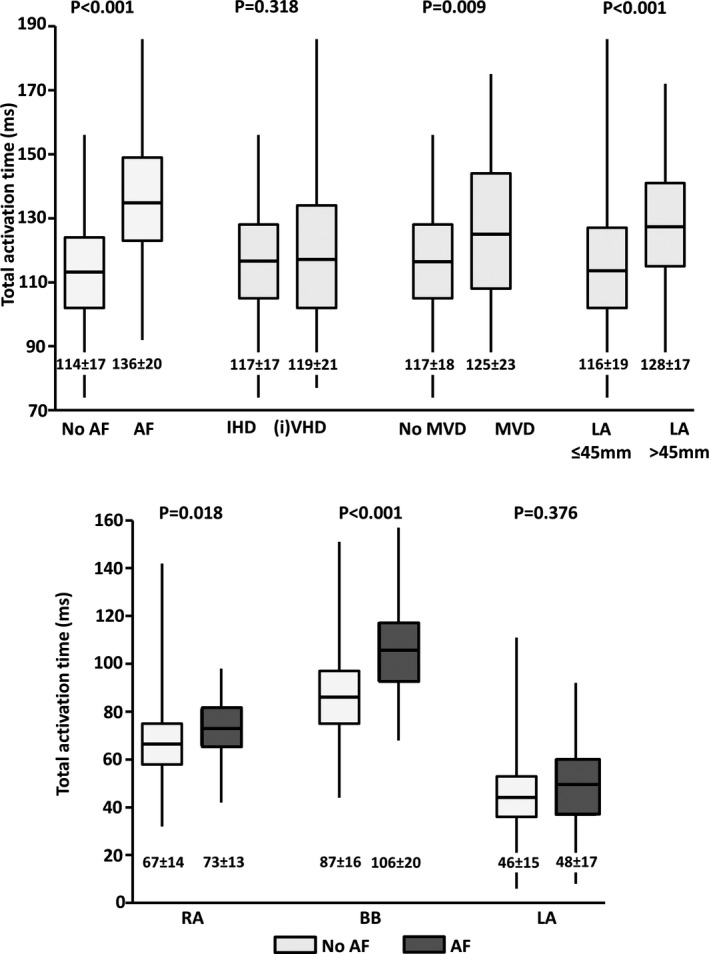
Methods and results: Intraoperative epicardial mapping (N=128/192 electrodes, interelectrode distances: 2 mm) of the right atrium, Bachmann's bundle (BB), left atrioventricular groove, and pulmonary vein area was performed during SR in 253 patients (186 male [74%], age 66±11 years) with ischemic heart disease (N=132, 52%) or ischemic valvular heart disease (N=121, 48%). As expected, SR origin was located at the superior intercaval region of the right atrium in 232 patients (92%). BB activation occurred via 1 wavefront from right-to-left (N=163, 64%), from the central part (N=18, 7%), or via multiple wavefronts (N=72, 28%). Left atrioventricular groove activation occurred via (1) BB: N=108, 43%; (2) pulmonary vein area: N=9, 3%; or (3) BB and pulmonary vein area: N=136, 54%; depending on which route had the shortest interatrial conduction time (P<0.001). Ischemic valvular heart disease patients more often had central BB activation and left atrioventricular groove activation via pulmonary vein area compared with ischemic heart disease patients (N=16 [13%] versus N=2 [2%]; P=0.009 and N=86 [71%] versus N=59 [45%]; P<0.001, respectively). Total activation times were longer in patients with AF (AF: 136±20 [92-186] ms; no AF: 114±17 [74-156] ms; P<0.001), because of prolongation of right atrium (P=0.018) and BB conduction times (P<0.001).
Conclusions: Atrial excitation during SR is affected by underlying heart disease and AF, resulting in alternative routes for BB and left atrioventricular groove activation and prolongation of total activation times. Knowledge of atrial excitation patterns during SR and its electropathological variations, as demonstrated in this study, is essential to further unravel the pathogenesis of AF.
Keywords: atrial fibrillation; coronary artery disease; sinus rhythm; valvular regurgitation.
© 2018 The Authors. Published on behalf of the American Heart Association, Inc., by Wiley.
Figures
References
-
- Fast VG, Kléber AG. Role of wavefront curvature in propagation of cardiac impulse. Cardiovasc Res. 1997;33:258–271. - PubMed
-
- Spach MS, Kootsey JM. The nature of electrical propagation in cardiac muscle. Am J Physiol. 1983;244:H3–H22. - PubMed
-
- de Bakker JMT, van Rijen HMV. Continuous and discontinuous propagation in heart muscle. J Cardiovasc Electrophysiol. 2006;17:567–573. - PubMed
-
- Lemery R, Birnie D, Tang ASL, Green M, Gollob M, Hendry M, Lau E. Normal atrial activation and voltage during sinus rhythm in the human heart: an endocardial and epicardial mapping study in patients with a history of atrial fibrillation. J Cardiovasc Electrophysiol. 2007;18:402–408. - PubMed
-
- Tapanainen JM, Jurkko R, Holmqvist F, Husser D, Kongstad O, Mäkijärvi M, Toivonen L, Platonov PG. Interatrial right‐to‐left conduction in patients with paroxysmal atrial fibrillation. J Interv Card Electrophysiol. 2009;25:117–122. - PubMed
Publication types
MeSH terms
LinkOut - more resources
Full Text Sources
Other Literature Sources
Medical
Research Materials
