. 2018 May;209(1):157-171.
doi: 10.1534/genetics.118.300744. Epub 2018 Mar 8.

Proteasome Activity Is Influenced by the HECT_2 Protein Ipa1 in Budding Yeast

Affiliations

Proteasome Activity Is Influenced by the HECT_2 Protein Ipa1 in Budding Yeast

Anne P Lutz et al. Genetics. 2018 May.

Abstract

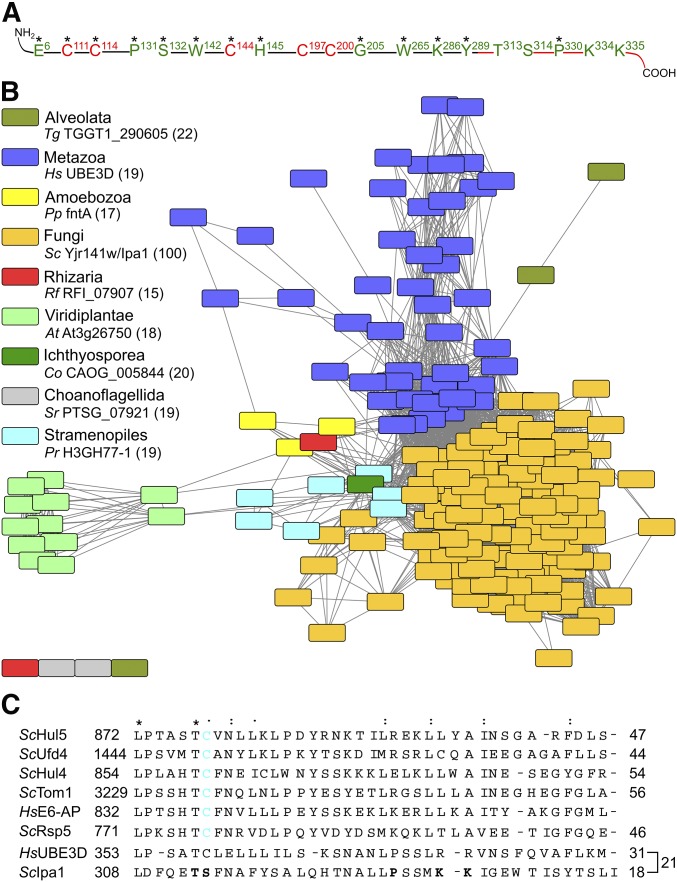
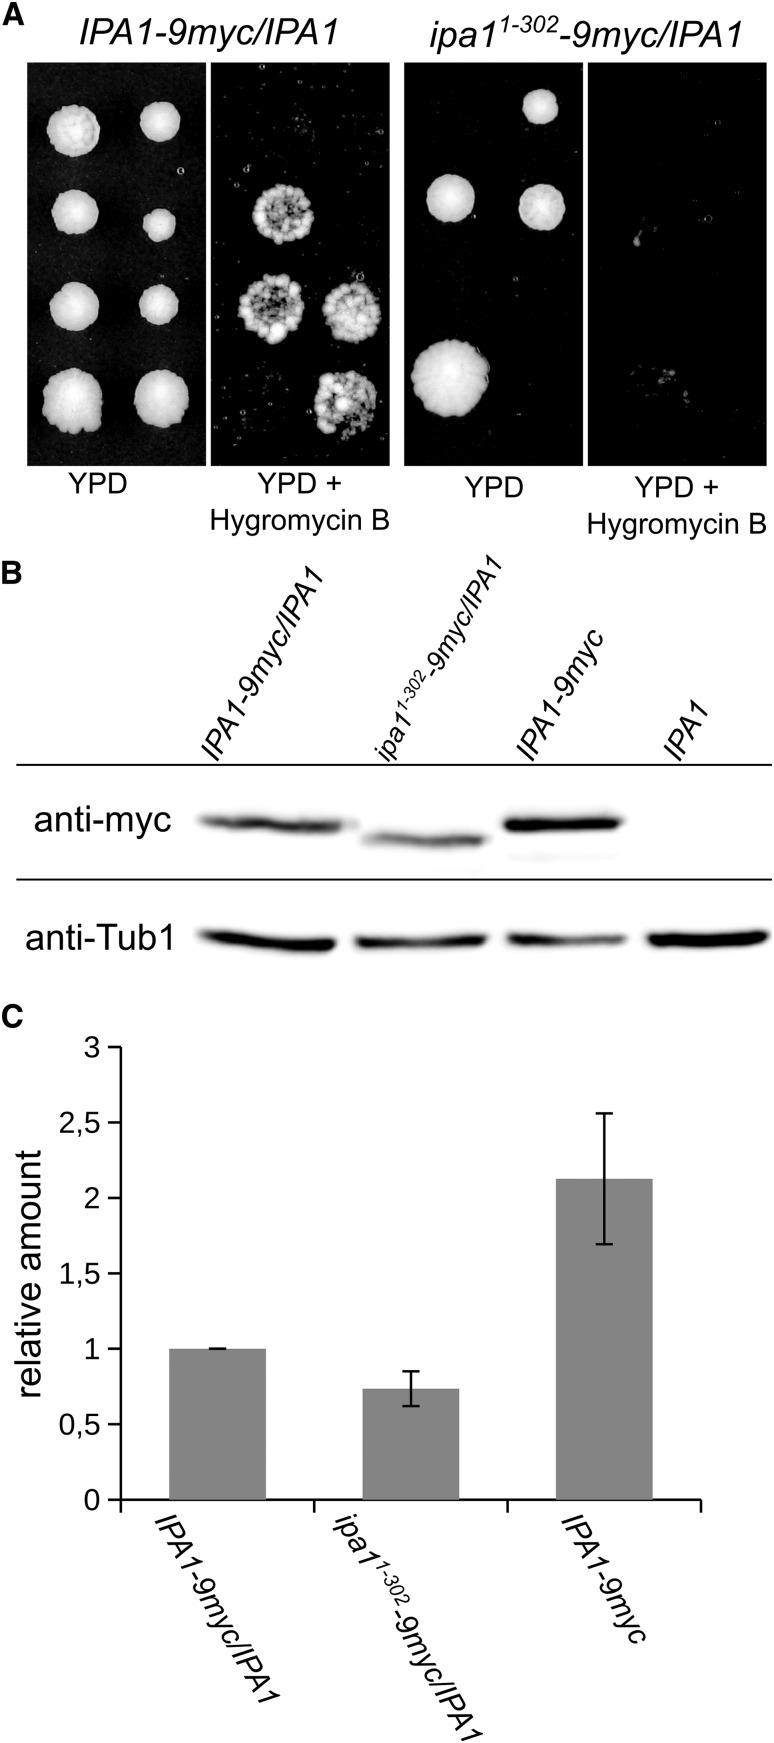
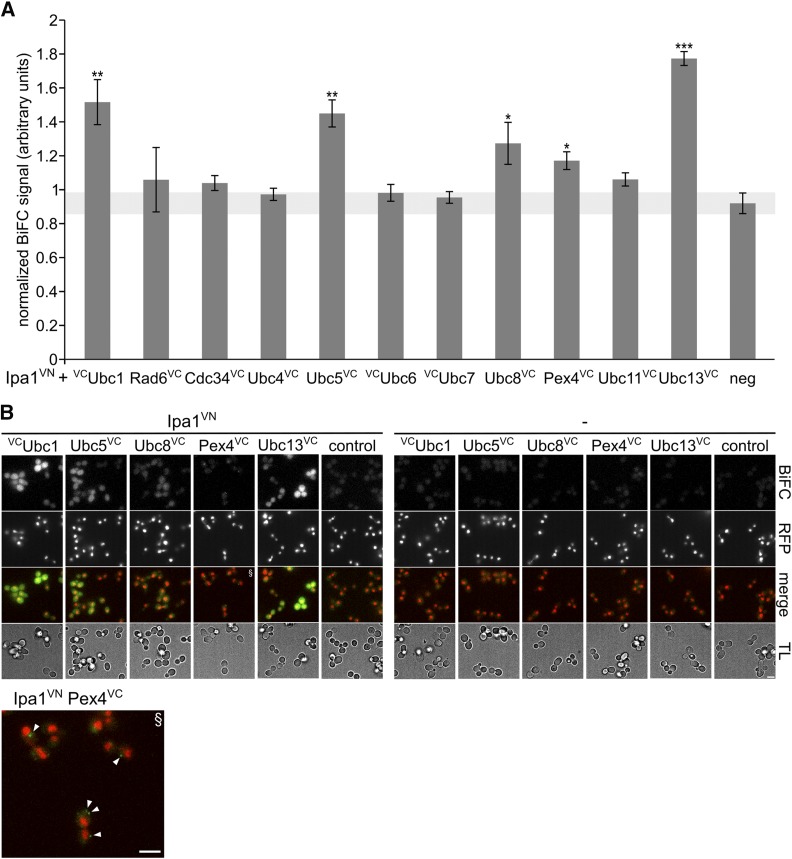
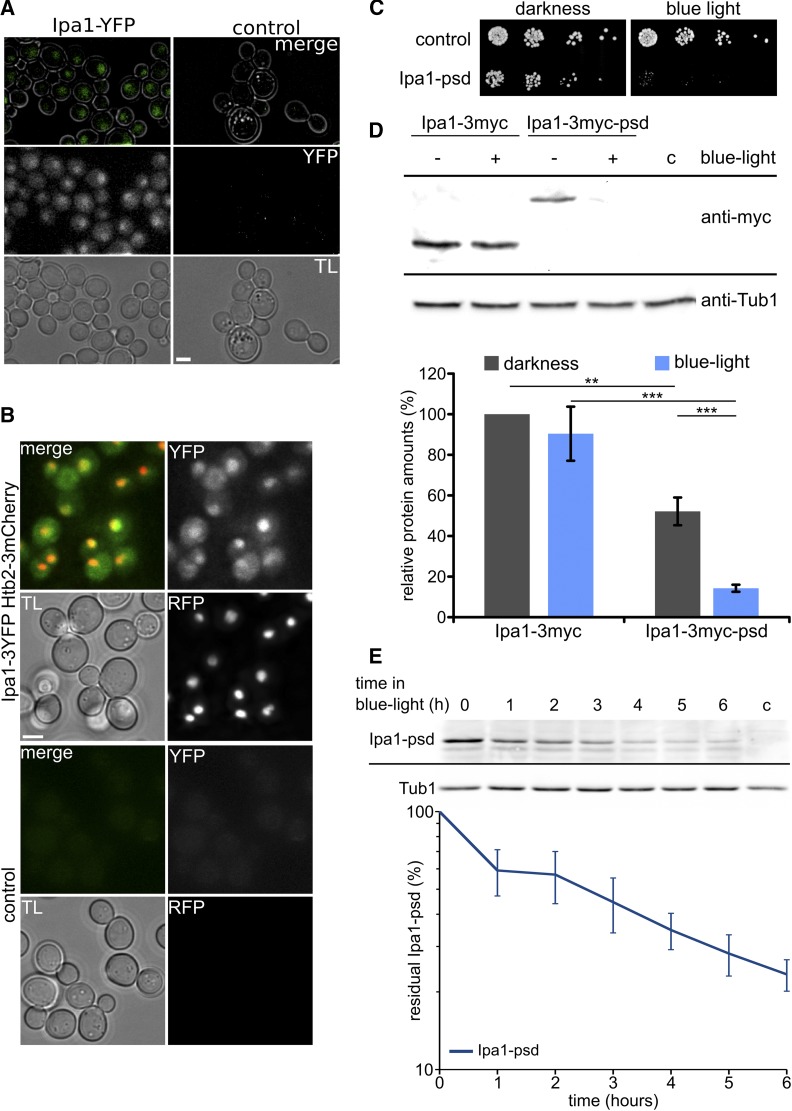
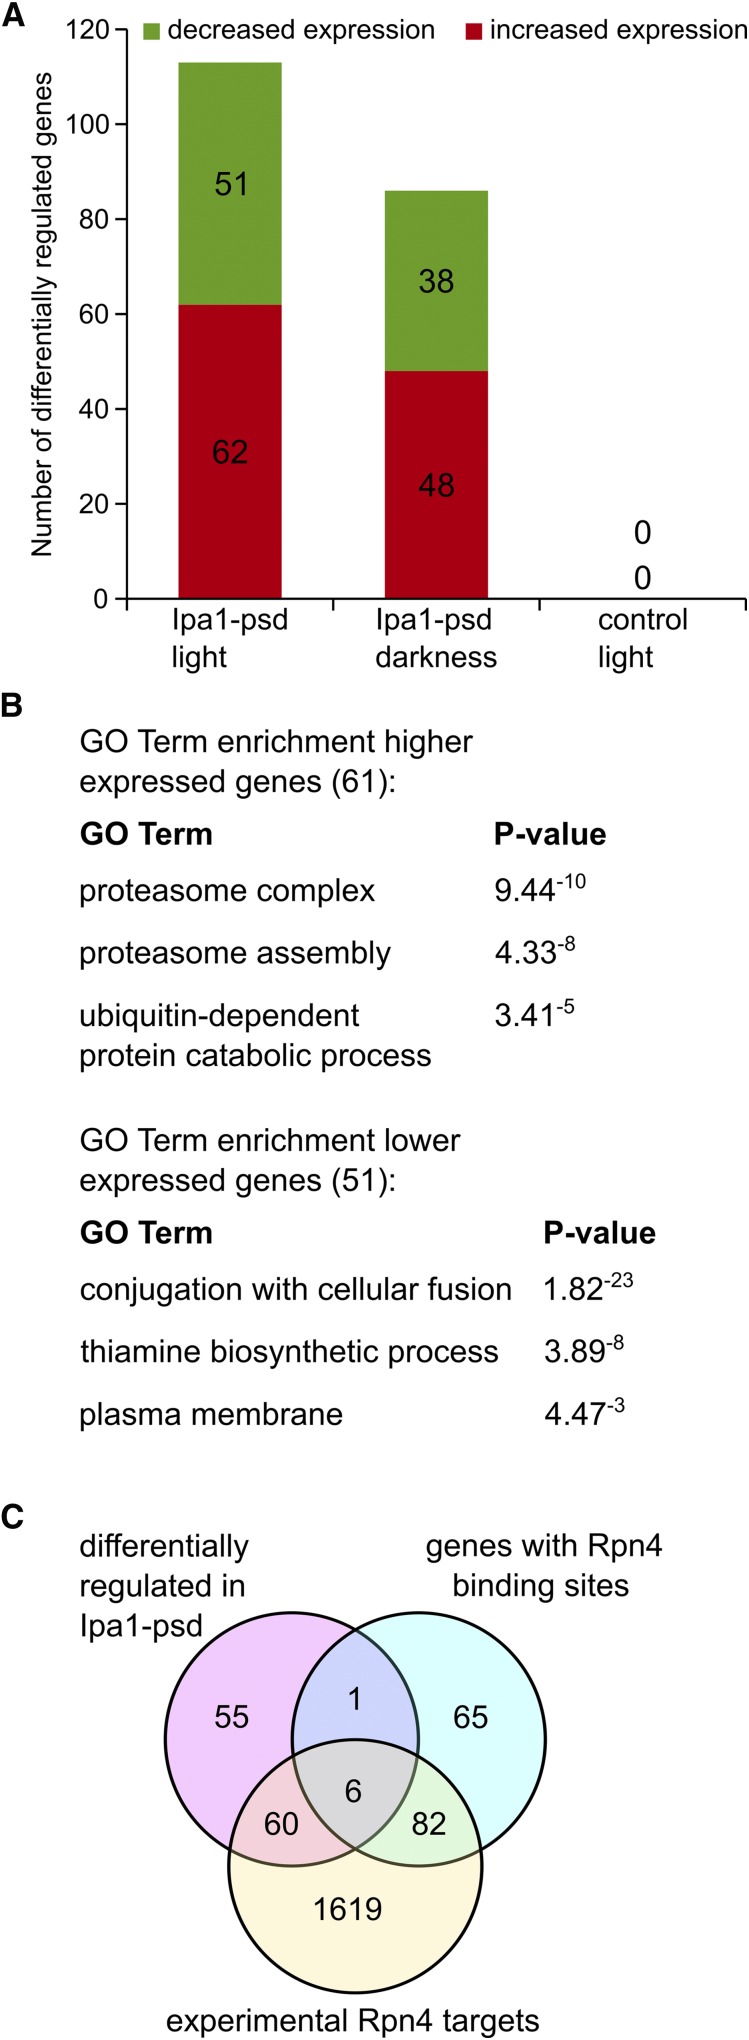
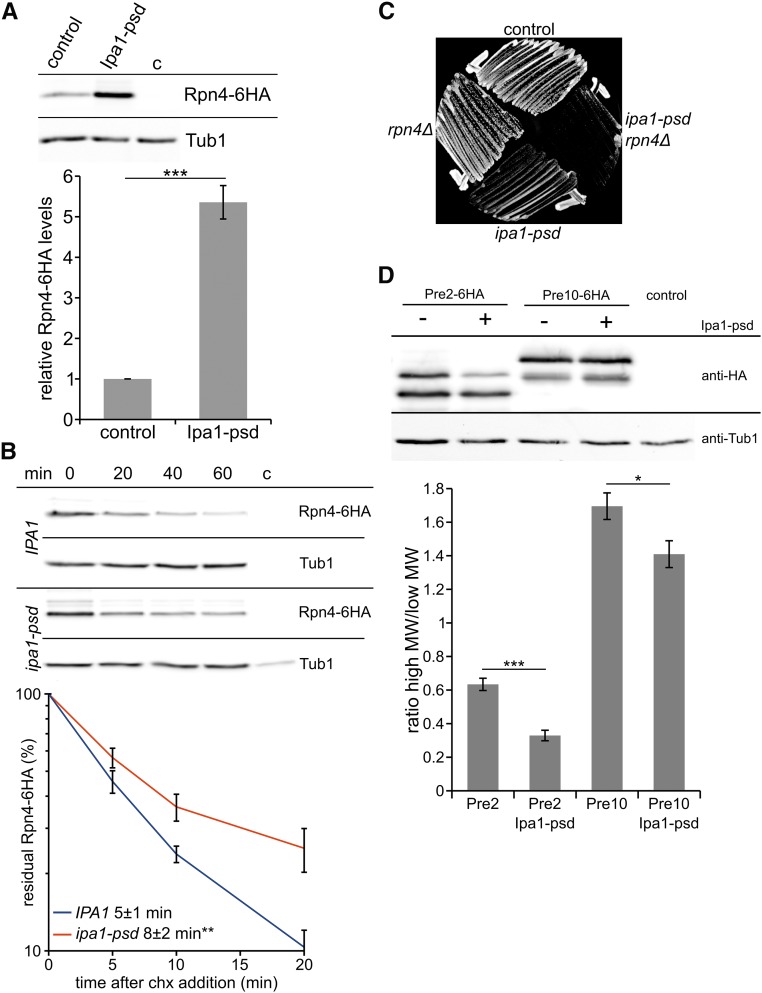
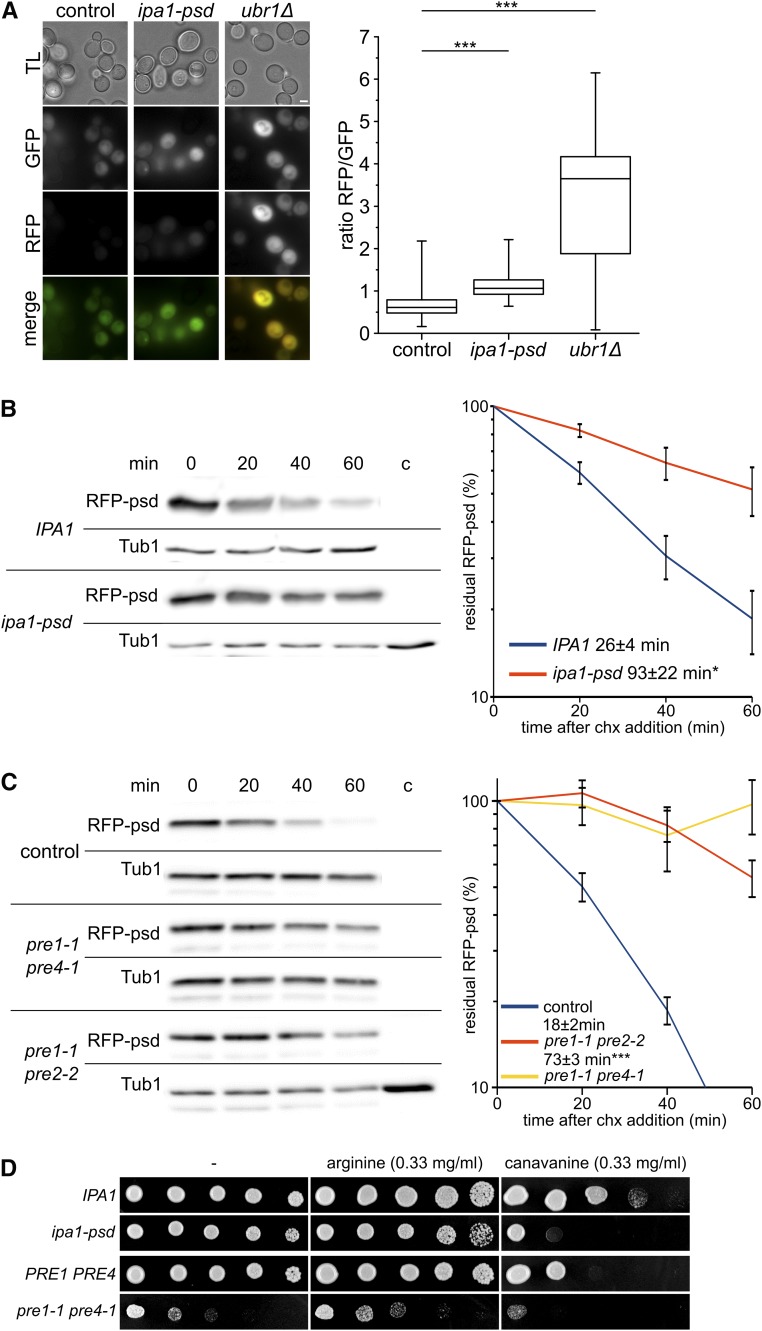
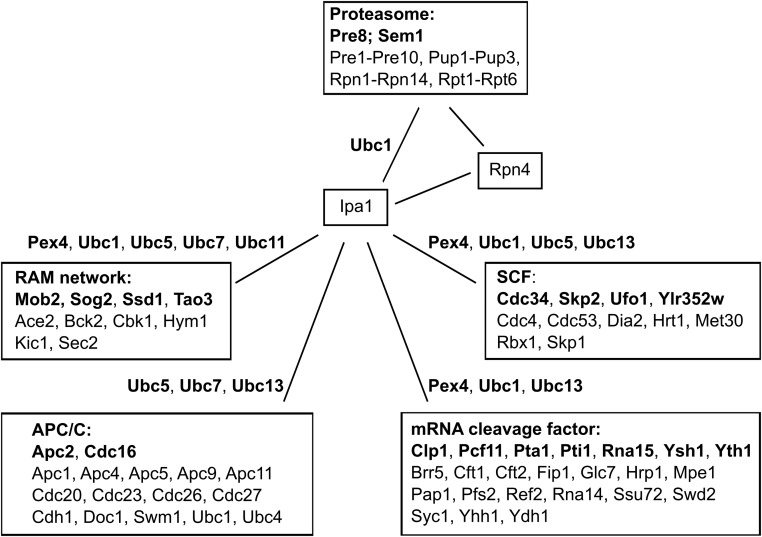
The ubiquitin-proteasome system (UPS) controls cellular functions by maintenance of a functional proteome and degradation of key regulatory proteins. Central to the UPS is the proteasome that adjusts the abundance of numerous proteins, thereby safeguarding their activity or initiating regulatory events. Here, we demonstrate that the essential Saccharomyces cerevisiae protein Yjr141w/Ipa1 (Important for cleavage and PolyAdenylation) belongs to the HECT_2 (homologous to E6-AP carboxyl terminus_2) family. We found that five cysteine residues within the HECT_2 family signature and the C-terminus are essential for Ipa1 activity. Furthermore, Ipa1 interacts with several ubiquitin-conjugating enzymes in vivo and localizes to the cytosol and nucleus. Importantly, Ipa1 has an impact on proteasome activity, which is indicated by the activation of the Rpn4 regulon as well as by decreased turnover of destabilized proteasome substrates in an IPA1 mutant. These changes in proteasome activity might be connected to reduced maturation or modification of proteasomal core particle proteins. Our results highlight the influence of Ipa1 on the UPS. The conservation within the HECT_2 family and the connection of the human HECT_2 family member to an age-related degeneration disease might suggest that HECT_2 family members share a conserved function linked to proteasome activity.

Keywords: Saccharomyces cerevisiae; polyadenylation and RNA cleavage; proteasome; protein degradation; ubiquitin–proteasome system.


Figures

Figure 1
Figure 1
The yeast protein Yjr141w/Ipa1 belongs to the eukaryotic HECT_2 family. (A) Conserved residues within Yjr141w/Ipa1 match the family signature of HECT_2-family members. Highly conserved residues are marked with an asterisk. Residues or parts of the protein that are essential for Yjr141w/Ipa1 function are marked in red, residues in green are dispensable. (B) Sequence similarity network of HECT_2-family members. Sequences with an identity > 50% were clustered together in one node. The coloring shows affiliation of the protein(s) to one of the eukaryotic subgroups (source: taxonomy database of UniProt). For each subgroup, one protein is given as example; its sequence identity to S. cerevisiae Yjr141w/Ipa1 is given in parentheses. The Pfam identifiers for each node are given in Table S1. (C) Alignment of the C-termini of S. cerevisiae HECT-family members Hul5, Ufd4, Hul4, Tom1, and Rsp5 with the prototype HECT-domain protein human E6-AP and HECT_2-family members Yjr141w/Ipa1 and human homolog UBE3D. The conservation grade of a residue is shown by asterisk, double point, and point to indicate strict conservation, and higher and lower similarity, respectively. The percentage of identical residues between E6-AP and the other sequences is given on the right side as well as the percentage of identical residues between UBE3D and Ipa1. The cysteine residue important for ubiquitylation in HECT domain E3s is highlighted in cyan, residues that have been mutated in Ipa1 to assay for functionality are marked in bold letters. At, Arabidopsis thaliana; Co, Capsaspora owczarzaki; E3, ubiquitin-protein ligase; HECT, homologous to E6-AP carboxyl terminus; Hs, Homo sapiens; Pp, Polysphondylium pallidum; Pr, Phytophthora ramorum; Rf, Reticulomyxa filosa; Sc: S. cerevisiae; Sr, Salpingoeca rosetta; Tg, Toxoplasma gondii.
Figure 2
Figure 2
The C-terminus of Ipa1 is important for viability of yeast cells. (A) Tetrad analysis of cells with a C-terminal deletion variant of Ipa1. The epitope 9myc was added at the very C-terminus of Ipa1 or after position R302 in diploid yeast cells to create heterozygously marked Ipa1 variants. After tetrad analysis, colonies growing on YPD were probed for growth on YPD + Hygromycin B (selection marker with the epitope inserted on the chromosome). (B) Analysis of Ipa11–302-9myc abundance compared to full-length Ipa1-9myc. Whole-cell extracts were prepared from cells growing logarithmically in liquid cultures. The blot was probed with anti-myc and anti-Tub1 (tubulin 1, loading control) antibodies. (C) Quantification of Ipa1-9myc abundance. Exemplary blot is shown in (B). Graph shows the mean of four independent measurements, Ipa1-9myc levels were normalized to Tub1 signal (error bar, SEM).
Figure 3
Figure 3
Ipa1 interacts with E2s. (A) Quantification of BiFC signals in cells containing Ipa1-VN- and VC-tagged E2s. Plasmid-based PGAL1-IPA1-VN (nc: empty plasmid) was expressed by addition of galactose in yeast strains containing chromosomal insertions of VC at genes encoding for E2s (as indicated) as well as Rpn7-RFP. BiFC signals were quantified by fluorimeter measurements. (n = 4; error bar, SEM; statistical significance of differences was tested by a two-sided Student’s t-test; *** P < 0.001, ** P < 0.01, and * P < 0.05). (B) Fluorescence microscopy BiFC analysis of Ipa1-VN with Ubc1-VC, Ubc5-VC, Ubc8-VC, Pex4-VC, and Ubc13-VC. The same strains as in (A) were used, exemplary images are shown. The arrowheads in the enlarged Pex4 merge image point to dot-like BiFC signals. Bar size corresponds to 3 µm. BiFC, bimolecular fluorescence complementation; E2s, ubiquitin-conjugating enzymes; neg, negative control; RFP, red fluorescent protein; VC, C-terminal Venus fragment; VN, N-terminal Venus fragment.
Figure 4
Figure 4
Ipa1 localizes to the cytosol and nucleus and is essential for growth. (A) Ipa1-YFP localizes to cytosol and the nucleus. Cells in logarithmic growth phase were subjected to fluorescence microscopy. TL image, maximum projections of deconvolved z-stacks for fluorescence channel, and TL/YFP overlays are shown (bar size 2 µm). (B) Colocalization analysis of Ipa1-3YFP with Htb2-3mCherry. Maximum projections of deconvolved z-stacks are shown for fluorescence channels (bar size 2 µm). (C) Serial dilution drop assay with control cells compared to Ipa1-psd cells in darkness and exposed to blue light (465 nm 30 µmol m−2 s−1). Serial dilutions (1:5) were spotted on solid YPD medium. (D) Abundance of Ipa1-3myc compared to Ipa1-3myc-psd. Cell extracts were prepared from cells growing logarithmically in liquid cultures kept in darkness or exposed to blue light for 5 hr. The blot was probed with anti-myc and anti-Tub1 (loading control) antibodies. Cropped blots are shown, no relevant parts of the blot were removed. For quantification, Ipa1 levels were normalized to Tub1 signal; Ipa1-3myc in darkness was used as reference (n = 4; error bar, SEM; statistical significance of differences was tested by a two-sided Student’s t-test; ** P ≤ 0.01 and *** P ≤ 0.001). (E) Kinetics of Ipa1-3myc-psd depletion after exposure to blue light. Example blot and graph showing quantification of four independent experiments. Ipa1 levels were normalized to Tub1 signal (n = 4; error bar, SEM). psd, photo-sensitive degron; RFP, red fluorescent protein; TL, transmitted light; Tub, tubulin; YFP, yellow fluorescent protein.
Figure 5
Figure 5
Transcriptome analysis of Ipa1-depleted cells. (A) Number of genes with significantly altered mRNA levels (more than twofold). Ipa1-psd (photo-sensitive degron) cells exposed to light or kept in darkness were compared to control cells exposed to the same conditions; control cells exposed to light were compared to control cells kept in darkness. Cells were treated with blue light (465 nm, 30 µmol m−2 s−1) for 5 hr prior to cell lysis as indicated. (B) serial pattern of expression levels locator and gene ontology (GO)-term enrichment analysis of genes with higher and lower mRNA abundance in Ipa1-depleted cells compared to control cells. Genes significantly changed in expression by more than twofold were used for the analysis. (C) Genes differentially regulated in Ipa1-psd cells are Rpn4 targets. Venn diagram showing the number of genes belonging to the group of direct Rpn4 targets, experimentally identified Rpn4 targets, and differentially regulated in Ipa1-psd cells.
Figure 6
Figure 6
The abundance and half-life of Rpn4 is increased in Ipa1-depleted cells. (A) Abundance of Rpn4-6HA in control cells compared to Ipa1-psd cells. Whole-cell extracts have been prepared from cells growing logarithmically in liquid cultures exposed to blue light. The blot was probed with anti-HA and anti-Tub1 (loading control) antibodies. Cropped blots are shown, no relevant parts of the blot were removed. Graph shows the mean of eight independent measurements, Rpn4-HA levels were normalized to Tub1 signal (error bar, SEM; statistical significance of half-life differences was tested by a two-sided Student’s t-test, *** P ≤ 0.001). (B) Analysis of Rpn4-6HA stability. The translation inhibitor chx was added to the cells after removal of the first sample (t = 0 min). Samples were analyzed by western blot, four independent measurements were performed for the graph (error bar, SEM; statistical significance of differences was tested by a two-sided Student’s t-test, ** P ≤ 0.01). (C) Growth assay of control cells, rpn4Δ, ipa1-psd, and ipa1-psd rpn4Δ cells in darkness. Cells were streaked on solid YPD medium and incubated at 30° for 2 days. (D) Appearance of Pre2-6HA and Pre10-6HA in presence and absence of Ipa1. Whole-cell extracts were prepared from cells growing logarithmically in liquid cultures exposed to blue light. The blot was probed with anti-HA and anti-Tub1 (loading control) antibodies. The graph shows the ratio of high-molecular weight signals of Pre2 and Pre10 compared to low-molecular weight signals (n = 4; error bar = SEM; statistical significance of differences was tested by a two-sided Student’s t-test; * P ≤ 0.05 and *** P ≤ 0.001). Chx, cycloheximide; HA, hemagglutinin; psd, photo-sensitive degron; Tub, tubulin.
Figure 7
Figure 7
Proteasome activity is reduced in cells depleted for Ipa1. (A) Single-cell measurement of tandem-fluorescent protein substrate Ub-Arg-RFP-GFP abundance (using plasmid pMaM101) in control cells, ipa1-psd cells, and ubr1Δ cells exposed to blue light. Fluorescence microscopy images were recorded in TL, GFP, and RFP channels (bar size 2 µm). The graph shows quantification of GFP/RFP fluorescence intensity ratio in single cells. Whiskers comprise values of all single-cell measurements (n ≥ 350). Statistical significance of half-life differences was tested by a two-sided Student’s t-test (*** P ≤ 0.001). (B) Stability of RFP-psd in control cells compared to cells depleted for Ipa1-psd. Chx was added to the cultures after removing the first sample (t = 0 min). Cells were exposed to blue light before and during the experiment. Samples were analyzed by western blot and the abundance of RFP-psd quantified. The half-life was determined by fitting single experiments to an exponential decay with the software Qtiplot. Graphs show the mean of at least six independent experiments; error bars, SEM; statistical significance of differences was tested by a two-sided Student’s t-test (* P ≤ 0.05). (C) Stability of RFP-psd in control cells compared to cells compromised in proteasomal activity (pre1-1 pre2-2 and pre1-1 pre4-1). Experimental conditions as in (C). Graphs show the mean of four independent experiments; error bars, SEM; statistical significance of half-life differences was tested by a two-sided Student’s t-test (*** P ≤ 0.001). Please note that in the case of strain pre1-1 pre4-1, the half-life could not be obtained by fitting for some of the experiments, therefore no significance testing was performed. (D) Canavanine growth assay of ipa1-psd cells, pre1-1 pre4-1 cells, and isogenic control cells. Serial dilutions (1:5) of cells were spotted on minimal medium and grown in darkness for 4 days at 30°. Arginine or canavanine was added at a concentration of 0.33 mg/ml to the plate. Chx, cycloheximide; psd, photo-sensitive degron; RFP, red fluorescent protein; TL, transmitted light; Tub, tubulin; Ub, ubiquitin.
Figure 8
Figure 8
Genetic interactions between Ipa1 and subunits of the proteasome, the RAM (regulation of Ace2p transcription factor and polarized morphogenesis) network, the APC/C (anaphase-promoting complex), the mRNA cleavage factor, and the SCF (Skp, Cullin, F-box-containing complex) are shared by E2s (ubiquitin-conjugating enzymes) interacting with Ipa1. Negative genetic interactions are indicated by a line, the individual subunits of a complex showing a genetic interaction with Ipa1 are given in bold. The E2s that interacted with Ipa1 and have been published to have a genetic interaction with subunits of the RAM network, the APC/C, the mRNA cleavage factor, and the SCF are placed next to the line. Please note that also other E2s that did not show interaction with Ipa1 have genetic interactions with these complexes. Similarly, we omitted to indicate the genetic interactions between subunits of the proteasome with subunits of the RAM network, the APC/C, the mRNA cleavage factor, and the SCF, as well as genetic interactions between Rpn4 with subunits of the RAM network, the APC/C, and the mRNA cleavage factor.

Similar articles

Cited by

References

    1. Acquaviva C., Pines J., 2006. The anaphase-promoting complex/cyclosome: APC/C. J. Cell Sci. 119: 2401–2404. 10.1242/jcs.02937 - DOI - PubMed
    1. Alabrudzinska M., Skoneczny M., Skoneczna A., 2011. Diploid-specific [corrected] genome stability genes of S. cerevisiae: genomic screen reveals haploidization as an escape from persisting DNA rearrangement stress. PLoS One 6: e21124 (erratum: PLoS One 6) 10.1371/journal.pone.0021124 - DOI - PMC - PubMed
    1. Ardley H. C., Robinson P. A., 2005. E3 ubiquitin ligases. Essays Biochem. 41: 15–30. 10.1042/bse0410015 - DOI - PubMed
    1. Ausubel, F. M., R. E. Kingston, F. G. Seidman, K. Struhl, D. D. Moore et al. (Editors), 1995 Current Protocols in Molecular Biology. John Wiley and Sons, New York.
    1. Blomen V. A., Majek P., Jae L. T., Bigenzahn J. W., Nieuwenhuis J., et al. , 2015. Gene essentiality and synthetic lethality in haploid human cells. Science 350: 1092–1096. 10.1126/science.aac7557 - DOI - PubMed

Publication types

Substances