. 2018 Mar 27;115(13):3279-3284.
doi: 10.1073/pnas.1720415115. Epub 2018 Mar 8.

Metastability and avalanche dynamics in strongly correlated gases with long-range interactions

Affiliations

Metastability and avalanche dynamics in strongly correlated gases with long-range interactions

Lorenz Hruby et al. Proc Natl Acad Sci U S A. .

Abstract

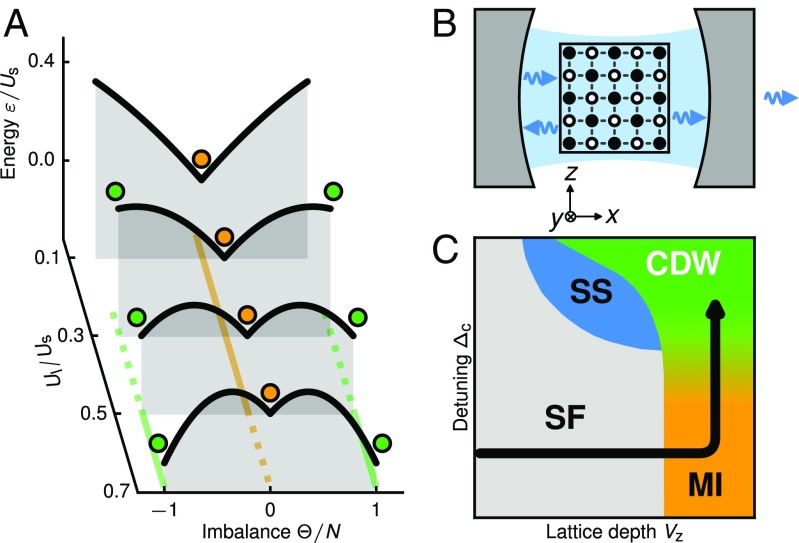
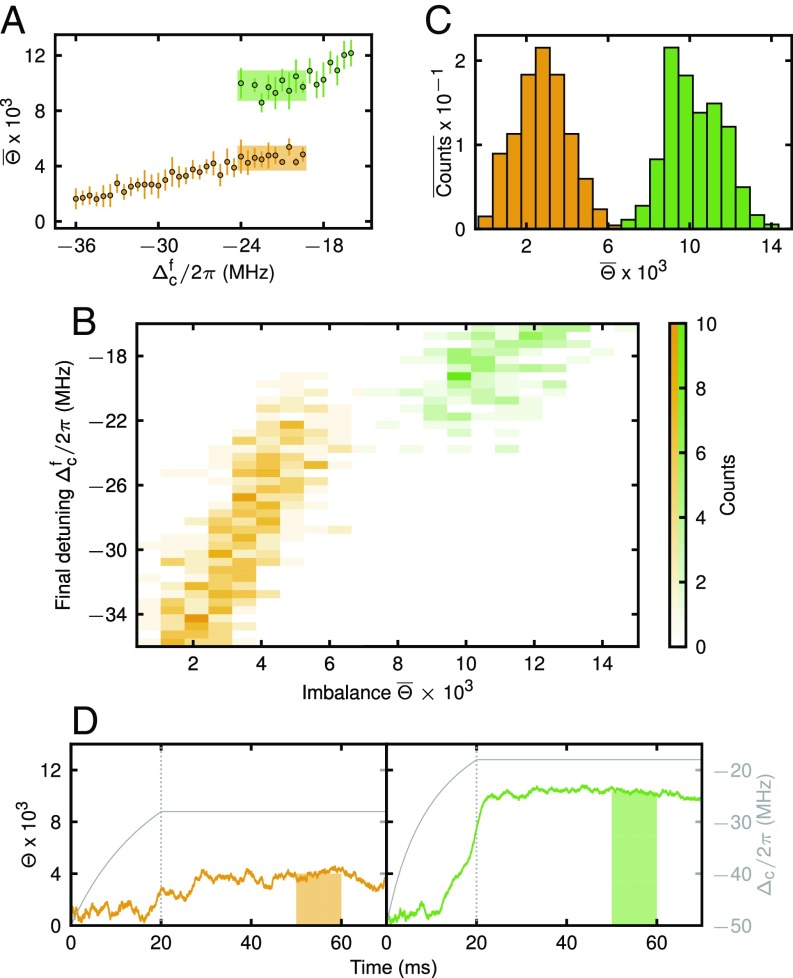
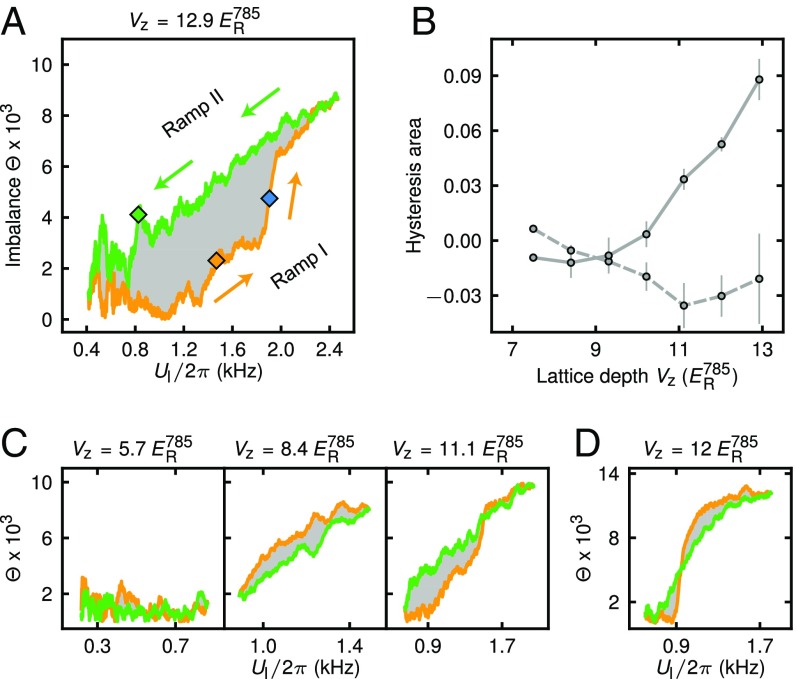
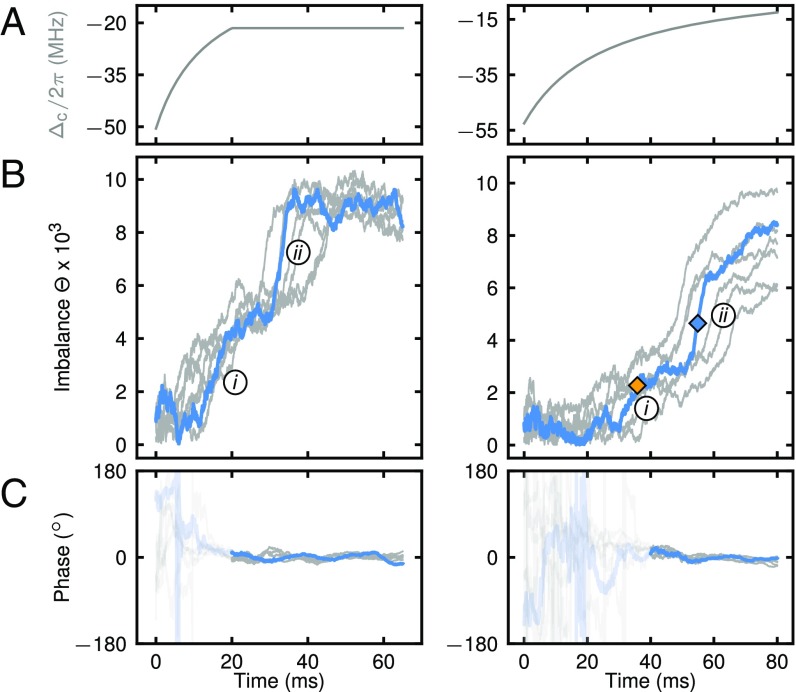
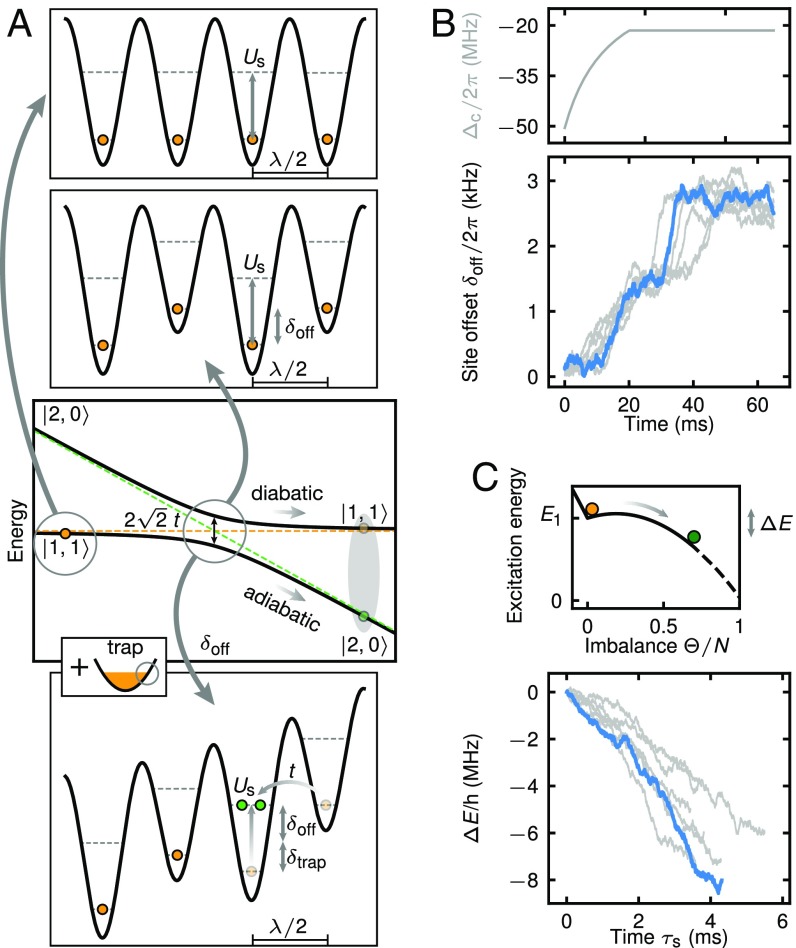
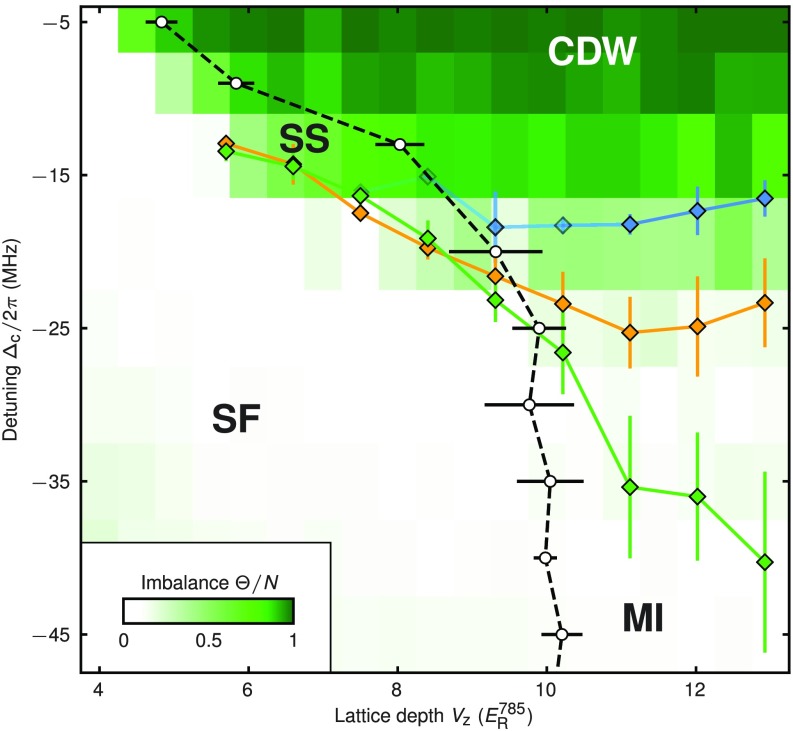
We experimentally study the stability of a bosonic Mott insulator against the formation of a density wave induced by long-range interactions and characterize the intrinsic dynamics between these two states. The Mott insulator is created in a quantum degenerate gas of 87-Rubidium atoms, trapped in a 3D optical lattice. The gas is located inside and globally coupled to an optical cavity. This causes interactions of global range, mediated by photons dispersively scattered between a transverse lattice and the cavity. The scattering comes with an atomic density modulation, which is measured by the photon flux leaking from the cavity. We initialize the system in a Mott-insulating state and then rapidly increase the global coupling strength. We observe that the system falls into either of two distinct final states. One is characterized by a low photon flux, signaling a Mott insulator, and the other is characterized by a high photon flux, which we associate with a density wave. Ramping the global coupling slowly, we observe a hysteresis loop between the two states-a further signature of metastability. A comparison with a theoretical model confirms that the metastability originates in the competition between short- and global-range interactions. From the increasing photon flux monitored during the switching process, we find that several thousand atoms tunnel to a neighboring site on the timescale of the single-particle dynamics. We argue that a density modulation, initially forming in the compressible surface of the trapped gas, triggers an avalanche tunneling process in the Mott-insulating region.

Keywords: avalanche dynamics; cavity QED; extended Bose-Hubbard model; metastability; quantum gas.


Conflict of interest statement

The authors declare no conflict of interest.

Figures

Fig. 1.
Fig. 1.
Metastability and system overview. (A) Mean-field results from the toy model. In the presence of short-range interactions U𝗌 and global-range interactions U𝗅 atoms placed in a lattice potential can show metastable behavior. States (indicated by circles) can be protected by an energy barrier and the present state of the system depends on its history, leading to hysteresis. The Mott insulator (orange line) and the charge density wave (green lines) are stable (solid), metastable (dashed), or unstable. (B) Our system consists of a Bose–Einstein condensate coupled to a single mode of an optical resonator in the presence of 3D optical lattices. The atoms can create a particle imbalance Θ by arranging in a checkerboard pattern which maximizes scattering of photons from a z lattice (not shown) into the resonator mode. (C) Schematic phase diagram of the system with a superfluid (SF, gray), a lattice supersolid (SS, blue), a Mott insulator (MI, orange), and a charge-density wave (CDW, green) phase. The shaded region between the MI and CDW indicates a region of hysteresis between the phases. The black arrow illustrates the experimental sequence: We prepare the atoms in the SF phase and ramp up the 3D optical lattices to increase U𝗌, which brings the system into the MI phase. Subsequently, we carry out a detuning ramp toward cavity resonance which increases U𝗅.
Fig. 2.
Fig. 2.
Metastability measurement. Shown is the observation of two distinct steady-state imbalances Θ¯, shown in orange and green, and exemplary time traces. We prepare an MI and then quench the detuning from Δ𝖼/2π=50 MHz to Δ𝖼𝖿 closer to resonance within 20 ms, increasing U𝗅. (A) Mean values of the imbalance Θ¯. Errors are SD. The imbalance Θ¯ is separated by a gap of 5.2(1.4)×103 atoms into two levels. (B) Histogram as a function of Θ¯ and Δ𝖼𝖿 with bin sizes of 700 atoms in Θ¯ and 0.5 MHz in Δ𝖼𝖿. (C) Histogram of the normalized sum of all counts with respect to Θ¯. For the normalization see Evaluation of the Metastability Measurement. (D) Exemplary time traces for quenches ending at Δ𝖼𝖿/2π=28 MHz (Left) and Δ𝖼𝖿/2π=18 MHz (Right). The shaded regions indicate where the averaged imbalance Θ¯ is extracted. This experiment was performed with 25(2)×103 atoms at maximum lattice depths of (V𝗑,V𝗒,V𝗓)=(17.3E𝖱𝟩𝟪𝟧,30.7E𝖱𝟨𝟩𝟣,11.1E𝖱𝟩𝟪𝟧).
Fig. 3.
Fig. 3.
Hysteresis measurement. (A) We prepare an MI and then sweep the detuning toward cavity resonance and subsequently back to the starting point. The imbalance created during ramp I is shown in orange and the imbalance during ramp II is shown in green. Arrows indicate the ramp directions. We quantify the amount of hysteresis created by the area highlighted in gray. Diamonds signal where we deduce the threshold for the creation (orange) and the disappearance (green) of an imbalance Θ and where the center of an imbalance jump is located (blue) (Hysteresis Loops: Data Evaluation and Comparison of Different Ramp Times). (B) We study the hysteresis area (Hysteresis Loops: Data Evaluation and Comparison of Different Ramp Times) as a function of the final lattice depth V𝗓; the data are shown by the solid line. The dashed line represents the case where the y lattice is switched off to reduce U𝗌. (C) Exemplary traces of the imbalance Θ as a function of U𝗅 for different lattice depths V𝗓. These experiments were performed with 17(2)×103 atoms at maximum lattice depths of (V𝗑,V𝗒,V𝗓)=(14.5E𝖱𝟩𝟪𝟧,26.2E𝖱𝟨𝟩𝟣,12.9E𝖱𝟩𝟪𝟧). (D) Exemplary trace with the y lattice switched off. Here we prepare 15(1)×103 atoms at V𝗑=12.4 E𝖱𝟩𝟪𝟧 and V𝗓=12.0 E𝖱𝟩𝟪𝟧 (Lattice Calibrations). Error bars are SD (Hysteresis Loops: Data Evaluation and Comparison of Different Ramp Times).
Fig. 4.
Fig. 4.
Time traces of the dynamics of the system. (A–C, Left) Data from the metastability measurement. (A–C, Right) Data from the hysteresis measurement. (A) Ramps in the detuning Δ𝖼. (B) Imbalance dynamics. Starting from a state with almost zero imbalance Θ, we first observe a slow increase in Θ (i) followed by a sudden jump (ii). (A–C, Left) After quenching the detuning Δ𝖼 in the MI phase toward cavity resonance, we hold all experimental parameters constant. We observe dynamics in the imbalance Θ during and after the detuning quench. The exemplary trace of Θ as a function of time at a final detuning of Δ𝖼𝖿/2π=21 MHz is shown in blue, while several repetitions of the experiment at Δ𝖼𝖿/2π=23to20 MHz are shown in gray. (A–C, Right) We sweep the detuning Δ𝖼 within 80 ms from the MI phase toward cavity resonance. An exemplary trace of Θ as a function of time is shown in blue where we observe dynamics in the imbalance during the sweep. Multiple repetitions of the experiment with the same parameters are shown in gray, here V𝗓=12.9 E𝖱𝟩𝟪𝟧. Diamonds signal where we deduce the threshold for the creation of an imbalance Θ (orange) and where the center of the imbalance jump (ii) is located (blue) (Hysteresis Loops: Data Evaluation and Comparison of Different Ramp Times). (C) Phase of the light field indicating a broken 2 symmetry. We observe a constant phase after an imbalance is created throughout the slow increase (i) and jump (ii) in Θ (Imbalance Dynamics: Data Evaluation). In the shaded region, the signal is dominated by technical noise due to low photon flux.
Fig. 5.
Fig. 5.
Microscopic dynamics and energy redistribution of the system. (A) Microscopic description of the system dynamics following the detuning quench, in terms of a Landau–Zener transition. One-dimensional lattice potentials are shown for a normal lattice (Top), a dynamic superlattice with site offset δoff generated by superfluid surface atoms (Middle), and a tilted dynamic superlattice with spatially varying site offset δoff+δtrap as encountered at the edge of the harmonic trap (Bottom). Colored circles represent atoms in the states |1,1 (orange) or |2,0 (green). Resonant nearest-neighbor tunneling is allowed when the site offset δoff+δtrap equals the short-range interaction strength U𝗌. (B) Dynamics of the site offset δoff in the metastability measurement. (C, Top) Sketch of the excitation energy of the bulk atoms. Superfluid surface atoms add a symmetry-breaking field to the toy model. During the imbalance jump (ii), the highly excited system reduces the initial excitation energy E1 via an avalanche of inherently nonadiabatic Landau-Zener transitions by an amount of ΔE. Colored circles represent the state of the system, where the MI state (orange) results from all bulk atoms in the |1,1 state and the CDW state (green) from atoms being in a superposition of |1,1 and |2,0 states. Accordingly, the relative imbalance saturates at Θ/N<1, indicated by the dashed line. (C, Bottom) Reduction of ΔE as a function of time τs during the imbalance jump (ii). (B and C) Exemplary traces use the same data as shown in Fig. 4. δoff and ΔE are inferred from the photon flux leaking from the cavity.
Fig. 6.
Fig. 6.
Previously extracted transition points superimposed on a phase diagram of the system. Results from the hysteresis measurement: Orange and green diamonds indicate the thresholds where an imbalance is created and where it vanishes during detuning ramps, respectively. The center of the imbalance jump is shown in blue, where transparency indicates the probability of occurrence of the jump. For details on the measurement of the phase diagram, see Phase Diagram Measurement: Data Evaluation. White data points and the associated black dashed line indicated the loss of coherence, from left to right, which we infer from the measured BEC fraction, and green tiles indicate states with nonzero imbalance. We identify a superfluid (SF), a lattice supersolid (SS), an MI, and a CDW phase. This experiment was performed with 16(1)×103 atoms at maximum lattice depths of (V𝗑,V𝗒,V𝗓)=(15.7E𝖱𝟩𝟪𝟧,26.2E𝖱𝟨𝟩𝟣,12.9E𝖱𝟩𝟪𝟧). For further details see ref. and Phase Diagram Measurement: Data Evaluation. Error bars are SD (Phase Diagram Measurement: Data Evaluation and Fig. S4).

References

    1. Anderson Pw, Halperin BI, Varma cM. Anomalous low-temperature thermal properties of glasses and spin glasses. Philos Mag. 1972;25:1–9.
    1. Karplus M, McCammon JA. Molecular dynamics simulations of biomolecules. Nat Struct Biol. 2002;9:646–652. - PubMed
    1. Brazhkin VV. Metastable phases and ‘metastable’ phase diagrams. J Phys Condens Matter. 2006;18:9643–9650.
    1. Binder K. Theory of first-order phase transitions. Rep Prog Phys. 1987;50:783–859.
    1. Menotti C, Trefzger C, Lewenstein M. Metastable states of a gas of dipolar bosons in a 2D optical lattice. Phys Rev Lett. 2007;98:235301. - PubMed

Publication types

LinkOut - more resources