. 2018 Feb 26:11:983-996.
doi: 10.2147/OTT.S153814. eCollection 2018.

Kanglaite reverses multidrug resistance of HCC by inducing apoptosis and cell cycle arrest via PI3K/AKT pathway

Affiliations

Kanglaite reverses multidrug resistance of HCC by inducing apoptosis and cell cycle arrest via PI3K/AKT pathway

Chendong Yang et al. Onco Targets Ther. .

Retraction in

Abstract

Background: Multidrug resistance (MDR) frequently contributes to the failure of chemotherapeutic treatments in patients diagnosed with hepatocellular carcinoma (HCC). Revealing the molecular mechanism of MDR is indispensable for the development of effective chemotherapeutic drugs.

Purpose: Due to the low-toxicity modulators to inhibit MDR, we considered that Kanglaite (KLT) is a potential agent for reversing MDR in HCC.

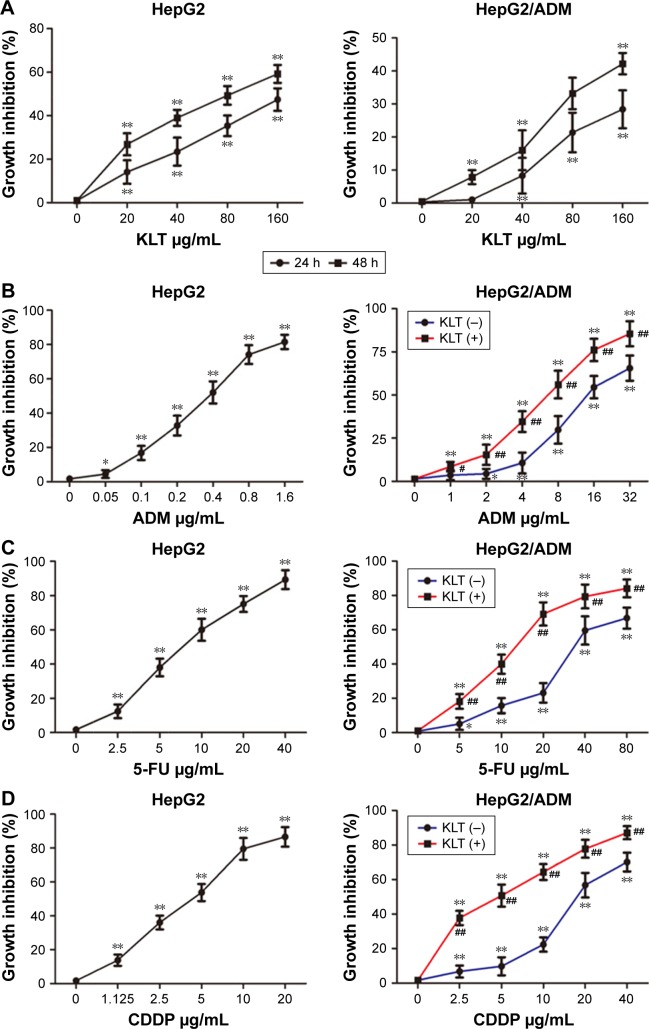
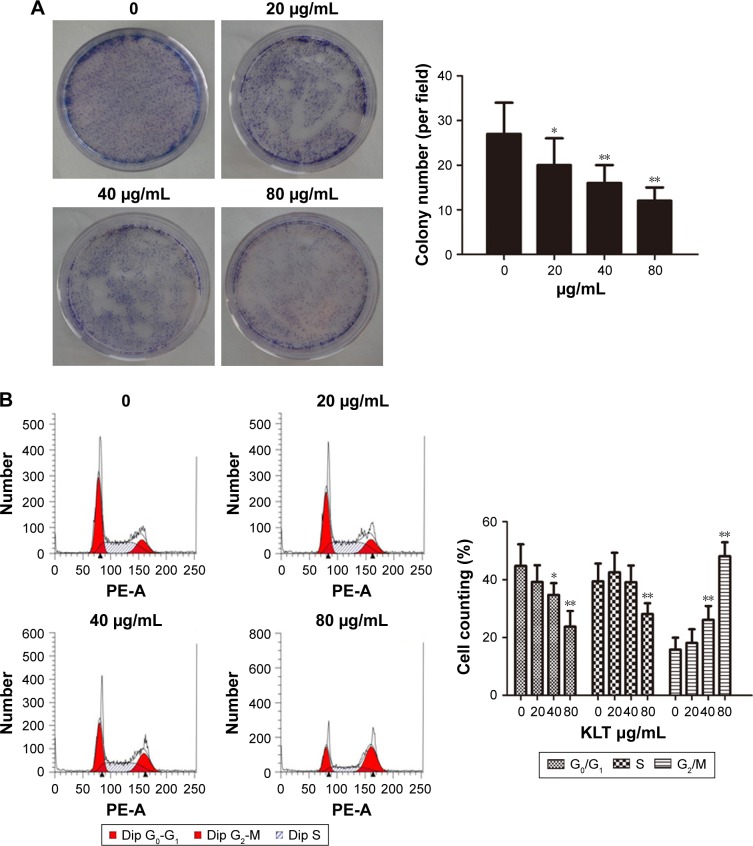
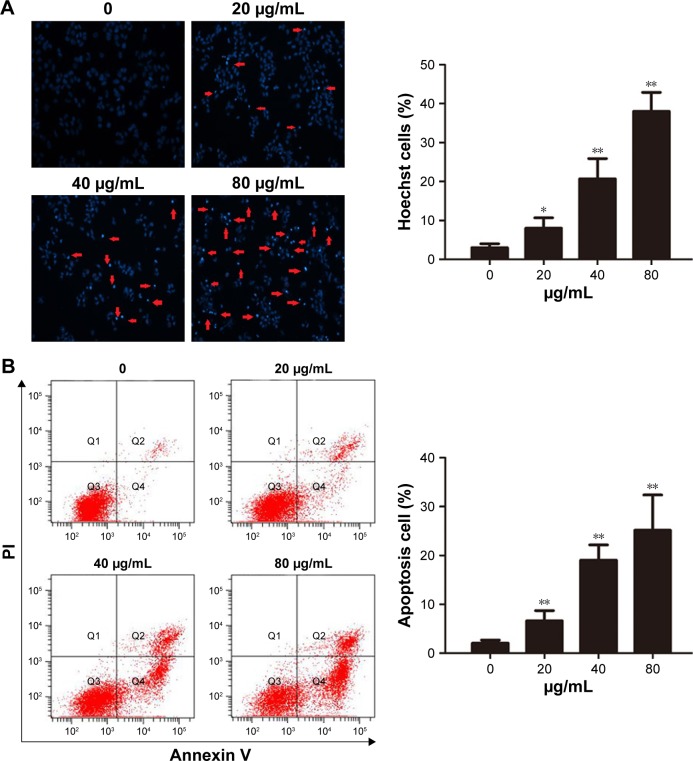
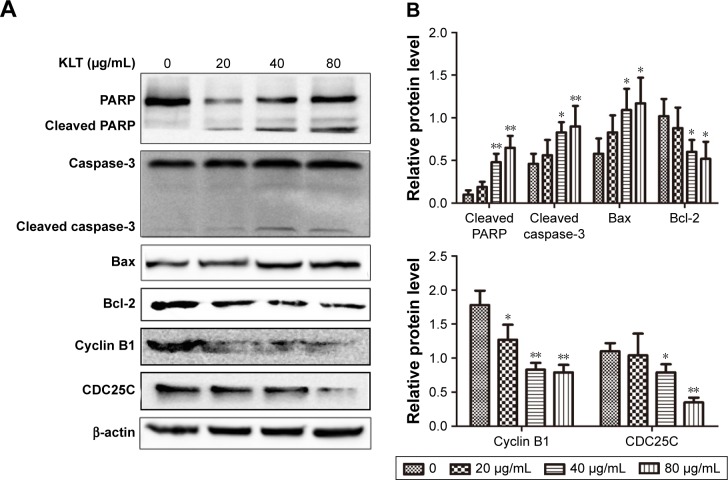
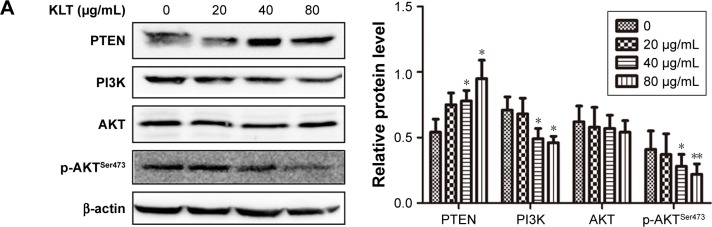
Materials and methods: BEL-7402/5-fluorouracil (5-FU) and HepG2/adriamycin (ADM) were analyzed for cell viability, colony formation assay, cell scratch assay, and cell cycle analysis and apoptosis assay by flow cytometry. The expression of PARP, caspase-3, Bax, Bcl-2, CDC25C, Cyclin B1 and phosphorylation of PTEN, PI3K, and AKT in HepG2/ADM cells were detected by western blotting.

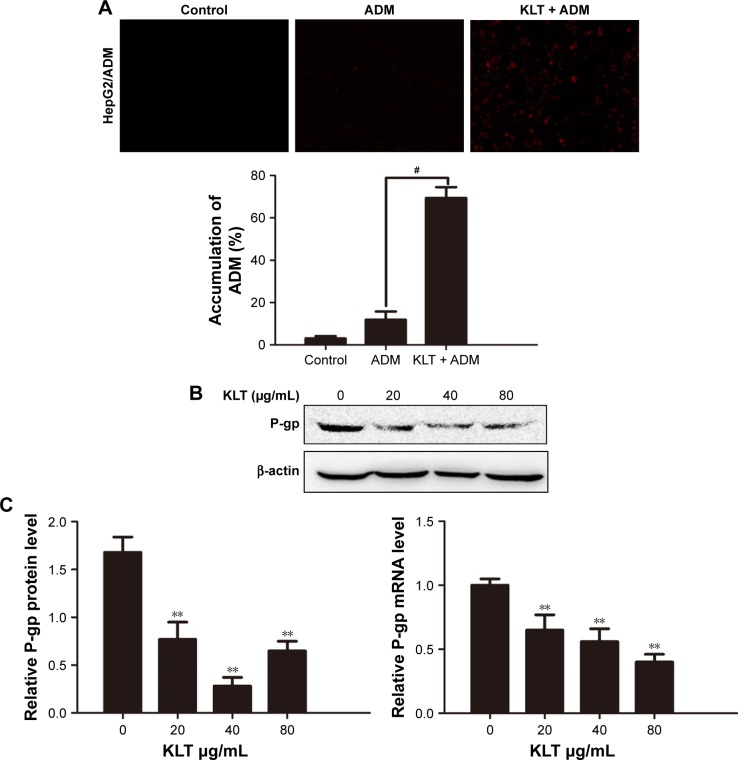
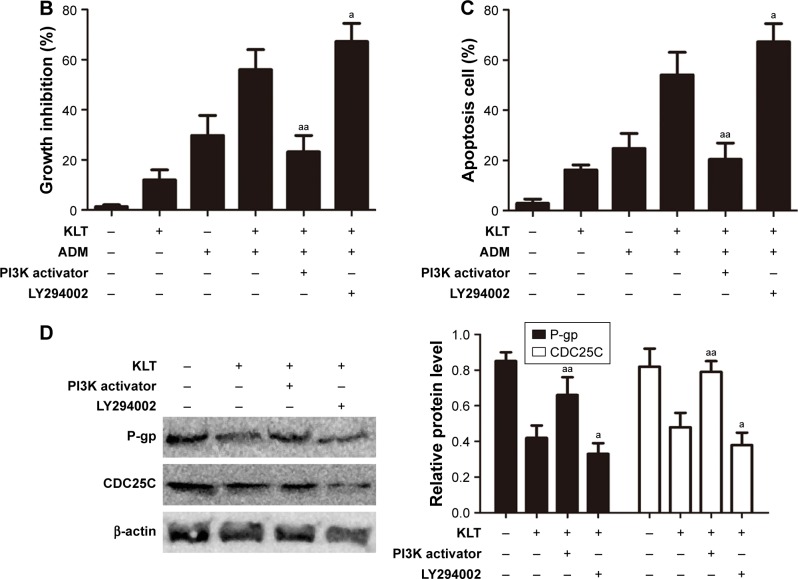
Results: The proliferation of drug-resistant cell lines BEL-7402/5-FU and HepG2/ADM pretreated with KLT was significantly inhibited when compared with drug alone. KLT could increase the accumulation of ADM in HepG2/ADM cells. In this study, we found that KLT treatment notably reduced cell viability, induced apoptosis and cell cycle arrest in human HepG2/ADM and BEL-7402/5-FU cells, and effectively reversed the MDR by p-glycoprotein (P-gp) inhibition. Moreover, KLT decreased the phosphorylation of AKT and PI3K in KLT-treated HepG2/ADM cells. These data together implied that KLT might reverse drug resistance in HCC by blocking the PI3K/AKT signaling.

Conclusion: We demonstrated that KLT reversed MDR of human HCC by inducing apoptosis and cell cycle arrest via the PI3K/AKT signaling pathway.

Keywords: PI3K/AKT pathway; apoptosis; hepatocellular carcinoma; kanglaite; multidrug resistance.


Conflict of interest statement

Disclosure The authors declare no conflict of interest.

Figures

Figure 1
Figure 1
Cytotoxicity and chemotherapeutics sensitivity of KLT. Notes: (A) The percentage of viable cells were measured by the CCK-8 assay at 24 and 48 h relative to no-drug controls and KLT, and concentrations were plotted as a dose–response curve (n=6 per group). HepG2/ADM cells were treated with ADM (B), 5-FU (C), and CDDP (D) for 48 h with or without the pretreatment of KLT (20 μM), and the cell viability was determined by CCK-8 assay. *P<0.05; **P<0.01 vs control and #P<0.05; ##P<0.01 vs drug alone (one-way ANOVA, post hoc comparisons, and Tukey’s test). Columns represent the mean from three independent experiments, and bars represent SDs. Abbreviations: ADM, adriamycin; ANOVA, analysis of variance; CCK-8, Cell Counting Kit-8; CDDP, cisplatin; 5-FU, 5-fluorouracil; KLT, Kanglaite.
Figure 2
Figure 2
KLT reverses the MDR by inhibition of MDR-related genes expression. Notes: (A) The intracellular fluorescence intensity of the accumulation of ADM assessed by the inverted fluorescence microscope. The above assays of ADM accumulation were quantified. (B) The expression levels of P-gp were detected by Western blot analysis. Results represent mean values of three experiments (±SD). (C) Gene expression analysis of P-gp in HepG2/ADM cells by quantitative real-time PCR. The relative quantification value, fold difference, is expressed as 2−ΔΔCt. Data represent three independent experiments. #P<0.05 vs ADM and **P<0.01 vs control (one-way ANOVA, post hoc comparisons, and Tukey’s test). Columns represent the mean from three independent experiments, and bars represent SDs. Abbreviations: ADM, adriamycin; ANOVA, analysis of variance; KLT, Kanglaite; MDR, multidrug resistance; PCR, polymerase chain reaction; P-gp, p-glycoprotein.
Figure 3
Figure 3
KLT inhibits colony formation and induces cell cycle arrest in hepatocellular carcinoma cells. Notes: (A) Representative images were captured from HepG2/ADM cells incubated with KLT for 48 h and subjected to cell colony-formation assays. These assays were quantified. (B) Cell cycle distribution of HepG2/ADM cells was determined 48 h after treatment with KLT (n=3). These assays were quantified. *P<0.05 and **P<0.01 vs control (one-way ANOVA, post hoc comparisons, Tukey’s test). Columns represent the mean from three independent experiments, and bars represent SDs. Abbreviations: ADM, adriamycin; ANOVA, analysis of variance; Dip, diploid; KLT, Kanglaite; MDR, multidrug resistance; P-gp, p-glycoprotein.
Figure 4
Figure 4
KLT induces apoptosis in hepatocellular carcinoma cells. Notes: (A) Cells were stained with Hoechst 33342 (5 μg/mL) and subjected to analysis of apoptosis population (n=3). (B) PE-Annexin V staining of phosphatidylserine exposed on the cell surface was measured by flow cytometric analysis (n=3). Data derived from three separate experiments are presented as the mean ± SD. *P<0.05 and **P<0.01 vs control (one-way ANOVA, post hoc comparisons, and Tukey’s test). Columns represent the mean from three independent experiments, and bars represent SDs. Abbreviations: ANOVA, analysis of variance; KLT, Kanglaite; PI, propidium iodide.
Figure 5
Figure 5
KLT suppresses the expression of PARP, caspase-3, Bax, Bcl-2, CDC25C, and cyclin B1 in hepatocellular carcinoma cells. Notes: (A) Total cell lysates were prepared for Western blot analysis of the apoptosis regulatory proteins and cell cycle-related proteins (n=3). (B) The densitometric analysis bar diagram of the results. Columns represent the mean from three independent experiments and bars represent SDs. *P<0.05 and **P<0.01 vs control (one-way ANOVA, post hoc comparisons, and Tukey’s test). Columns represent the mean from three independent experiments, and bars represent SDs. Abbreviations: ANOVA, analysis of variance; KLT, Kanglaite; PARP, poly (ADP-ribose) polymerase.
Figure 6
Figure 6
KLT regulates the PI3K/AKT signaling pathway in HepG2/ADM cells. Notes: (A) Total cell lysates were prepared for Western blot analysis of the PI3K/AKT signaling pathway proteins (n=3). The densitometric analysis bar diagram of the results is shown. HepG2/ADM cells were treated with KLT and ADM in the absence or presence of LY294002 (4 μM) and PI3K activator (50 μg/mL). Cell viability was measured by MTT assay (B), and the proportion of Annexin V-positive cells was analyzed by flow cytometry (C). (D) Effect of LY294002 and PI3K activator on MDR and cell cycle arrest by immunoblotting with P-gp and CDC25C. Columns represent the mean from three independent experiments, and bars represent SDs. *P<0.05 and **P<0.01 vs control, aP<0.05 and aaP<0.01 vs KLT + ADM or KLT (one-way ANOVA, post hoc comparisons, and Tukey’s test). Abbreviations: ADM, adriamycin; ANOVA, analysis of variance; KLT, Kanglaite; MDR, multidrug resistance; MTT, (3-(4,5-dimethylthiazol-2-yl)-2,5-diphenyltetrazolium bromide) tetrazolium; P-gp, p-glycoprotein.
Figure 6
Figure 6
KLT regulates the PI3K/AKT signaling pathway in HepG2/ADM cells. Notes: (A) Total cell lysates were prepared for Western blot analysis of the PI3K/AKT signaling pathway proteins (n=3). The densitometric analysis bar diagram of the results is shown. HepG2/ADM cells were treated with KLT and ADM in the absence or presence of LY294002 (4 μM) and PI3K activator (50 μg/mL). Cell viability was measured by MTT assay (B), and the proportion of Annexin V-positive cells was analyzed by flow cytometry (C). (D) Effect of LY294002 and PI3K activator on MDR and cell cycle arrest by immunoblotting with P-gp and CDC25C. Columns represent the mean from three independent experiments, and bars represent SDs. *P<0.05 and **P<0.01 vs control, aP<0.05 and aaP<0.01 vs KLT + ADM or KLT (one-way ANOVA, post hoc comparisons, and Tukey’s test). Abbreviations: ADM, adriamycin; ANOVA, analysis of variance; KLT, Kanglaite; MDR, multidrug resistance; MTT, (3-(4,5-dimethylthiazol-2-yl)-2,5-diphenyltetrazolium bromide) tetrazolium; P-gp, p-glycoprotein.

Similar articles

Cited by

References

    1. Torre LA, Bray F, Siegel RL, Ferlay J, Lortet-Tieulent J, Jemal A. Global cancer statistics, 2012. CA Cancer J Clin. 2015;65(2):87–108. - PubMed
    1. Ma L, Chua MS, Andrisani O, So S. Epigenetics in hepatocellular carcinoma: an update and future therapy perspectives. World J Gastroenterol. 2014;20(2):333–345. - PMC - PubMed
    1. Ruan J, Zheng H, Rong X, et al. Overexpression of cathepsin B in hepatocellular carcinomas predicts poor prognosis of HCC patients. Mol Cancer. 2016;15:17. - PMC - PubMed
    1. Gatenby RA, Smallbone K, Maini PK, et al. Cellular adaptations to hypoxia and acidosis during somatic evolution of breast cancer. Br J Cancer. 2007;97(5):646–653. - PMC - PubMed
    1. Lotz C, Kelleher DK, Gassner B, Gekle M, Vaupel P, Thews O. Role of the tumor microenvironment in the activity and expression of the p-glycoprotein in human colon carcinoma cells. Oncol Rep. 2007;17(1):239–244. - PubMed

Publication types