

Prognostic value of circulating tumor cells detected with the CellSearch System in patients with gastric cancer: evidence from a meta-analysis
- PMID: 29520152
- PMCID: PMC5833773
- DOI: 10.2147/OTT.S154114
Prognostic value of circulating tumor cells detected with the CellSearch System in patients with gastric cancer: evidence from a meta-analysis
Abstract
Background: Circulating tumor cells (CTCs) have been proposed as a marker for predicting the prognosis of cancer. However, the prognostic value of CTCs detected with the CellSearch System in patients with gastric cancer (GC) remains controversial. We performed a meta-analysis of available studies to investigate this topic.
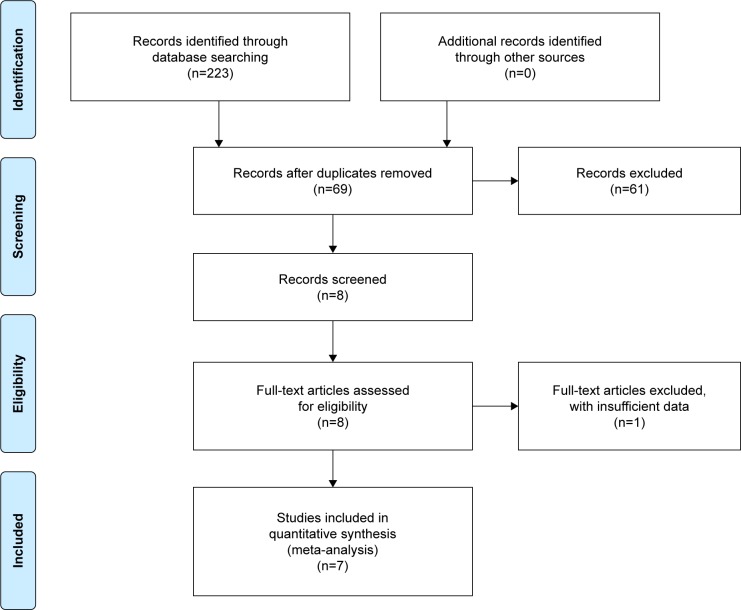
Methods: Two authors systematically searched the studies independently in PubMed, Science Citation Index, Cochrane Database, Embase, and the references in relevant studies (up to September 2017) using keywords. Our meta-analysis was performed in Stata software, version 12.0 (2011; Stata Corp, College Station, TX, USA), with the risk ratio (RR), hazard ratio (HR), and 95% CI as the effect measures. Subgroup analyses and meta-regression were also conducted.
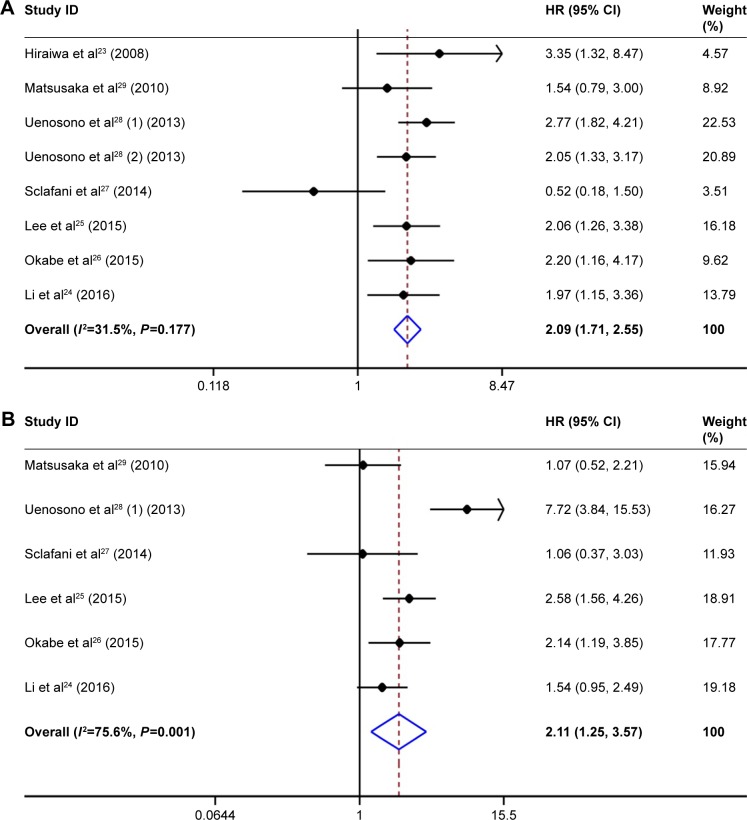
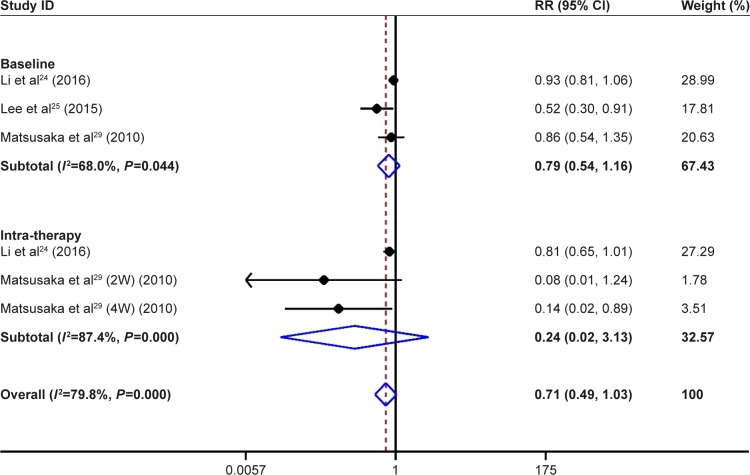
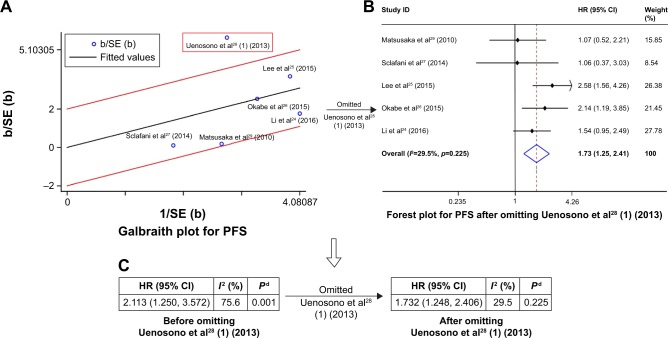
Results: Seven studies (including eight sets of data) containing 579 patients with GC from four countries were included in this meta-analysis. The pooled results showed CTC-positive status detected by the CellSearch System was significantly associated with poor overall survival (HR =2.09, 95% CI [1.71, 2.55], P<0.001, I2=31.5%) and progression-free survival (HR =2.11, 95% CI [1.25, 3.57], P=0.005, I2=75.6%) of patients with GC, regardless of sampling time. The disease control rate of CTC-positive group was lower than that of CTC-negative group for both baseline and intra-therapy, although no statistical difference existed at both sampling time points (baseline: 69.5% versus 81.8%, RR=0.79, 95% CI [0.54, 1.16], P=0.23, I2=68.0%; intra-therapy: 50.0% versus 85.9%, RR=0.24, 95% CI [0.02, 3.13], P=0.28, I2=87.4%).
Conclusion: Our meta-analysis demonstrated that CTCs detected with the CellSearch System from the peripheral blood had significant prognostic value and might predict poor response to chemotherapy for patients with GC.
Keywords: chemotherapy; circulating tumor cells; gastric cancer; meta-analysis; prognosis.
Conflict of interest statement
Disclosure The authors report no conflicts of interest in this work.
Figures
References
-
- Torre LA, Bray F, Siegel RL, Ferlay J, Lortet-Tieulent J, Jemal A. Global cancer statistics, 2012. CA Cancer J Clin. 2015;65(2):87–108. - PubMed
-
- Correia M, Machado JC, Ristimaki A. Basic aspects of gastric cancer. Helicobacter. 2009;14(Suppl 1):36–40. - PubMed
-
- Budd GT, Cristofanilli M, Ellis MJ, et al. Circulating tumor cells versus imaging-predicting overall survival in metastatic breast cancer. Clin Cancer Res. 2006;12(21):6403–6409. - PubMed
-
- Kubisch I, de Albuquerque A, Schuppan D, Kaul S, Schaich M, Stolzel U. Prognostic role of a multimarker analysis of circulating tumor cells in advanced gastric and gastroesophageal adenocarcinomas. Oncology. 2015;89(5):294–303. - PubMed
LinkOut - more resources
Full Text Sources
Other Literature Sources
Miscellaneous
